
A Visual Analysis Approach to Static Postural Control Acquired by a
Force Plate
Thales Vinicius de Brito Uê, Danilo Medeiros Eler
a
and Iracimara de Anchieta Messias
Faculty of Science and Technology, São Paulo State University, Presidente Prudente, São Paulo, Brazil
Keywords: Visual Analysis, Center of Pressure, Postural Control, Force Plate, Elderly People, Sarcopenia.
Abstract: Force plates are biomechanical equipment responsible for providing data to understand the mechanics of
human movement. However, mathematical software used to process data are a barrier to researchers without
much experience and prior knowledge on areas from Exact Sciences and Information Technology. This paper
aims to implement a visual approach to analyze human static postural control obtained from a force plate as
a means of helping researchers interpret its data. By measuring ground reaction forces and their respective
torque moments, the displacements of the Center of Pressure in its medial‑lateral and anterior-posterior
directions are calculated to observe and evaluate the postural balance’s behavior. Data processing and
visualization were implemented using Python programming language. Scatter plots, heat maps, violin plots,
and box plots were used as graphic representations for data collected before and after muscular intervention
in older adults with sarcopenia. Applying the developed approach makes it possible to visually observe each
of the Center of Pressure’s oscillation values measured for data collection and how they relate. This fact
differs from statistical information, which summarizes the sample’s data in a quantified value. Therefore, data
visualization is essential to complement the statistical data and provide another view to force plate data.
1 INTRODUCTION
Biomechanical equipment is essential to obtain data
related to the mechanics of human movement and its
evaluation and understanding. In addition to the
quantitative analysis methods for this area of study,
there is the qualitative part of the evaluation, which
can be provided through data visualization for a
non
‑
numerical and visual way to display values
acquired for a variable. As an example of
biomechanical research, it is possible to qualitatively
assess the behavior of a person's postural control in a
dynamic state of movement or standing still, both
actions under different vision and surface conditions.
However, one barrier to biomechanical analysis is
the mathematical software used to process data.
Researchers must have prior knowledge or learn how
to manipulate these tools to analyze their data, which
makes this step reliant on the experience and
expertise presented by the researcher on other areas
from Exact Sciences and Information Technology
(Dunn et al., 2017). As a result, several
biomechanical analyses are quantitative, and only the
a
https://orcid.org/0000-0002-9493-145X
most experienced researchers use qualitative methods
to look at the data. Consequently, the use and benefits
of data visualization for biomechanical analyses
remain unknown to some researchers from
Healthcare areas.
For those with experience in analyzing data,
software such as MATLAB and Origin are employed
to create visual representations for biomechanical
variables. In the case of research based on data
collections from force plate equipment, the behavior
of a person's Center of Pressure (COP) is evaluated
by visualizing one of its displacement directions by
the other, which represents right-left and front-back
oscillations (Duarte and Freitas, 2010). Since
including programming languages, such as Python
and R, in analyses, the options and possibilities for
data visualization have become increasingly
extensive.
This paper aims to implement graphic
visualizations using data visualization libraries from
Python (Seaborn, Plotly Express and Plotly Graph
Objects) to improve the analysis of human static
postural control acquired by a force plate to help
628
Uê, T., Eler, D. and Messias, I.
A Visual Analysis Approach to Static Postural Control Acquired by a Force Plate.
DOI: 10.5220/0012599700003690
Paper published under CC license (CC BY-NC-ND 4.0)
In Proceedings of the 26th International Conference on Enterprise Information Systems (ICEIS 2024) - Volume 1, pages 628-635
ISBN: 978-989-758-692-7; ISSN: 2184-4992
Proceedings Copyright © 2024 by SCITEPRESS – Science and Technology Publications, Lda.

evaluate, interpret, and disseminate postural analysis
results to researchers with different levels of
experience. The force plate used in this paper
measures the components of ground reaction forces
and their respective torque moments applied to its
surface. From its results, the Center of Pressure in its
medial‑lateral (ML) and anterior‑posterior (AP)
directions were calculated to assess its displacement
during data collection and evaluate the behavior of
human postural balance. In the experiments, the
analyzed data belong to static positions performed by
older adults with sarcopenia before and after being
subjected to a muscular intervention (Bertolini et al.,
2021). Both data processing and visualization were
implemented using Python programming language.
In the visual analysis, scatter plots, heat maps,
violin plots, and box plots corresponded to the
graphical representations used to evaluate older
adults’ postural balance through the behavior of their
COP. Thus, each oscillation in their balance can be
visually identified by displaying all COP’s values and
the relationships between them. This way of looking
at the data differs from the statistical information,
which summarizes a sample’s data in quantified
values. Applying a visual approach to look at the
results acquired from a force plate is essential to
contribute to biomechanical analyses by
complementing the statistical approach and providing
an overall view of the data.
The second section of this paper presents related
works to provide perceptions on possible applications
with a force plate and how its data has been analyzed
quantitatively and qualitatively. The third section
describes the methodology employed for visual
analysis of the data acquired from the force plate. The
fourth section provides a case study for applying the
developed visual approach to analyze one of the static
positions performed by an older adult with
sarcopenia. In the fifth and last section, conclusions
and further works are presented.
2 RELATED WORKS
Borges et al. (2016) compared static postural balance
among older adults with and without mild cognitive
impairment using a three-dimensional
electromagnetic sensor system. The calculated
variables of interest corresponded to velocity and
displacement of the Center of Pressure. Tables, line
graphs, and scatter plots were implemented using the
Origin software to analyze the data. Scatter plots
represented each direction of the COP’s displacement
by the other, and line graphs were used to combine
these directions at the time of data collection.
Pinto et al. (2019) used four force plates and eight
motion capture cameras to compare postural control
among two yoga practitioners and two
non‑practitioners. The variables for their evaluation
involved displacements of the Centers of Mass and
Pressure, components of ground reaction force, and
amplitudes of joint angles, such as the hip, lower
back, and knee. Tables, line graphs, and scatter plots
were implemented by using MATLAB software for
the analysis step. Scatter plots represented the
directions of the Center of Pressure’s displacement by
each other.
Seo et al. (2022) assessed the balance of older
adults in different vision and surface conditions: eyes
open and closed with firm and foam surfaces. A
Nintendo Wii Balance Board force plate was chosen to
capture the amplitude, velocity, area, and covariance of
the Center of Pressure’s displacements. The MATLAB
software implemented tables and scatter plots,
illustrating the medial-lateral direction of the COP’s
displacement by the anterior-posterior one.
Zychowska et al. (2022) used an AMTI force
plate to evaluate the consequences of COVID-19
infection on postural control. Within the analyzed
group of infected people, those with respiratory
abnormalities and others with olfactory abnormalities
were also observed as a consequence of COVID-19.
MATLAB software assessed the trajectory of the
Center of Pressure displacements. The analyses were
quantitatively, through tables, and qualitatively, with
scatter plots. The visualizations combined one
direction of the Center of Pressure’s displacement
with the other.
Herrera et al. (2023) developed a framework to
aid the application of Virtual Reality in the context of
upper limb rehabilitation. The software can record
and store kinematic data during the manipulation of
objects in virtual environments. Data acquired from
the developed application can be used to evaluate
each patient’s rehabilitation progress. In a case study
to test the software’s functionalities, 10 healthy
individuals aged between 15 and 39 were conducted
in three trials for the conditions of a real environment
and an immersive virtual one to measure the number
of blocks they were able to pass from one side of a
box to the other within a minute. To compare the
results, the mean value of the three attempts was
calculated and a line graph displayed a link
connecting values obtained for each environment. A
three-dimensional heat map was also used as an
example of visual analysis for the recorded kinematic
data.
A Visual Analysis Approach to Static Postural Control Acquired by a Force Plate
629
3 VISUAL ANALYSIS APPROACH
AND RESULTS
To implement a visual approach to analyze
biomechanical data acquired from a force plate, the
data used by this paper came from research on the
evaluation of static postural control during the
moments before and after a muscle training
intervention applied to older adults with sarcopenia, in
other words, a loss of muscle mass responsible for
affecting their postural balance (Bertolini et al., 2021).
During the data collection, 22 older people (12
women and 10 men aged between 59 and 93) were
given three attempts at the static positions of feet
together, feet apart, and semi-tandem, under the
condition of eyes open and closed. The first two
positions were performed for 30 seconds, and the
third was performed for 10 seconds. The last
performed position was unipodal support with the
dominant and non
‑
dominant foot for 10 seconds. Data
was collected at 100 Hz (Bertolini et al., 2021).
The OR6-6 model for the force plate made by
Advanced Mechanical Technology, Inc. (AMTI) was
used to collect data from older people (Bertolini et al.,
2021). With this biomechanical equipment, the
components of the ground reaction force and their
respective torque moments are measured according to
the person's contact with the surface of the force plate.
Both forces and moments act in an orthogonal
coordinate system, in which the x and y-axis are the
horizontal components, and the z-axis is the vertical
one. From the obtained values, it is possible to
calculate, throughout the data collection's duration,
the displacement of the Center of Pressure in its
medial-lateral and anterior-posterior directions (in
centimeters), which respectively correspond to
oscillations along the x and y directions. The COP
consists of a positioning variable responsible for
indicating right-left (medial-lateral) and front-back
(anterior-posterior) displacements (Duarte and
Freitas, 2010).
For this paper, the Python programming language
was used to calculate the oscillations of the Center of
Pressure acquired by a force plate and then to
implement the graphic visualizations. The x-axis of the
graphs represents the COP's ML displacement, and its
values are increasing towards the left since older adults
were positioned on the force plate so that the x-axis has
a positive direction to their left side. The y-axis has a
positive sense towards the front of them. Therefore, the
y-axis of the graphs represents the AP displacement,
with its values increasing upwards.
The values in each calculated variable of the
Center of Pressure were translated to make the first
one collected corresponding to zero. To accomplish
this, the initial value was subtracted by itself, and all
the other values were subtracted from the initial one.
As a result, reflected in the visualizations, the person's
static postural balance is analyzed with the first
acquired value as a reference while displaying it as
the graph's central point (0,0).
3.1 Scatter Plots
Scatter plots combine the medial-lateral and
anterior‑posterior displacement variables to display
the concentration and dispersion of the Center of
Pressure’s behavior values. It is possible to notice
where the highest and lowest concentrations of data
are. In addition, the graph’s values can be colored
according to the time they occurred during the data
collection, which allows us to know which data is
from the beginning and the end of the phenomenon.
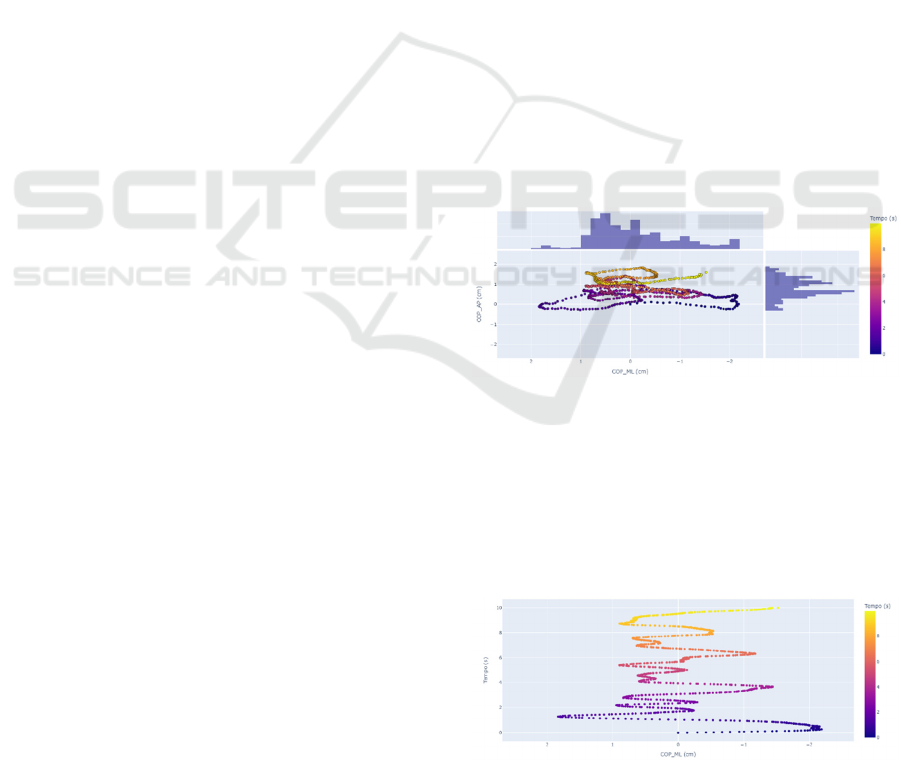
Figure 1 illustrates a scatter plot for the
semi‑tandem position with eyes closed during the first
pre-intervention execution attempt. The light colors
indicate the data collected at the beginning of the
acquisition, while the dark colors indicate the final
moments of it. Histograms can be added on the side
of the visualizations to help locate the regions with
concentration values.
Figure 1: Scatter plot colored by time (Tempo) and
combining the COP’s displacement in medial-lateral
(COP_ML) direction by its anterior-posterior (COP_AP)
direction.
Scatter plots can also be used to individually
display the COP’s displacement directions by the
time for data collection. Similarly, it is possible to
color the values according to the time they were
Figure 2: Scatter plot colored by time (Tempo) and
combining the COP’s displacement in medial-lateral
(COP_ML) direction by the time for data collection.
ICEIS 2024 - 26th International Conference on Enterprise Information Systems
630
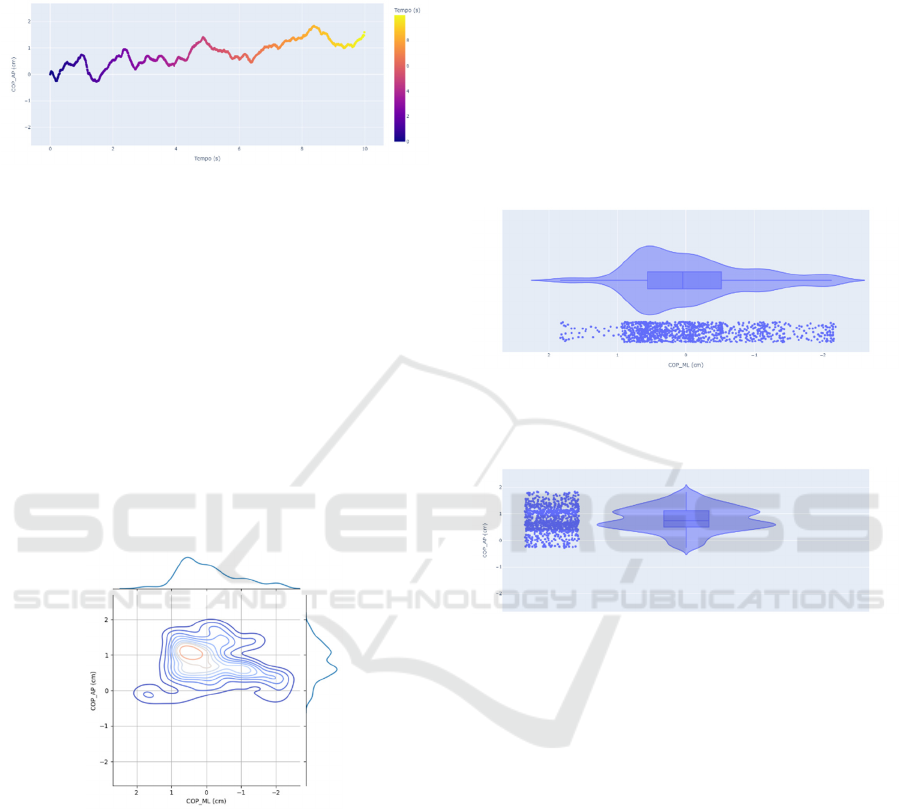
collected. Figure 2 shows the visualization for the ML
direction by time, and Figure 3 displays this
combination for the AP direction. The represented
static position is the same as in Figure 1.
Figure 3: Scatter plot colored by time (Tempo) and
combining the COP’s displacement in anterior-posterior
(COP_AP) direction by the time for data collection.
3.2 Heat Maps
Heat maps also combine the Center of Pressure’s
directions of displacement. However, this data
visualization style displays the regions with a
concentration of values in a topographical way.
Figure 4 illustrates a heat map for the same static
position as Figure 1. Warm colors indicate the highest
concentrations of data, and cool colors show where
there are fewer values present. Line graphs on the
sides of the visualization can also be added to help
indicate the regions with the highest density of values.
Figure 4: Heat map combining the COP’s displacement in
medial-lateral (COP_ML) direction by its anterior-posterior
(COP_AP) direction.
3.3 Violin Plots and Box Plots
Box plots display the distribution behavior of the
variables’ values. With this visualization style, the
displacements of the COP in the ML and AP
directions can be analyzed individually. In addition,
they provide visual information on the maximum,
minimum, median, and quartiles of a sample’s data.
Thus, it is possible to be aware of the amplitude and
symmetry present in the data. A box plot can be
included within a violin plot, whose purpose is to
display the density of the data as well, but in a
mirrored way. In this visualization, the stretch of the
violin’s extremities along the graph’s axis indicates
how far apart the values are, and its peaks indicate
how concentrated they are.
For the same static position in Figure 1, Figure 5
provides a violin plot with a box plot to observe the
values acquired in the ML direction. Based on the
same visual style, Figure 6 shows the performance of
the Center of Pressure’s AP direction. Both figures
have each of the data displayed next to the graph as
support for the visualization.
Figure 5: Violin plot with a box plot within it for the
behavior of the COP’s displacement in the medial-lateral
(COP_ML) direction.
Figure 6: Violin plot with a box plot within it for the
behavior of the COP’s displacement in the
anterior‑posterior (COP_AP) direction.
4 DISCUSSIONS
As a demonstration for applying the visual approach
developed in this paper, the results for the static
semi
‑
tandem position with eyes closed during pre-
and post-intervention are evaluated and compared
based on the graphic visualizations implemented with
Python language.
From the scatter plots and heat maps combining
one direction of the Center of Pressure’s displacement
by the other, it is possible to notice large dispersions
in the values from the first and third attempts of
pre‑intervention and the first one of post-intervention.
These results indicate the older adult had more
difficulty in finding their balance point control
throughout the data collection, which caused their
COP to oscillate at practically every moment. On the
A Visual Analysis Approach to Static Postural Control Acquired by a Force Plate
631
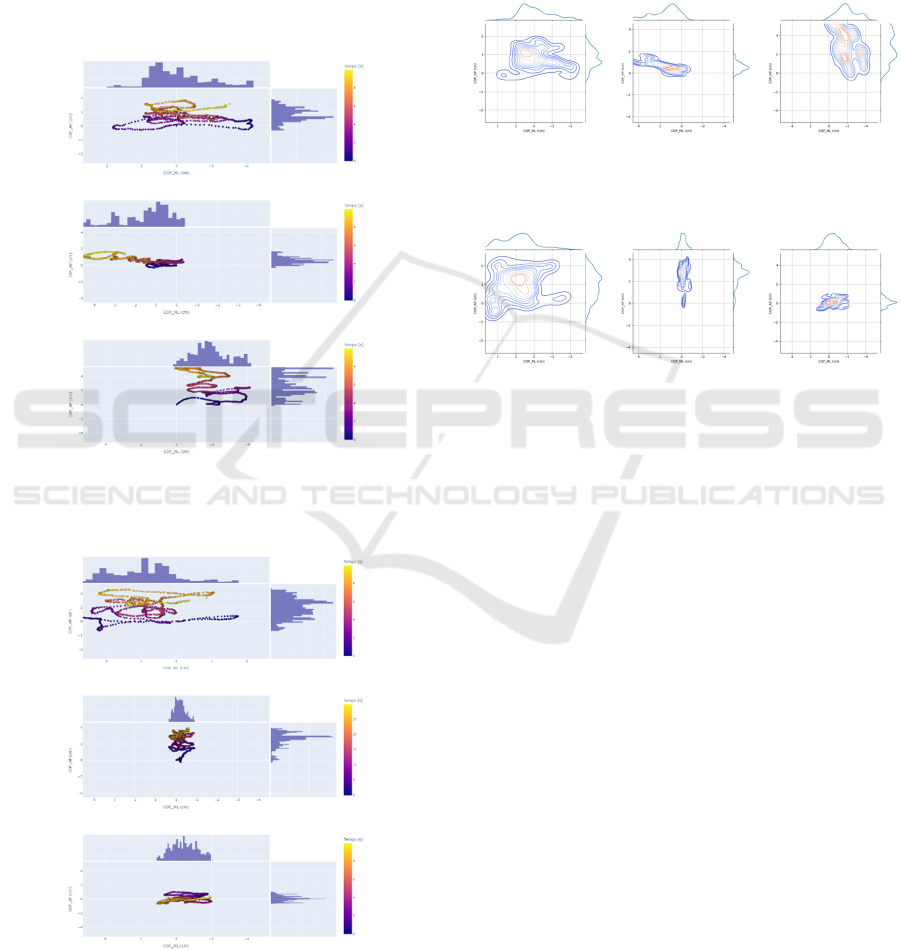
second attempt for each moment of intervention,
dispersions also occurred, but on a smaller scale. On
the second one, for pre-intervention, older adults
started the data collection with more minor variations
in their balance. On the second attempt in
post‑intervention, they finished it with the values of
the COP’s displacements, concentrating on a single
region.
Additionally, an improvement can be noticed in
the post-intervention results, culminating in its third
attempt to present values much closer to and around
Figure 7: Scatter plots for the pre-intervention moment with
the first, second and third (from top to bottom respectively)
attempts at the semi-tandem position with eyes closed.
Figure 8: Scatter plots for the post-intervention moment
with the first, second and third (from top to bottom
respectively) attempts at the semi-tandem position with
eyes closed.
the graph's central point (0,0). Such behavior from the
results indicates an improvement in the older person's
ability to maintain their balance throughout the data
collection by displacing their Center of Pressure
much less than in previous collections. Figures 7 and
8 illustrate the pre-and post-intervention results with
scatter plots. Likewise, Figures 9 and 10 display the
data with heat maps.
Figure 9: Heat maps for the pre-intervention moment with
the first, second and third (from top to bottom respectively)
attempts at the semi-tandem position with eyes closed.
Figure 10: Heat maps for the post-intervention moment
with the first, second and third (from top to bottom
respectively) attempts at the semi-tandem position with
eyes closed.
From the scatter plots combining the
medial‑lateral direction of the COP’s displacement by
the duration of data collection, a more prominent
oscillation in the values was noticed during most
pre‑intervention attempts. In contrast, most
post‑intervention data was closer to zero, with the
second attempt showing the tiniest variations.
Applying the same visualization style for the
anterior‑posterior direction over time makes it
possible to notice a similarity in most of the values’
behavior for both moments of intervention. The
second attempt in pre-intervention and the third one
in post-intervention show the closest data to zero.
Figure 11 displays the results for the ML direction in
pre- and post-intervention. Similarly, Figure 12
illustrates the results for the AP direction.
Instead of displaying the temporal information
alongside the Center of Pressure’s displacement
values, violin graphs with box plots within them
enable the density of a single sample’s data to be
observed in a more detailed way. For the ML
direction visualization, it is possible to notice most of
the pre‑intervention attempts, and the first one in
post‑intervention displays the most prominent
ICEIS 2024 - 26th International Conference on Enterprise Information Systems
632
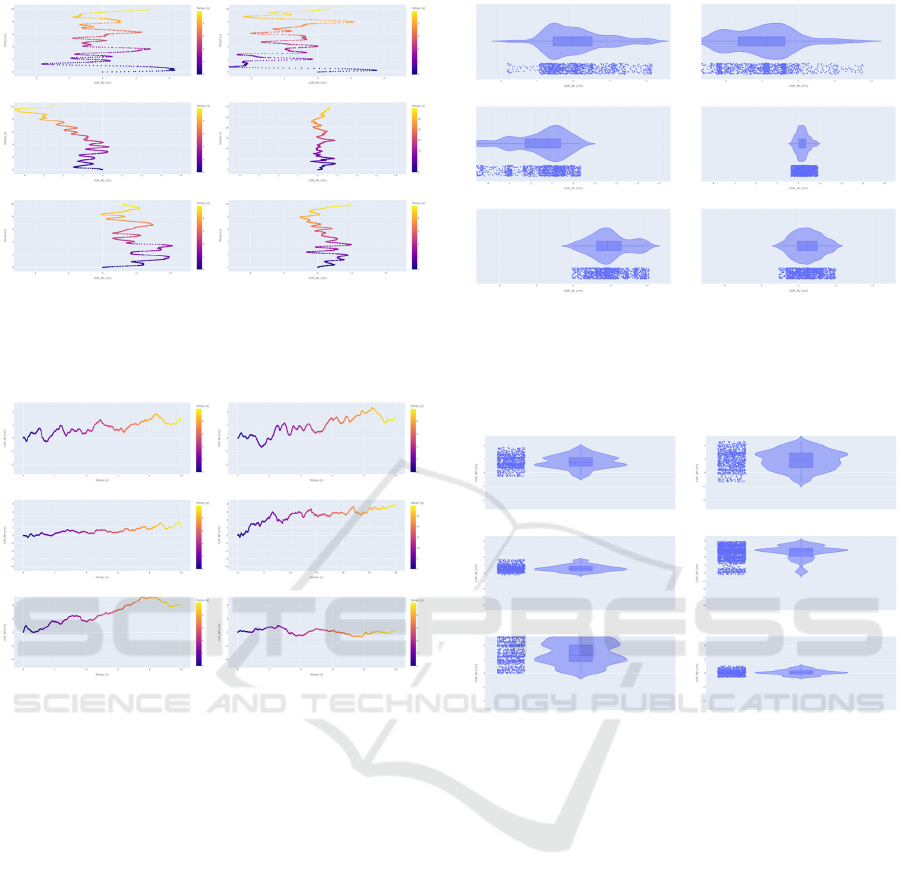
Figure 11: Scatter plots for the medial-lateral direction
during pre- (left) and post-intervention (right) with the first,
second and third (from top to bottom respectively) attempts
at the semi‑tandem position with eyes closed.
Figure 12: Scatter plots for the anterior-posterior direction
during pre- (left) and post-intervention (right) with the first,
second and third (from top to bottom respectively) attempts
at the semi‑tandem position with eyes closed.
oscillations in the older adult’s postural balance. On
these attempts, the violin stretches throughout the
graph, indicating a dispersion in the values. However,
post-intervention results indicate an improvement in
minimizing the COP’s displacement in its ML
direction and maintaining a more concentrated
posture control at each sample taken. Values in these
attempts are closer to zero, especially in the second
one, and the graph’s violin is not stretched as much.
Finally, for AP direction, attempts to present the
smallest dispersions correspond to the second data
collection in pre-intervention and the last two in
post‑intervention. These results indicate a more
considerable concentration of data approaching the
zero value. In the post-intervention moment, it is
possible to observe the values becoming increasingly
concentrated with each attempt taken. Figure 13
illustrates the ML direction obtained in pre- and
post
‑
intervention. Likewise, Figure 14 displays the
results for AP direction.
Figure 13: Violin plot with a box plot within it for the
medial-lateral direction in pre- (left) and post-intervention
(right) with first, second and third (from top to bottom
respectively) attempts at semi‑tandem position with eyes
closed.
Figure 14: Violin plot with a box plot within it for the
anterior‑posterior direction in pre- (left) and
post‑intervention (right) with first, second and third (from
top to bottom respectively) attempts at semi‑tandem
position with eyes closed.
5 CONCLUSIONS AND FURTHER
WORKS
The mechanics of human movement are measured
and evaluated through a variety of biomechanical
equipment. However, its data analyses consist
primarily of quantitative steps, and not all researchers
are aware of the qualitative methods for looking at
their data. To develop a visual approach to analyze
data acquired from a force plate, this paper aims to
apply data visualization to the evaluation of static
postural control in older adults with sarcopenia
submitted to a muscular intervention to demonstrate
visualizations' contributions to biomechanical
research.
A Visual Analysis Approach to Static Postural Control Acquired by a Force Plate
633

The Center of Pressure was calculated in its
medial-lateral and anterior-posterior directions to
observe the postural balance’s behavior. Data
processing and visualization were implemented using
Python programming language. Scatter plots, heat
maps, violin plots, and box plot visualizations were
modeled to provide qualitative information about the
values acquired for each of the COP’s displacement
directions, individually combined by the data
collections’ duration and the combinations of one of
the oscillation directions by the other.
When the graphic visualizations were applied to
compare the static semi-tandem position with eyes
closed performed for an older adult during the data
collections at pre- and post-intervention, it was
possible to identify the behavior of their postural
balance throughout every attempt of positioning. The
concentrations, dispersions, and variations in the
COP’s oscillation values were displayed in the graphs
to be interpreted. After visually comparing the results,
it was possible to determine an improvement after the
muscular intervention in the older adult’s postural
control for the analyzed static position.
Applying a visual approach to biomechanical
analyses with data acquired from a force plate enables
each value present in a sample to be visualized
graphically. This way, it is possible to know all the
collected data's behavior and how they relate. This
overall view of the results differs from statistical
information by not presenting a numerical value to
characterize the phenomenon analyzed. For static
postural control analyses, there is a visual perception
of how the person's Center of Pressure behaves
throughout the data collection, not a summarization
of such action into a numerical quantification. The
addition of temporal information in the visualizations
is also relevant to the exact awareness of postural
balance's performance at the beginning, middle, and
end of a static positioning execution.
In addition, the variety of graphic visualization
styles opens up a wide range of possibilities for
representing a sample's data. Each visual style has
characteristics that can enhance the others, and more
than one visualization can complement one another in
the same graph.
Therefore, graphic visualizations are essential to
support and contribute to force plate users during the
analyses of their results and provide different ways of
looking at their data. Visual information is also
necessary to increase and complement the
quantitative side of biomechanical research.
For this paper, no dynamic postural control data
was used, and no other variables related to the Center
of Pressure were calculated. With a force plate, it is
possible to capture performances regarding dynamic
actions (e.g., gait, jump), and to calculate additional
COP-related variables (e.g., velocity, frequency,
area).
As further works, developing a non-paid,
intuitive, and user-friendly computational interface
for enabling researchers with different experiences in
data analysis to create graphic visualizations and use
them to contribute to their biomechanical evaluation
of postural control acquired from a force plate is
proposed, disseminating the use of visualization in
analyses from force plate data. Furthermore, the tool
can provide the calculation and visualization for other
COP-related variables and add statistical information
provided in tables to complement the qualitative data.
Additional functionalities can correspond to enable
users to change the variable chosen to color values in
scatter plots. Parameters that differ according to the
research with the force plate (e.g., frequency of data
acquisition) can also be altered by users. The type of
force plate from which the data will be collected must
be previously decided, as force plates can generate
different data and file formats, saving them. Finally,
the recommendations and suggestions provided by
the participations of force plate users are essential to
validate the tool’s usability and functionalities, as
well as the visualizations used for postural control
analyses.
ACKNOWLEDGEMENTS
This study was financed in part by the Coordenação
de Aperfeiçoamento de Pessoal de Nível Superior -
Brasil (CAPES).
REFERENCES
Bertolini, G. N., Silva, B. S. A., Santos, V. R., Messias, I.
A., Ribeiro, J. P. J., Marini, E., Gobbo, L. A. (2021).
Are bioelectrical parameters and functionality
associated with postural control in the elderly? Clinical
Biomechanics. Bristol, v. 82.
Borges, A. P. O., Carneiro, J. A. O., Zaia, J. E., Carneiro,
A. A. O., Takayanagui, O. M. (2016). Evaluation of
postural balance in mild cognitive impairment through
a three-dimensional electromagnetic system. Brazilian
Journal of Otorhinolaryngol. v. 82, n. 4.
Duarte, M., Freitas, S. M. S. F. (2010). Revisão sobre
posturografia baseada em plataforma de força para
avaliação do equilíbrio. Rev. Bras. Fisioter. São Carlos,
v. 14, n. 3.
Dul, J., Weerdmeester, B. (2012). Ergonomia prática,
Blucher. São Paulo, 3
rd
edition.
ICEIS 2024 - 26th International Conference on Enterprise Information Systems
634

Dunn, W., Burgun, A., Krebs, M., Rance, B. (2017).
Exploring and visualizing multidimensional data in
translational research platforms. Brief Bioinform. v. 18,
n. 6.
Falzon, P. (2018). Ergonomia, Blucher. São Paulo, 2
nd
edition.
Falzon, P. (2007). Ergonomia Construtiva, Blucher. São
Paulo, 1
st
edition.
Hall, S. J. (2016). Biomecânica Básica, Guanabara Koogan.
Rio de Janeiro, 7
th
edition.
Hamill, J., Knutzen, K. M., Derrick, T. R. (2016). Bases
biomecânicas do movimento humano, Manole. Barueri,
São Paulo, 4
th
edition.
Hatze, H. (1974). The meaning of the term “biomechanics”.
Journal of Biomechanics. v. 7, n. 2.
Pheasant, S. (2003). Bodyspace: Anthropometry,
Ergonomics and the Design of Work, CRC Press.
London, 2
nd
edition.
Pinto, D. P., Sarmet, P., Pino, A. V., Menegaldo, L. L.
(2019). Biomechanics of Postural Control in Yoga: A
Pilot Study. In: XXVI Brazilian Congress on
Biomedical Engineering. Armação dos Búzios, Rio de
Janeiro, Brazil.
Seo, J. -W., Kim, J. I., Kim, T., Jang, K. -M.; Jeong, Y., Do,
J. -H. (2022). Sensory Interaction and Balancing
Ability Evaluation of the Elderly Using a Simplified
Force Plate System. Sensors. Basel, v. 22.
Ward, M., Grinstein, G. G., Keim, D. (2010). Interactive
Data Visualization: Foundations, Techniques, and
Applications, A K Peters, Ltd. Natick, Massachusetts.
Zychowska, M., Jaworecka, K., Mazur, E., Slomka, K.,
Marszalek, W., Rzepko, M., Czarny, W., Reich, A.
(2022). COVID-19 and Postural Control - A
Stabilographic Study Using Rambling-Trembling
Decomposition Method. Medicina. v. 58, n. 2.
A Visual Analysis Approach to Static Postural Control Acquired by a Force Plate
635
