
Towards a Link Mapping and Evaluation Approach for Core
Operational Business-IT Alignment
Ali Benjilany, Pascal Andr
´
e
a
, Dalila Tamzalit
b
and Hugo Bruneliere
c
Nantes Universit
´
e,
´
Ecole Centrale Nantes, IMT Atlantique, CNRS, LS2N, UMR 6004, F-44000 Nantes, France
Keywords:
Information Systems, Enterprise Architecture, Core Operational Business-IT Alignment, Business Process
Modelling, Software Application Modelling.
Abstract:
Business-IT Alignment (BITA) is an important mean of evaluating the performance of IT systems operating
within a business organisation. The software architects’ need for representing, analysing and interpreting the
alignment situations remains among the main challenges. Despite different initiatives in the last two decades,
available solutions remain too diverse and limited. As a consequence, more methodological guidelines are
still needed to improve the support for BITA. In this paper, we address Core Operational BITA (COBITA) as a
subset of BITA which targets the operational integration of business and application artefacts. To this end, we
first propose two types of COBITA links between the business layer and the application one. We propose then
an approach for establishing these links and evaluating them. The objective is to provide indicators for domain
experts and software architects to assess the quality of the alignement between the two layers. We decided to
choose Archimate, a standard language, to model the business and application layers. Then, we specify the
two types of COBITA links to establish a mapping between the business and applications layers. Finally, we
rely on the obtained cartography to evaluate the alignment via a set of proposed metrics and consistency rules.
An initial version of the approach has been implemented in the Archi tool, and we experimented with it on the
SoftSlate system.
1 INTRODUCTION
A main concern of Information System (IS) archi-
tects is to design efficient IT solutions that match with
the business activities of their organisations. In this
context, Business-IT Alignment (BITA) is a mean to
measure and evaluate the consistency between these
two points of view. In the literature, the term align-
ment refers to both the process of establishing links
and the result of this process.When the alignment is
not correct, it generally refers to quality issues related
to integration (e.g., Business-IT gap, aligment prob-
lem (Kassahun and Tekinerdogan, 2020), misalign-
ment (Gouigoux and Tamzalit, 2021)).
Strategic Alignment Model (SAM) (Henderson
and Venkatraman, 1999) is a reference model for
BITA. It separates the strategic and operational lev-
els for both the business and IT points of view, but
remains too informal to be applied in practice. Enter-
prise Architecture (EA) (Lankhorst, 2013) provides a
a
https://orcid.org/0000-0002-1112-2973
b
https://orcid.org/0000-0002-0985-0226
c
https://orcid.org/0000-0002-5987-2175
more convenient framework. It covers many stake-
holder’s points of view, from business strategy to IT
infrastructure. In EA, alignment is about connecting
layers via concepts of their underlying models. A
later work (Habba et al., 2019) narrowed the scope to
Operational BITA, i.e., the alignment of business re-
quirements with business processes and software sys-
tems. This definition is interesting to compare exist-
ing approaches. However, mixing requirements with
processes in business models can be confusing and no
supporting framework has been provided up to know.
Very recently, the scope has been narrowed down to
Core Operational Business-IT Alignment (COBITA)
as the operational integration of the business and ap-
plication layers (Andr
´
e et al., 2023). This is the actual
core area where the business view meets the IT view.
COBITA is a preoccupation for IS architects (e.g.,
Enterprise Architects, Solution Architects, Technical
Architects). In practice, they use modelling and doc-
umentation to analyse the alignment and recommend
evolution scenarii. However, the existing BITA sur-
veys (Zhang et al., 2018; Habba et al., 2019; Gell-
weiler, 2021; Andr
´
e et al., 2023) mention the lack of
Benjilany, A., André, P., Tamzalit, D. and Bruneliere, H.
Towards a Link Mapping and Evaluation Approach for Core Operational Business-IT Alignment.
DOI: 10.5220/0012600600003690
Paper published under CC license (CC BY-NC-ND 4.0)
In Proceedings of the 26th International Conference on Enterprise Information Systems (ICEIS 2024) - Volume 2, pages 557-568
ISBN: 978-989-758-692-7; ISSN: 2184-4992
Proceedings Copyright © 2024 by SCITEPRESS – Science and Technology Publications, Lda.
557
methodological and tooling support to assist the archi-
tects in feeding the models, discovering the alignment
links, evaluating the obtained cartography, proposing
evolution scenarii and, ideally, realizing the align-
ment. Moreover, the whole process should be applied
iteratively. Thus, in the COBITA context, several re-
search questions have to be explored (Andr
´
e et al.,
2023). They concern (i) the impact of how the busi-
ness and application layers are modelled; (ii) the vari-
ety of the stakeholder’s concerns, called dimensions;
(iii) the tool support to perform the COBITA contin-
uous process and (iv) case studies or benchmarks to
compare existing approaches.
The work in this paper is a first step towards
addressing these research questions. In particular,
we cover the following COBITA steps: (1) Identify
the concepts to be considered from the two layers;
(2) Specify different types of links between these con-
cepts, considering various dimensions; (3) Establish
concrete links between elements from the two layers
to obtain a cartography; (4) Evaluate this cartogra-
phy by applying various metrics and/or consistency
rules; (5) Contribute to the tool support by partially
automating this evaluation process; (6) Propose an
open case study for experimenting with our approach.
The remainder of this paper is organised as fol-
lows. Section 2 introduces the background on which
we build our approach. Section 3 describes the con-
cepts of the business and application layers we con-
sider. Section 4 proposes two new types of COBITA
links, illustrated on simple examples. Section 5 pro-
vides a first set of metrics and consistency rules to
evaluate the alignment. Section 6 presents the current
tool support coming with our approach. Section 7 il-
lustrates the practical application of our approach on
a case study. Section 8 discusses the related work,
before Section 9 concludes and opens on future work.
2 BACKGROUND
As introduced in Section 1, BITA is about evaluat-
ing how IT systems fit with enterprise business activ-
ities. COBITA reduces the scope to aligning the busi-
ness layer (mostly the business processes organising
the enterprise activities) and the application layer (an
architectural view of the IT systems).
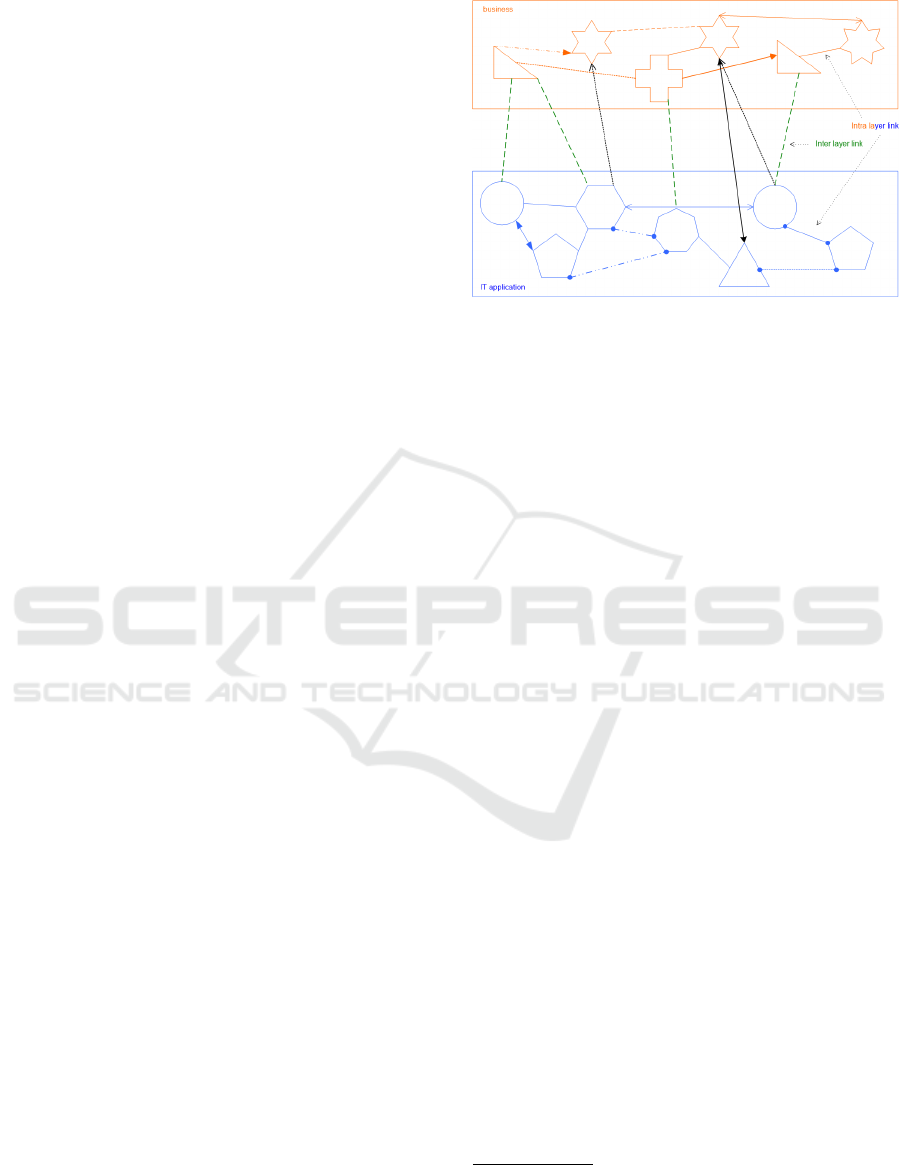
As shown in Figure 1, we consider two layers,
namely business and application, represented by two
distinct models. The geometric figures represent
model elements which are instances of different con-
cepts at the business process-level (activities, events,
actors, business objects, etc.) and application-level
(components, libraries, services, tasks, data object,
Figure 1: COBITA links schematisation.
etc.). These elements are connected by links
1
inside
a given layer (intra-layer links) or between layers
(inter-layer links). Intra-layer links are, for instance,
data flow, control flow in the business layer or associ-
ation, inheritance in the application layer. Inter-layer
links represents correspondence, traceability, refine-
ment or dependency between concepts of the two lay-
ers. In our work, a set of inter-layer links is called a
mapping.
A dimension is a point of view on the alignment.
In Figure 1, two dimensions are represented, denoted
by the dashed lines and the filled arrows. Such di-
mensions target the possible concerns of the differ-
ent stakeholders, e.g. functions, data, security or
privacy. For example, in IS modelling, we usually
make a distinction between the structure, the func-
tional behavior and the dynamic behaviour (cf. the
Function-Behaviour-Structure Ontology (Gero and
Kannengiesser, 2014)).
In the remainder of the paper, we focus on two
dimensions (functions and data); these two are
the most commonly studied dimensions in COBITA
works (Andr
´
e et al., 2023). It is important to note
that the inter-layer links belong to the model of the
business and application layers (cf. Section 3) while
the inter-layer links are defined by the enterprise ar-
chitect when establishing the cartography (Section 4).
Both types of links can be considered when evaluat-
ing the COBITA especially when detecting patterns
or applying consistency rules (cf. Section 5). Ac-
cording to our survey (Andr
´
e et al., 2023), perform-
ing COBITA evaluation includes (i) checking consis-
tency and completeness of the alignement, (ii) calcu-
lating metrics and rates to evaluate the alignement,
(iii) analysing change impact for maintenance and
1
In the ISO 42010 standard (ISO/IEC/IEEE, 2011), a
link, called a correspondence, defines a relation between
model elements called architecture description elements,
and can be governed by correspondence rules.
ICEIS 2024 - 26th International Conference on Enterprise Information Systems
558
evolution, (iv) computing coverage for different di-
mension. In this paper, we consider the two first
items. To this end, we propose first metrics related to
the implementation of business and application func-
tions (cf. Section 5.1). We also provide a couple
of consistency rules in order to evaluate the struc-
ture of the established COBITA cartography (cf. Sec-
tion 5.2).
3 MODELLING LAYERS
In order to be able to detect an alignment state, we
first need to have a representation of the concepts of
each layer, and thus the layers themselves. Having
a representation allows to handle them in terms of
modelling and evaluation. The main standards mod-
elling languages are UML and BPMN 2.0 but, in this
work, we chose to rely on Archimate because (i) it
includes the concept of layers and aspects to struc-
ture the models; (ii) it is generic enough to serve as
a pivot language for future interoperability with other
languages; (iii) it offers several links between con-
cepts. Archimate also comes with a reference tool
support (cf. Section 6). Finally Archimate is quite
compatible with BMPN or UML up to some abstrac-
tion and model transformation.
We selected Archimate concepts that are represen-
tative for COBITA, and we show them in Table 1.
We considered the two usual dimensions that can be
found in the literature (Habba et al., 2019; Andr
´
e
et al., 2023), namely functional and data. The for-
mer refers to functionalities that implement business
activies or IT processes, it belongs to the behavior in
Archimate. The latter refers to the data and infor-
mation existing in any IS, it belongs to the passive
structure in Archimate. The business layer models
are represented using yellow diagrams in Archimate,
while the application layer models are represented us-
ing blue diagrams.
Table 1: Selected Archimate concepts for COBITA.
In Table 1, we mention only the main concepts
that are involved in inter-layer links for the functional
and data dimensions. In the next section, we define
the inter-layer links and bind them to the dimensions.
4 DEFINING INTER-LAYER
LINKS
In Section 2, we introduced the notions of inter-layer
link, dimension and mapping. We define two types
of inter-layer links between the concepts of Table 1:
implementation links (related to the functional dimen-
sion) and representation links (related to the data di-
mension). These two links are generic and indepen-
dent from any modelling language (BPMN, UML,
Archimate). In the illustrating figures, it is imle-
mented by stereotypes of the Association, a depen-
dency relationship of Archimate. We did not use the
Serving and Realization relationships because they
are too specific to functions and processes.
Definition 1 (Implementation link). An implementa-
tion link expresses that a concept of the Business layer
in the functional dimension is implemented by a con-
cept of the Application layer in the functional dimen-
sion. It means that a A-funct concept is part of the im-
plementation of the behaviour of a B-funct concept.
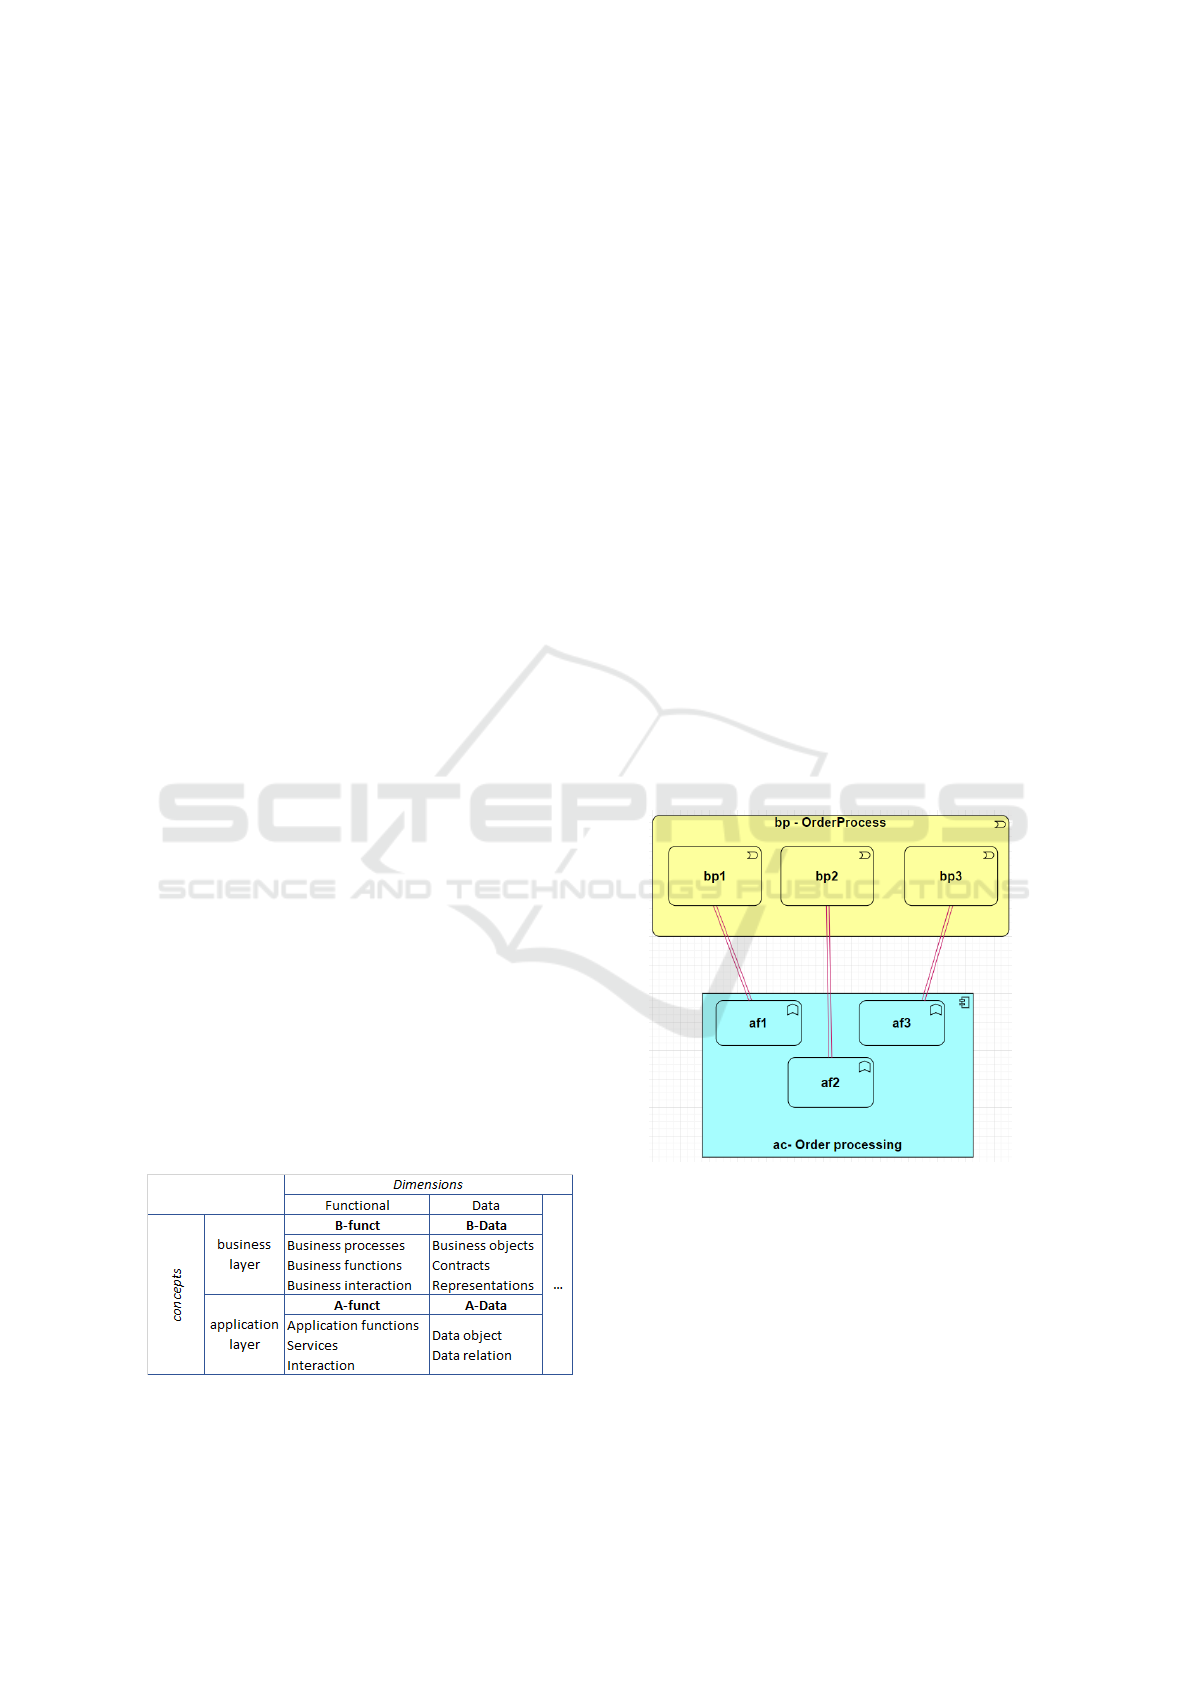
Figure 2: Illustration of implementation links.
Implementation links are illustrated in Figure 2:
a business process bp-orderProcess is composed of
three business processes: bp1, bp2, bp3. Each of
them is implemented by one application function (re-
spectively af1, af2, af3).
Definition 2 (Representation link). A representation
link expresses that a concept of the business layer in
the data dimension (e.g. a B-data business object) is
represented by a concept of the application layer in
the data dimension (e.g. a A-data Object).
Towards a Link Mapping and Evaluation Approach for Core Operational Business-IT Alignment
559
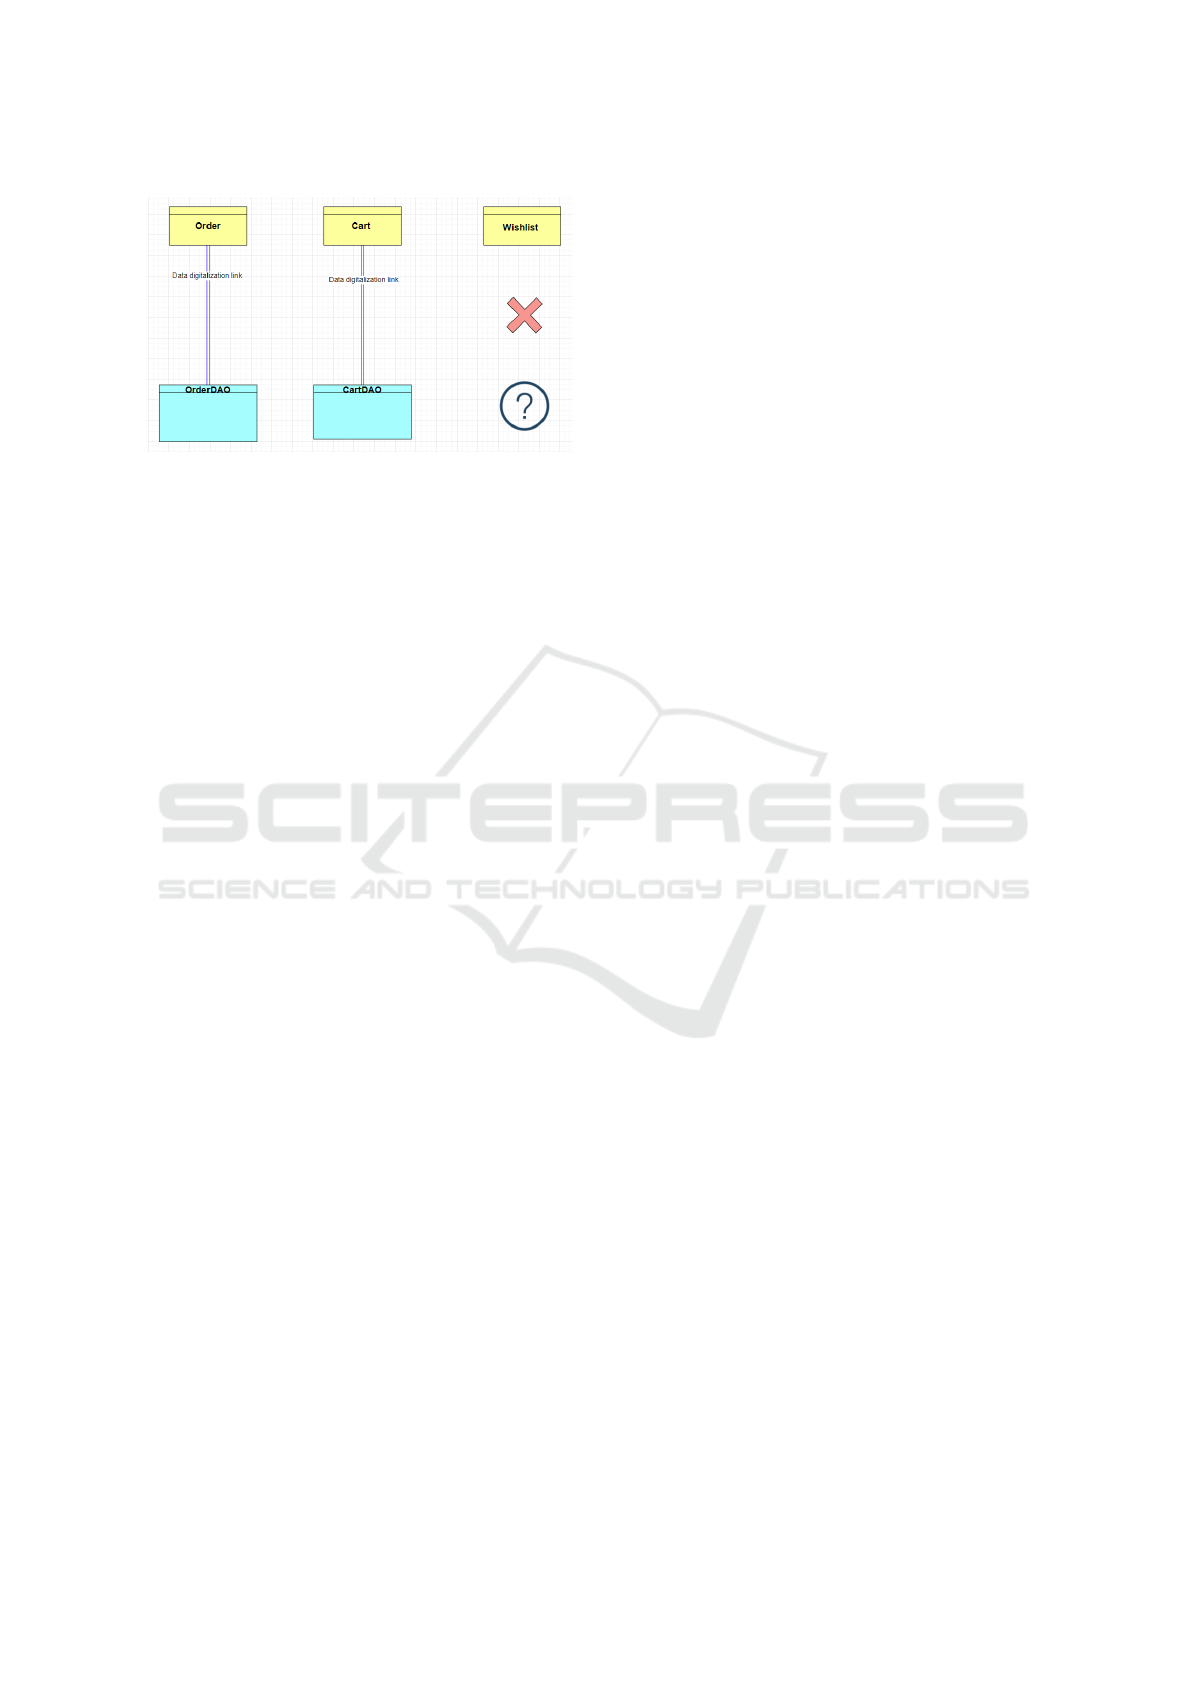
Figure 3: Illustration of representation links.
Representation links are illustrated in Figure 3,
where two Business objects, Order and Cart are rep-
resented by the Data Objects OrderDAO and Cart-
DAO respectively. However, Whislist is not repre-
sented by any A-data concept.
We define a cartography as a collection of map-
pings that connect the business and application layers.
Each mapping is associated to one dimension. Having
several dimensions enables a customised evaluation
of the alignment. We address the actual evaluation
process in the next section.
5 EVALUATING THE
ALIGNMENT
The evaluation of COBITA relies on the knowledge
of domain experts and architects. As mentioned at
the end of Section 2, we opted for a combination of
metrics and consistency rules. Indeed, they can be
automated which is a main request from enterprise ar-
chitects. In what follows, we define different metrics
to quantify alignment and a couple of logical rules to
evaluate the consistency on both the functional and
data dimensions. These are based on the implementa-
tion and representationn links defined in Section 4.
5.1 Evaluation Based on Metrics
The set of metrics we defined includes 1. the degree
of coverage of business concepts by application con-
cepts, 2. the level of implementation of business con-
cepts, and 3. the level of application concepts im-
plementing business concepts. These metrics are in-
spired from (Cavano and McCall, 1978) as a main ref-
erence for software quality measurements, and (Etien
and Rolland, 2005) as a main reference for relation-
ship fitness measurement in BITA. For each metric,
we provide both the computation logic and the result
interpretation.
Metric 1 : Number of implementation links of a
given Business functional concept. The objective
is to calculate the number of implementation links,
M1, in which a Business functional concept partici-
pates in. Three cases requires attention:
1. M1 = 0: The business functional concept is not
implemented. This value is a warning indicator
for domain experts and software architects who
have to decide whether this is not worrying or it is
actually a misalignement situation.
2. M1 = 1: The business functional concept is im-
plemented once which is the ideal alignment situ-
ation. However, one cannot ensure that it is cor-
rectly implemented.
3. M1 ≻ 1: The business functional concept is im-
plemented more than once. This is generally an
indicator of bad alignement that the domain ex-
perts and software architects should consider. It
is up to them to decide whether the situation is
problematic or not. Such situation is not a prob-
lem if this choice has been done on purpose. In
fact, in some cases, refining the implementation
of a business functional concept by multiple ap-
plication functions is required. However, we con-
sider that the higher the number of implementa-
tion links is, the bigger is the risk of misalignment,
as it represents a ”multiple functional implementa-
tion” anti-pattern (Gouigoux and Tamzalit, 2021).
Metric 1 reveals situations of misalignment related
to the implementation of one specific business func-
tional concept. The next metrics exploits this metric
to evaluate the implementation state by considering
all the business functional concepts.
Metric 2 : Rate of Unimplemented Business Func-
tional Concepts. Applying Metric 1 on all busi-
ness functional concepts allows to identify and cal-
culate the number of all unimplemented ones. Given
the total number of business functional concepts, we
can calculate Metric 2 by Rate of unimplemented B-
funct concepts = Number of unimplemented B-funct
concepts/Total number of B-funct concepts. The re-
sult of Metric 2 is an indicator for the software ar-
chitects. For instance, along with business domain ex-
perts and IT developers, they can set a threshold from
which the rate of unimplemented B-funct concepts
becomes a warning. Such threshold can be a contract
between business and IT representatives, while the ar-
chitect plays the role of mediator.
Metric 3: Most Implemented Business Functional
Concepts. Relying on Metric 1, it is possible to
sort out the B-funct concepts from the most to the
ICEIS 2024 - 26th International Conference on Enterprise Information Systems
560

less implemented. This would allow the architect
to have a clear overview on the most demanding
B-funct concepts in terms of implementation. There-
fore, such information would allow to target more eas-
ily the B-funct concepts to keep under control.
Metric 4. Number of Implementation Links of an
Application Functional Concept. While Metrics
1-2-3 focus on the links where B-funct concepts are
involved, Metric 4 focus on the links where applica-
tion functional concepts are involved. The objective
is to calculate M4, the number of B-funct concepts
implemented by one A-funct concept. Three cases
requires attention:
1. M4 = 0: If an application functional concept A-
funct does not have any related implementation
link, it means that this A-funct concept is not
implementing any B-funct concept, at least di-
rectly. In fact, sometimes, an A-funct concept
is called by another A-funct concept which is it-
self implementing a B-funct concept. However,
this situation can produce inconsistencies, leading
to the Pure technical integration BITA Antipat-
tern (Gouigoux and Tamzalit, 2021).
2. M4 = 1: The A-funct concept implements one
Bus-Func concept, which is the ideal alignment
situation. However, this cannot ensure the quality
of the implementation.
3. M4 ≻ 1: an A-funct concept implementing more
than one B-func concepts should be alerting. Such
a situation can occur in the context of legacy
monolith applications. It is a Monolith applica-
tion BITA anti-pattern (Gouigoux and Tamzalit,
2021).
Globally, the results of Metric 4 are useful to re-
veal situations of misalignment related to the number
of implementations provided by a A-funct concept
for B-funct concept(s). The next step is to exploit
this metric to evaluate the implementation state by
considering all the A-funct concepts.
Metric 5. Rate of Application Functions Con-
cepts not Implementing Business Function Con-
cepts. By grouping the Metric 4 M4 results ap-
plied on all application function concepts, A-func con-
cepts, we can calculate the number of all A-func con-
cepts that do not implement B-func concepts. In ad-
dition, given the total number of A-func concepts, we
can calculate the resulting Metric 5 by Rate of A-
func concepts that are not implementing B-func con-
cepts = number of A-func concepts that are not im-
plementing A-func concepts / total number of A-func
concepts. This metric gives a general overview of the
degree of A-func concepts involved in the alignement
mapping. For instance, let us suppose that more than
half A-func concepts are not implementing at least
one B-func concepts, this would be a questionable
situation to deal with. Several reasons can cause such
situation. It can be symptomatic of accumulated dead
code (e.g., due to poor architecture decisions). It can
be simply due to code that does not conform to the de-
signed architecture. It can also be caused by an evo-
lution in the organization related to legacy software.
Metric 6. Application Function Concepts Most
Implementing Business Function Concepts. Based
on the results of Metric 4, we can also identify the
A-func concepts most implementing B-func con-
cepts. This metric can be an indicator about the global
application functions concepts organisation and us-
age. For instance, having an A-func concept that
implements the third of existing B-func concepts
while some others are not (directly) implementing any
B-func concept might reveal a questionnable imbal-
ance load of A-func concepts.
We proposed two metrics to calculate the num-
ber of implementation and representation links, two
metrics to calculate rates of implemented versus non-
implemented B-func concepts and A-func concepts
implementing versus non-implementing B-func con-
cepts, and, finally, two metrics to calculate the most
implemented B-func concepts and the most A-func
implementing B-func concepts. These metrics repre-
sent a first evalution means of the cartography of links
between the business and application layers and fol-
lowing the two functional and data dimensions. We
present now a second means of evaluation.
5.2 Evaluation of Alignment
Consistency
While metrics evaluate quantitatively alignment, con-
sistency belongs the qualitative evaluation. We define
here some of the logical rules that enable to verify the
consistency involving different concepts of the two di-
mensions. Compared to evaluation based on metrics,
which is more quantitative, evaluation based on con-
sistency rules is more structural. Thus, we try to iden-
tify patterns of links composed of 1) inter-layer links
between concepts of a same dimension (but different
layers) and 2) intra-layer links between concepts of
a same layer (but different dimensions).
Consider the following sets BfC=B-func concepts,
BdC=B-data concepts, AfC=A-function concepts and
AdC=A-data concepts. Let (b f c, b f d) ∈ B fC × BdC
and (a f c, adc) ∈ A fC ×AdC. Let us consider the fol-
lowing propositions:
• A : b f c accesses bdc
Towards a Link Mapping and Evaluation Approach for Core Operational Business-IT Alignment
561
• B : a f c accesses adc
• C : b f c is implemented by a f c
• D : bdc represented by adc
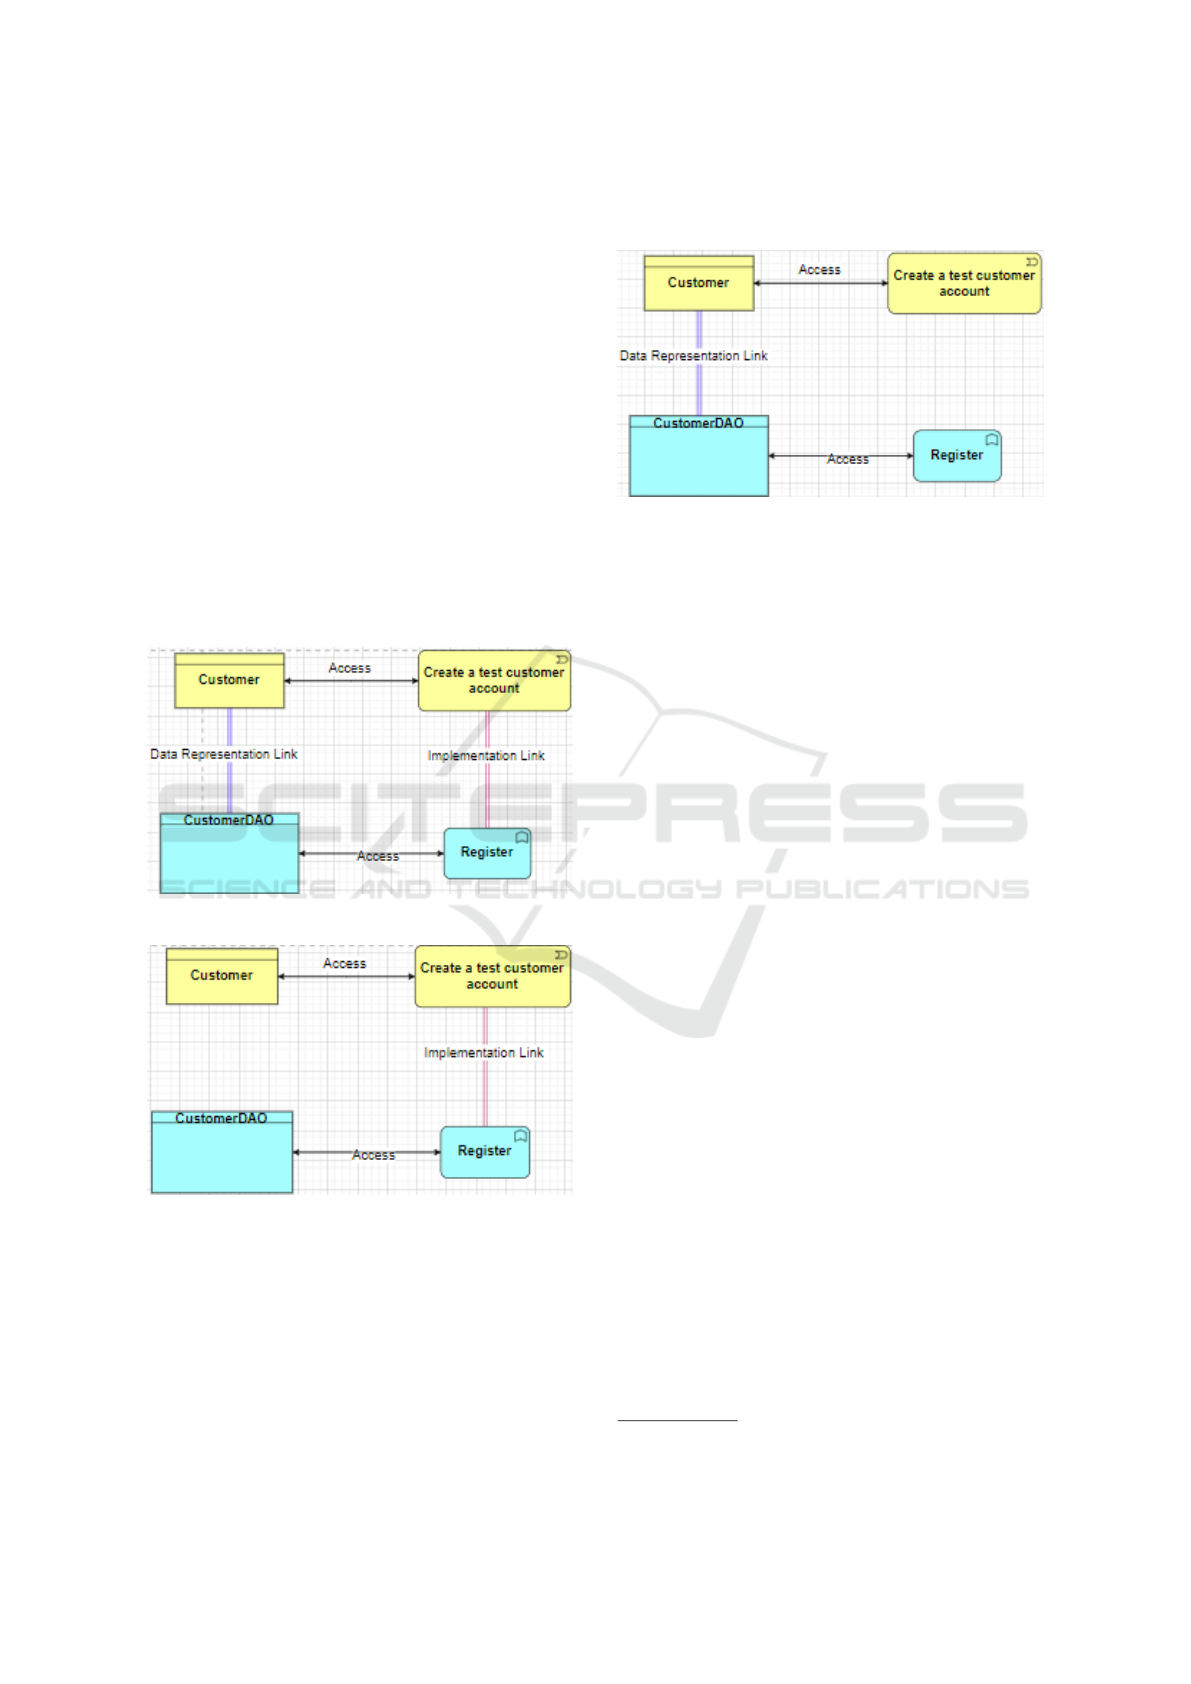
We propose the following consistency rules :
(A ∧ B) ∧C =⇒ D (1)
(A ∧ B) ∧ D =⇒ C (2)
(1) We verify for each pair (bfc,bdc) where bfc ac-
cesses bdc. If there is an afc implementing bfc then
adc, that is accessed by afc, should represent bdc. For
instance, in Figure 4, the pair of (bfc,bdc) (Create a
test customer account, Customer) shows that Create
a test customer account accesses Customer. There is
also the afc Register that implements the bfc Create
a test customer account. The consistency rule will
be at true if the adc CustomerDAO represents the bdc
Customer. It will be at false if it is not the case, as
illustrated in Figure 5.
Figure 4: Rules for consistency verification.
Figure 5: Non-verified Rule 1.
(2) We verify for each pair (bfc,bdc) where bfc ac-
cesses bdc. If there is an adc representing bdc then
afc that accesses adc, should implement bfc. For in-
stance, in Figure 4, the pair of (bfc,bdc) (Create a test
customer account, Customer) shows that Create a test
customer account accesses Customer. There is also
the adc CustomerDAO that represents the bdc Cus-
tomer. The consistency rule will be at true if the afc
Register implements the bfc Create a test customer
account. It will be at false if it is not the case, as illus-
trated in Figure 6.
Figure 6: Non-verified Rule 2.
We proposed two means to evaluate the aligne-
ment between the two layers and according to the
two dimensions: six metrics on pairs of concepts of
Business and Application layers and two consistency
rules. These two means provide indicators to domain
experts and software architects about the current state
of the alignment of their systems. In the next section,
we propose tool support for them.
6 IMPLEMENTATION
Establishing the links and evaluating the alignment
are complex and tedious activities, especially for large
information systems frequently evolving over time.
Indeed the COBITA activity replays periodically. To
be applicable, the evaluation means of Section 5 must
be implemented and supported by a tool for enterprise
Architects. There is a stack of requirements to fullfil:
(1) layer models, (2) link cartography, (3) metrics and
rule statements.
There exist various EA tools such as Visual-
Paradigm, SmartEA, Enterprise Architect or Modelio
BA. To implement the tool support associated to our
proposed approach, we decided to rely on the open
source Archimate modelling tool named Archi
2
for
different reasons: (i) Archi is an Enterprise Architec-
ture solution fully implementing the Archimate stan-
dard language that allows to properly model the two
layers and related concepts we target in the context
of COBITA (cf. Section 3); (ii) Archi is an open
source solution that can be freely reused and/or re-
fined according to our needs, for instance to repre-
sent and handle the COBITA links as extensions of
standard Archimate links (cf. Section 4); (iii) Archi
comes with an ecosystem and community offering
2
https://www.archimatetool.com/
ICEIS 2024 - 26th International Conference on Enterprise Information Systems
562

several additional plugins, including notably jArchi
3
that allows to navigate and query Archimate models
for evaluating the alignment (cf. Section 5).
The current version of the provided tool support is
structured as follows:
• Base Archi: for modelling the business and ap-
plication layers. For layers modelling, we directly
rely on the Archimate modelling features pro-
vided by the Archi tool. This includes a graphi-
cal model editor covering the Archimate standard
language. We customised Archimate ’aspects’ to
imlement the COBITA dimensions.
• Extended Archi: for supporting new types of
COBITA links. Archi natively supports 11 base
types of relationships from the Archimate stan-
dard. In addition, Archi allows defining new
types of relationships by specialising these base
types. In the context of the present work, as shown
in Figure 7, we specified the proposed new types
of COBITA links by specialising the Association
relationship. Note that the interface provided by
Archi also gives the number of occurrences of
each one of the newly specified types of links.
Figure 7: Specialization Manager in Archi tool for speci-
fying new types of COBITA links.
• jArchi: for exploiting the models and links to
evaluate the alignment. jArchi is a scripting plu-
gin provided by the developpers of Archi but not
integrated by default in the tool. Thus, we had to
deploy and build it ourselves so that it can then
be used within our Archi workbench. Thanks to
jArchi, we manipulated the Archimate models,
including the alignment links, in order to collect
the information needed to compute the proposed
metrics. We also used jArchi to navigate these
models with the objective to check the proposed
consistency rules. For instance, Listing 1 shows
the implementation in jArchi of a script for cal-
culating Metric 2 (cf. Section 5). The result of
the running of the script/metric is the list of all
unimplemented BPs in the model, in addition to
the total number of unimplemented BPs.
3
https://www.Archimatetool.com/blog/2018/07/02/
jArchi/
Listing 1: Script in jArchi implementing our Metric 2.
console.log(’The unimplemented business
processes are : \n’);
// Collect all elements of type business process
var collection = $(’business-process’)
//Set a counter
var count=0
//Loop on all business processes
collection.each(function(obj) {
if($(obj).rels(’association-relationship’).
length ===0)
{console.log(obj.name)
count++}
})
console.log(’\n There are’, count, ’
unimplemented business processes among’,
collection.length,’. Which gives a rate of
’, count/collection.length*100 ,’%’)
// The actual output is the name of all business processes
that are not implemented by any COBITA link
The source code of the implemented components,
as well as the complete models we used in the con-
text of our experiments on our illustrative system (cf.
Section 7), are all available online
4
.
7 EXPERIMENTATION
We illustrate our approach on the SoftSlate Commerce
Java shopping cart system that powers dozens of E-
commerce websites. This is a suitable candidate for
performing the experiments for the following reasons:
(i) We did not find available benchmark or models.
(ii) A concrete implementation of this system, the
SoftSlate web application
5
, is directly available online
including its complete source code and documenta-
tion. (iii) Some business processes have already been
built from this implementation by using reverse engi-
neering techniques based on user interactions with the
web application (Di Francescomarino et al., 2009).
Thus, it is an interesting starting point for the mod-
elling of the business layer. (iv) SoftSlate is reason-
ably complex in terms of structure and relatively large
in terms of number of lines of code.
7.1 Modelling the Layers
Business Layer of SoftSlate. In (Di Francesco-
marino et al., 2009), different business processes have
been automatically extracted from the SoftSlate web
application. They describe the main actions that
customers can do with the system, namely “Login”,
4
https://drive.google.com/drive/folders/
16rLhqmWhClTTfJ5m4Jhy0u7X8O JGApi
5
https://www.softslate.com/category/archivedDocs
Towards a Link Mapping and Evaluation Approach for Core Operational Business-IT Alignment
563
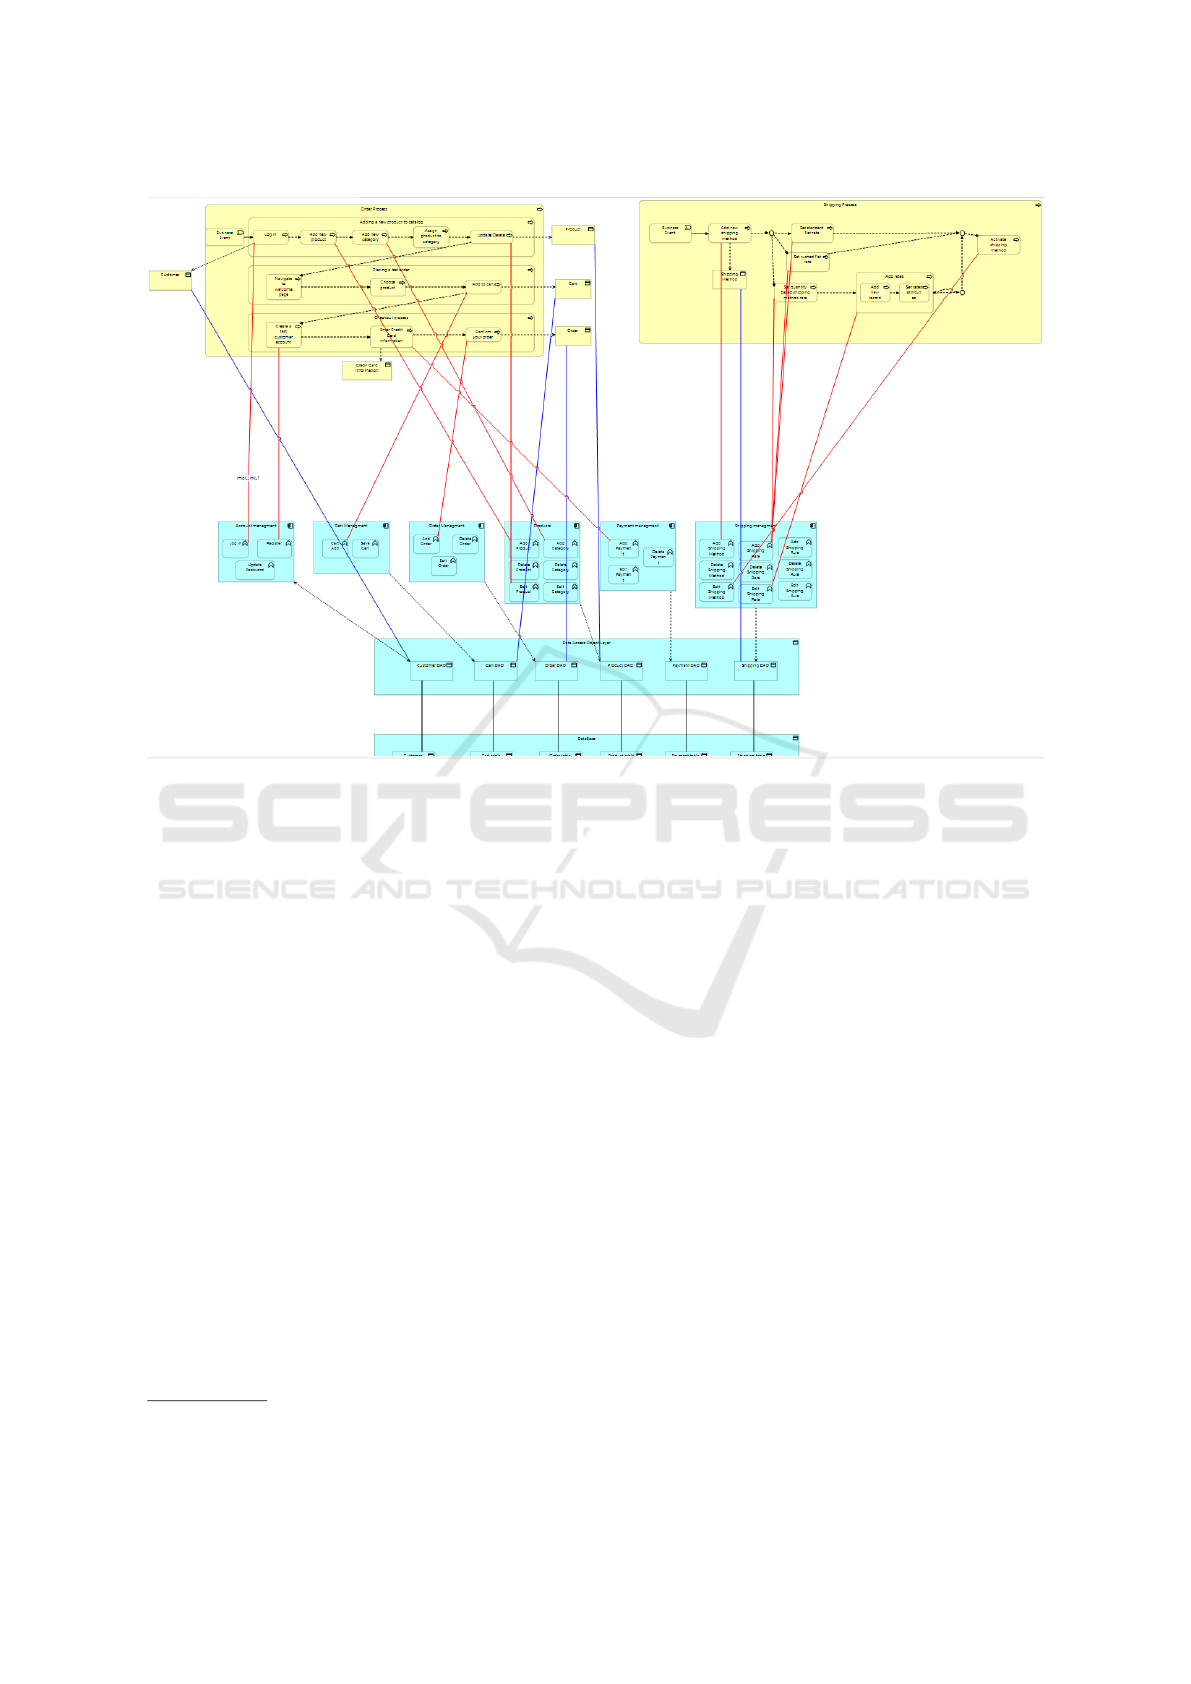
Figure 8: SoftSlate’s cartography of COBITA alignement.
“Register”, and “SaveCartItem”. To complement this
initial set of business processes, we also studied the
provided user guide
6
. In particular, we identified ad-
ditional business processes related to the system ad-
ministrators in charge of managing products, orders,
etc. In what follows, we focus on two of these newly
identified business processes BPs which are modeled
in yellow in Figure 8: (1) BP1: Add a product to the
list of products & Order that product; (2) BP2: Con-
figure shipping costs.
Application Layer of SoftSlate. We modeled the
application artifacts by directly looking into the
source code of the available implementation of SoftS-
late. It is a web application developed in Java with the
J2EE framework, and composed of five main pack-
ages: Customer, Administration, Business Objects,
DAO, Installer. The Customer package and the Ad-
ministrator package provide the core features of the
system. The Business Object package and DAO
package are also important because they are directly
used by the Administrator package.
However, these five main packages contain a
large number of sub-packages (46 in total), each one
of them containing a significant number of classes.
6
http://www.softslate.com/documentation/
userGuide2x.pdf
Thus, in the context of the current experiments, we
focused on the Administrator package. The Admin-
istrator package contains a set of Java classes of dif-
ferent types by following the Model–View–Controller
(MVC) software design pattern. Servlet classes im-
plement the ”Controller” part, JSP classes imple-
ment the ”View” part, while Bean, Processor and
DAO classes implement the ”Model” part. Moreover,
the Administrator package is responsible for imple-
menting the previously mentioned business processes
BP1 and BP2.
The complete application model we built is shown
in blue in Figure 8. Following a similar approach, we
modeled six Application Components, namely ”Ac-
count Management”, ”Cart Management”, ”Product”,
”Payment”, and ”Shipping”. For example, the appli-
cation component OrderProcessing has been modeled
by studying the Order sub-package from the Admin-
istrator package. This sub-package contains interre-
lated Java classes we represent as application func-
tions AFs (Add Order, Delete Order,Edit Order). Fi-
nally, the Order sub-package also contains DataAc-
cessObject (DAO) classes we represent as a single
DataObject (OrderDAO).
ICEIS 2024 - 26th International Conference on Enterprise Information Systems
564
7.2 Establishing COBITA Links
Based on the previously described models of the
business and application layers, we can move on to
the next step and establish alignement links between
these two layers.
Figure 8 displays the two business processes of
the business layer in yellow, and the application com-
ponents of the business layer in blue. We established
manually multiple COBITA links between model ele-
ments from these two layers. These links are of vari-
ous types (cf. Section 4) which are graphically rep-
resented by different colors. Red links correspond
to implementation links (functional dimension), while
the blue links correspond to representation links (data
dimension).
Such a cartography is already useful to get an
overview of the situation in terms of alignment. How-
ever, it is not sufficient to evaluate the actual quality of
this alignment. As a consequence, a deeper analysis
of the models and COBITA links is needed.
7.3 Evaluating the Alignment
In what follows, we apply the different metrics we
proposed in section 5.
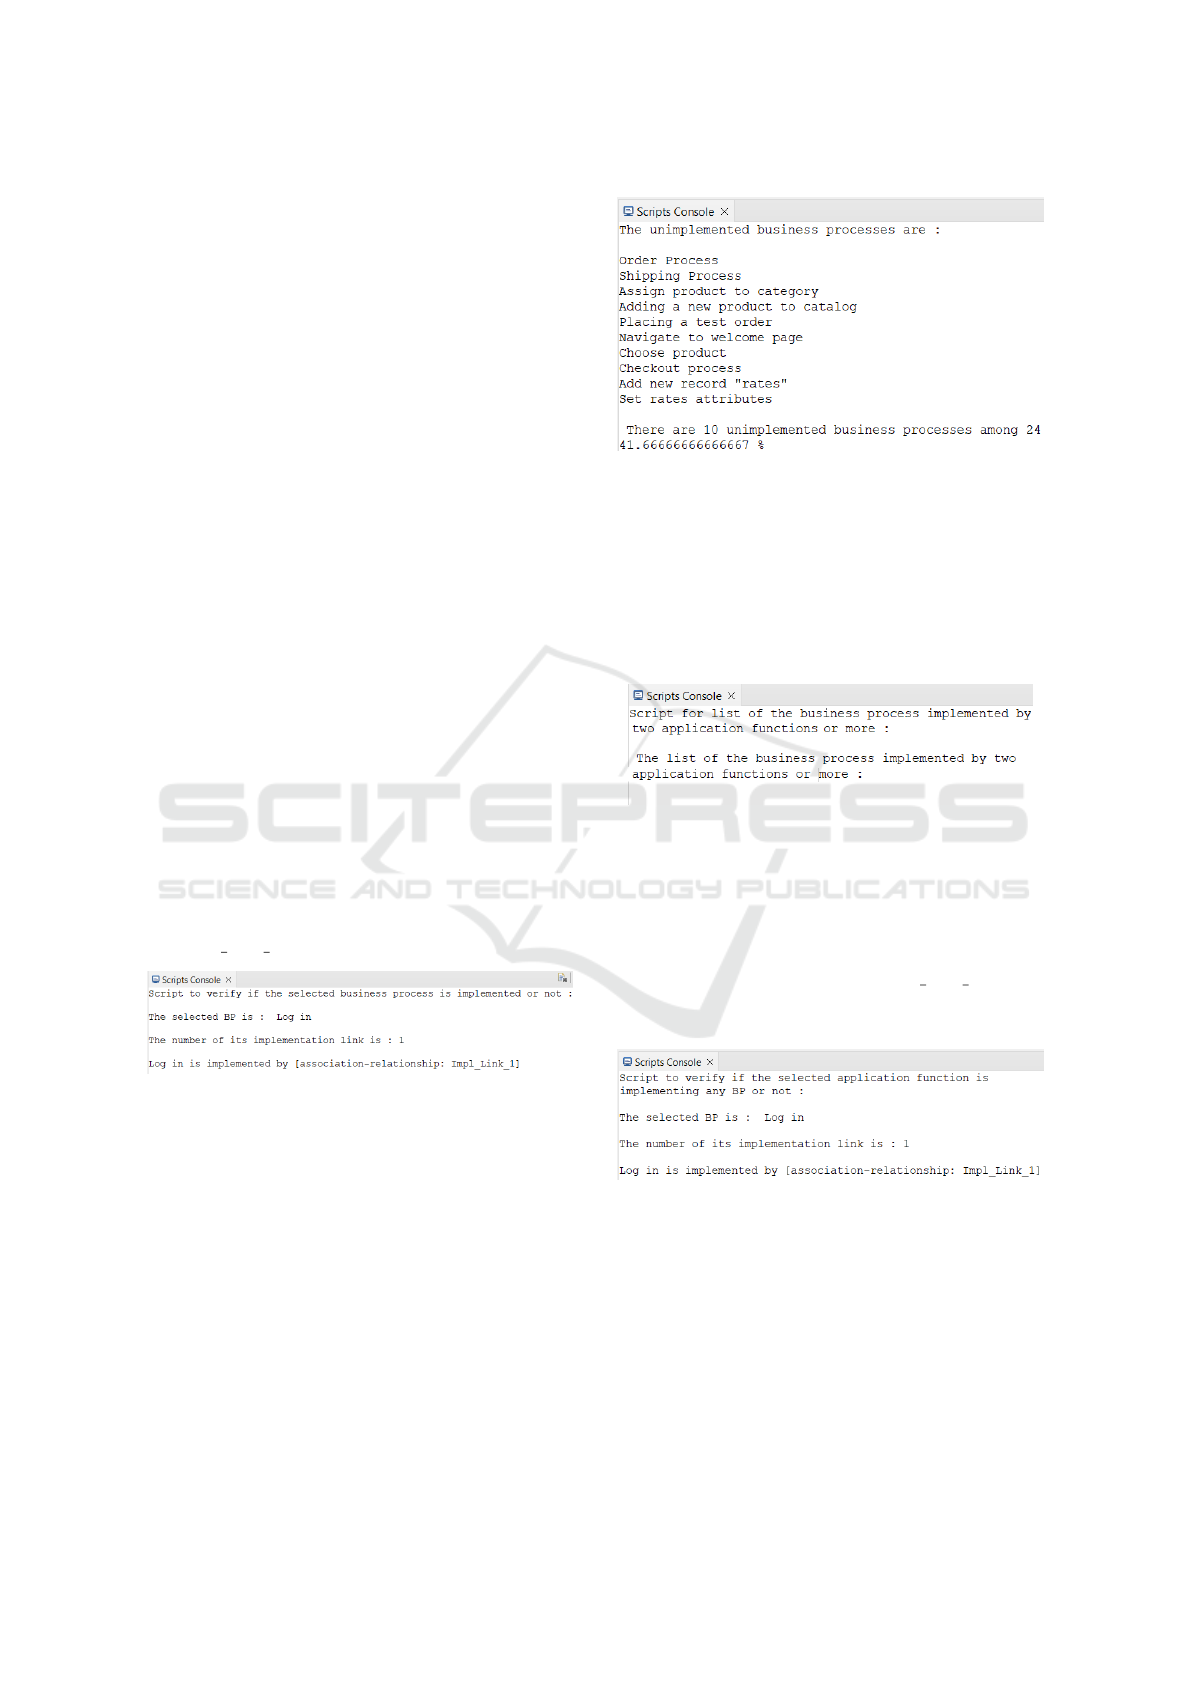
Metric 1. Figure 9 shows the output, in the jArchi
console, of the script that enables to verify if a given
BP is implemented and, if this is the case, also pro-
vides the number of implementation links of that BP.
The selected BP is ”Log in” and has 1 implementation
link Impl Link 1.
Figure 9: Result of Metric 1 on SoftSlate.
Metric 2. Figure 10 shows the output, in the
jArchi console, of the script that lists all the unim-
plemented BPs. The number of unimplemented BPs
is 10, among 24 BPs in the whole model (i.e., 41,6
% of unimplemented BPs). At first look, this number
can be considered as too high. However, such a con-
clusion can be mitigated when analysing the unimple-
mented BPs. For instance, BPs such as Order Process
and Shipping Order do not have implementation links
to AFs. Instead, these BPs contains other BPs that
are themselves implemented by AFs. Thus, Metric 2
could be refined in order not to integrate composite
BPs in the computation.
Figure 10: Result of Metric 2 on SoftSlate.
Metric 3. Figure 11 shows the output, in the
jArchi console, of the script that lists all BPs imple-
mented by two AFs or more. In the context of our cur-
rent experiments with SoftSlate, all implemented BPs
are implemented by only one implementation link.
Thus, we cannot draw any particular conclusion from
the result of this metric.
Figure 11: Result of Metric 3 on SoftSlate.
Metric 4. Figure 12 shows the output, in the
jArchi console, of the script that enables to verify
if a given AF is implementing any BP and, if this is
the case, also provides the number of implementation
links related to that AF. The selected AF is ”Log in”,
and has one implementation link Impl Link 1. This is
consistent with the result of Metric 1 since the same
implementation link is considered in both cases.
Figure 12: Result of Metric 4 on SoftSlate.
Metric 5. Figure 13 shows the output of the jArchi
script that lists all the AFs that are not directly imple-
menting BPs. The number of these AFs is 14, among
26 AFs in the whole model (i.e., 53,8 % of the AFs).
Similarly to the result of Metric 2, this number can be
considered as too high. However, once again, such a
conclusion can be mitigated when analysing the non-
implementing AFs. For instance, Update Password is
not directly implement any BP. Instead, this AF is re-
Towards a Link Mapping and Evaluation Approach for Core Operational Business-IT Alignment
565
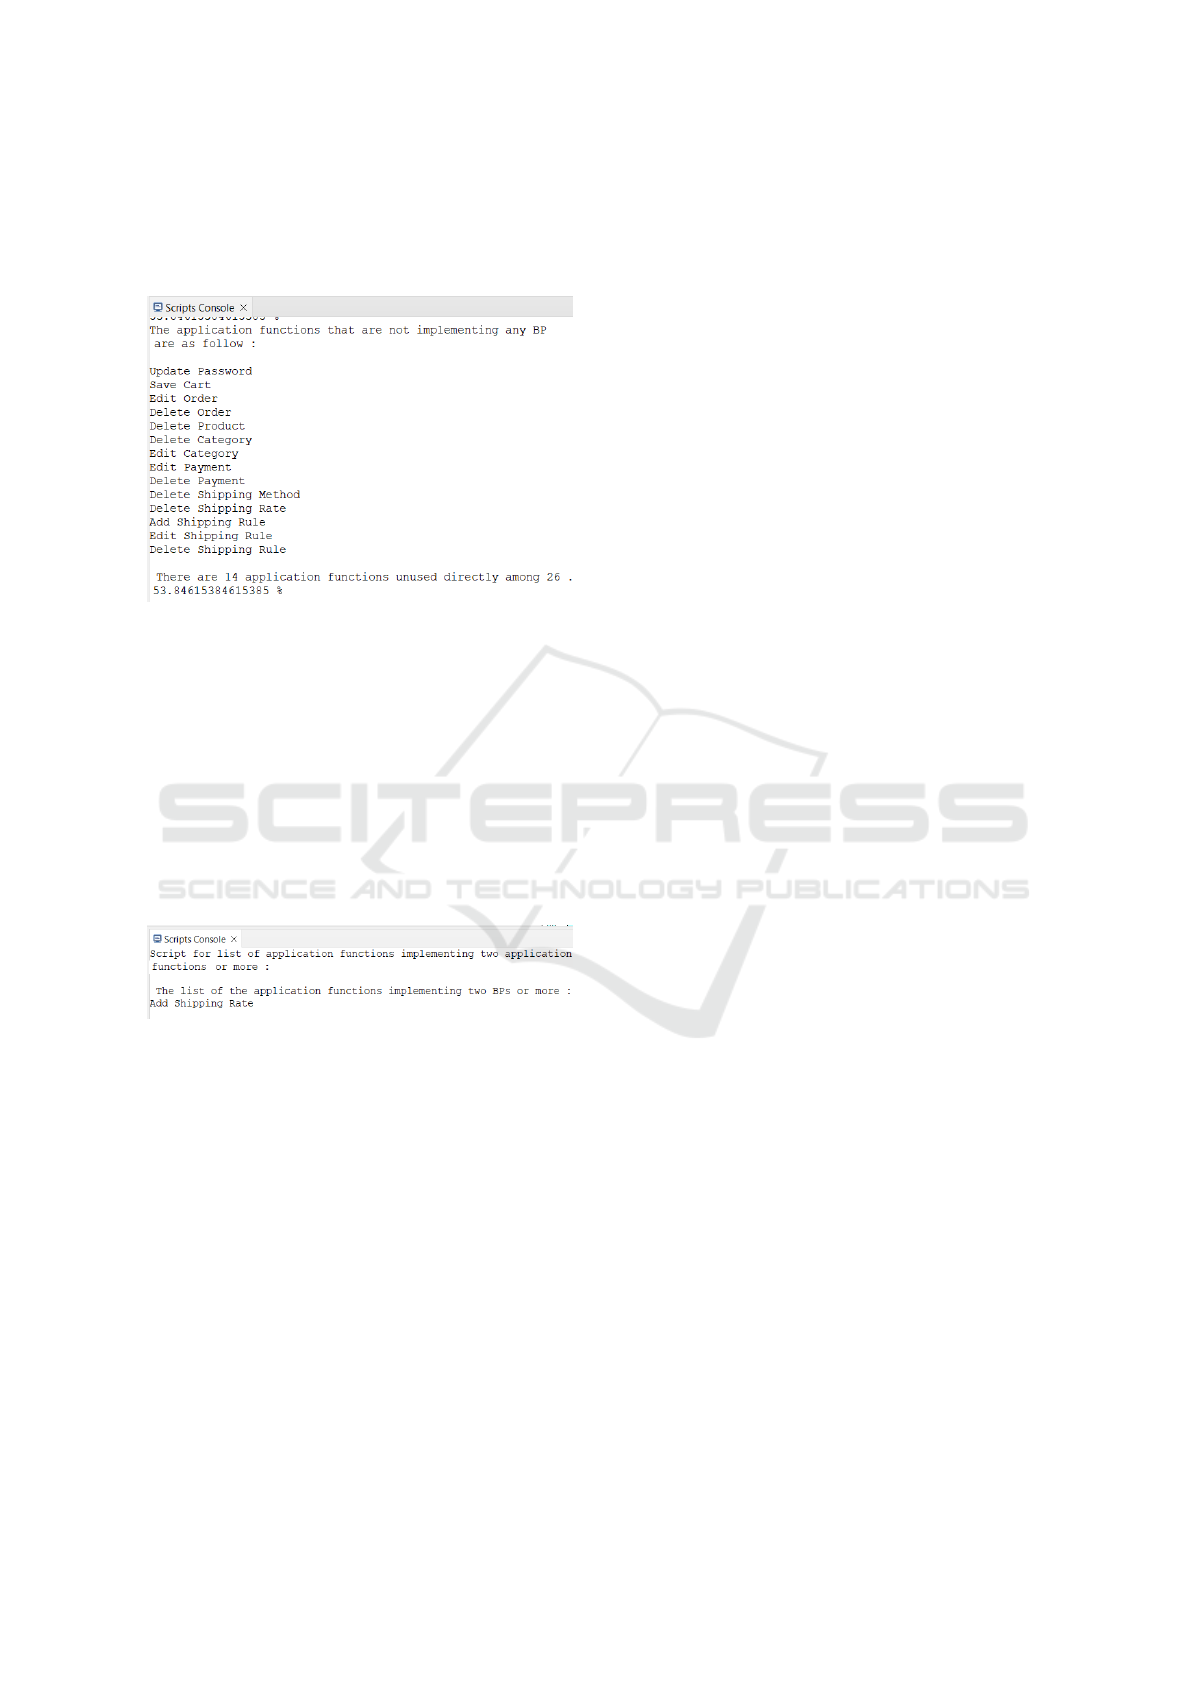
lated to a BP that is not modeled yet, i.e., a BP that
allows a user to change its password. Thus, the actual
coverage is likely to be better than what is currently
visible in our cartography.
Figure 13: Result of Metric 5 on SoftSlate.
Metric 6. As shown on Figure 14, the most used
AF is ”Add Shipping Rates” that implements three
BPs. At first look, this highlights that this partic-
ular AF is rather important compared to other AFs.
However, such a conclusion can be mitigated when
analysing the concerned BPs. For example, in this
case we noticed that the three BPs are coming from an
or-junction and thus correspond to parallel processes.
Thus, Metric 6 could be refined in order to also re-
turn the corresponding BPs (and not only their total
number) and further analyse their dependencies.
Figure 14: Result of Metric 6 on SoftSlate.
We illustrated a few metrics to evaluate quantita-
tive aspects such as completeness ratios. Indicators
are built on a hierarchic aggregation of simpler met-
rics. There remains work to compute alignment indi-
cators to assert that alignment is achieved at X%. We
will discuss metrics as one feature of the next section.
8 RELATED WORK
We studied the related work contributing to inter-
layers links, alignment evaluation and tooling. In each
case, we discuss layers modelling, links, evaluation,
tooling and experimentation. A general and more
detailed comparison of COBITA approaches can be
found in a previous study (Andr
´
e et al., 2023).
Aversano et al. propose a BITA framework with
tool support (Aversano et al., 2016). They use
UML diagrams for layers modelling. The inter-
layer links are ’functions’ from business entities (ac-
tivities) to software components (operations, artifact
classes). The evaluation of alignment considers two
attributes (Technological Coverage and Technologi-
cal Adequacy) performed on activities, actors, arte-
facts and transitions. The results are then aggregated
by summing the values of the computed metrics in or-
der to calculate a degree of alignment that covers a
wider scope thant COBITA, including strategy. The
overall approach is a major reference because it cov-
ers the range from links to tool support with spe-
cial contribution to metrics to suggest evolution ac-
tions. Unfortunately, both the tool and the SantaClaus
case study are not publicly available. They propose
a semantic analysis based on identifiers and lexical
information which becomes pertinent only if the IS
provider use strict development rules uncluding trace-
ability information, which is rarely the case. Also
the alignment is based mainly on the functional di-
mension and provide limited analysis. We are con-
vinced that multi-dimension increases the power of
alignment evaluation (consistency verification, align-
ment metrics) by providing various kind of alignment
patterns combining data and functions for example.
The work of Etien et al. (Etien and Rolland, 2005)
is based on ontologies. In their approach, alignment
is called ’fitness’ because it is centered on metrics.
The authors define two types of links: maps is an
inter-layer link, and represents is an abstraction of
inter-layer link at the concept level of the ontolo-
gies. The evaluation part leans on ten different met-
rics. These metrics represent four factors (intentional
- informational - functional - dynamic) which are in-
spired by a reference software quality measurement
framework (Cavano and McCall, 1978). Experimen-
tations are led on a Renault/DIAC case study. Un-
fortunately, it is not publicly available. This work
is really a reference in terms of metrics. However
it suffers from several weaknesses: (i) Ontologies
are not common notations for EA architects and re-
quires to develop tools for input/output. (ii) Like other
BITA approaches (Castellanos and Correal, 2013;
S
´
anchez et al., 2020), it is inpired from Ontology
alignment (Euzenat et al., 2008) that aims to match
’similar’ concepts. However business layers and ap-
plication layers may have very different concepts, es-
pecially in legacy systems where software compo-
nents and application may be defined while service
and functions may not. (iii) There miss tool support
at every stage.
The work of Pepin et al. covers the full range of
ICEIS 2024 - 26th International Conference on Enterprise Information Systems
566

activities for COBITA (Pepin et al., 2016) Three lay-
ers are involved: business (BPM), application (App)
and functional (Fun) where Fun denotes an urbanisa-
tion concern with blocks and functionalities. Fun cor-
responds to Enterprise Architecture practice in French
companies (Long
´
ep
´
e, 2003). A link metamodel is
provided that distinguishes data and functions. The
alignment is implemented by model weaving to re-
main non-intrusive on the layer models, that enables
OCL-like requests on the full model. Is is evaluated
through consistency rules, and completeness metrics
and clustering techniques that provide an alignment
dashboard. Tooling focuses on reverse-engineering
source code to feed the App models, a plug-in of the
EMF Facet project to define and query the inter-layer
links, and OCL queries to evaluate alignment. The
experimentations are led with three legacy cases pro-
vided by three French insurance companies, not pub-
licly available. This work is really close to us because
it focuses on COBITA in practice and provides both
guidelines and tools. However, ad-hoc layer models
is a weakness to pervasive EA practice. We rather
advocate for relying on standard notations. Also hav-
ing three layers to align instead of two is not usual in
COBITA practice. If the dimensions cover the three
layers, it really becomes tricky to capture the links.
In our approach, the dimension paradigm enables to
filter the various stakeholder concerns. Similarly, the
detection of anti-patterns is easier using two layers
with dimensions rather than three layers.
Some works provide rich inter-layer links (K
¨
uster
et al., 2016; Buchwald et al., 2012; Kassahun and
Tekinerdogan, 2020) that play a role of mapping layer
between the model layers. These approaches are
interesting in terms of alignment tuning and evolu-
tion. In particular, (K
¨
uster et al., 2016) accepts sev-
eral models for each layer. The links of (Buchwald
et al., 2012) play the role of transformation opera-
tors which is an operational vision of COBITA to im-
plement business process, while COBITA addresses
also the problem of aligning legacy code. In (Kas-
sahun and Tekinerdogan, 2020), alignment applies
between business layers (BP2BP), IT-Layers (IT2IT)
and between Business-IT layers (BP2IT). The BT2IT
alignement considers allocation and alignment mod-
els. Providing general rules for those alignements
is very confusing for the EA analysts because there
clearly exist at least two different semantics of align-
ment. The problem of such rich inter-layer links is
that they require much work for alignment while EA
analysts require as much automation as possible. Also
the alignement evaluation and tool support is less
reusable in other contexts.
Compared to the related works, our contribution
brings out insights on alignment mapping embodied
by the dimension-oriented typology of links. We pro-
vide explicit links with a clear representation and se-
mantics, easy to compute into EA layer models. This
enables further insights related to alignment evalua-
tion and exploitation. Moreover, we focus on evalu-
ating alignments with operational means while other
approaches focus on change impact and evolution,
that we consider at a future step.
9 CONCLUSION AND
PERSPECTIVES
In this paper, we proposed a method for establish-
ing Core Business-IT Alignment (COBITA) links and
evaluating them in order to evaluate the quality of the
alignement. We first selected the concepts from the
Business and Application layers which are relevant
for COBITA. Then we defined two kind of inter-layer
links, one for the functional dimension and the other
for functional dimension. Based on these links, we
proposed metrics and consistency rules to evaluate the
alignment. We implemented the models and links in
Archi, the reference Archimate tool, and the evalua-
tion means with jArchi a script language extension
of Archi. The results of our initial experiments show
that the proposed approach is applicable in the context
of a realistic information system like SoftSlate. This
case could be reuse by the community as a common
benchmark for COBITA experiments.
With this paper we reached a first milestone, like
a first sprint covering the whole alignment process
in an Agile vision. However, there is still room for
improvement concerning several aspects of the ap-
proach. First, we worked on very general links while,
in Archimate (for example), different relationships
can be used and provide a finer semantics for inter-
links. Second, more work is needed to enrich the pro-
vided library of metrics and consistency rules. We
will also have to work on their aggregation as ade-
quate indicators to be inserted in dashboards. The
objective is to support the architects in detecting is-
sues or asserting a quality level. To this end, a more
elaborated taxonomy of possible COBITA links could
be proposed in order to further improve the quality of
the cartography in terms of alignment links. Third,
we manually fed the models and links so far but assis-
tance is crucially requested by the architects for such a
task, e.g., concerning the application layer e.g. (Aver-
sano et al., 2016; Pepin et al., 2016) or the links
(e.g. (S
´
anchez et al., 2020) for function refinement).
Finally, there are COBITA areas we did not study yet
and we plan to address in future work, such as change
Towards a Link Mapping and Evaluation Approach for Core Operational Business-IT Alignment
567

impact and evolution (Aversano et al., 2016; Dahman
et al., 2013; S
´
anchez et al., 2020).
REFERENCES
Andr
´
e, P., Tamzalit, D., Benjilany, A., and Bruneliere, H.
(2023). A review of core operational business-it align-
ment. In ISD 2023 Proceedings, pages 1–12, Lisbon,
Portugal. AIS eLibrary.
Aversano, L., Grasso, C., and Tortorella, M. (2016). Man-
aging the alignment between business processes and
software systems. Information and Software Technol-
ogy, 72:171–188.
Buchwald, S., Bauer, T., and Reichert, M. (2012). Bridg-
ing the gap between business process models and ser-
vice composition specifications. In Service Life Cy-
cle Tools and Technologies: Methods, Trends and Ad-
vances, pages 124–153. IGI Global.
Castellanos, C. and Correal, D. (2013). A framework for
alignment of data and processes architectures applied
in a government institution. J. Data Semant., 2(2-
3):61–74.
Cavano, J. P. and McCall, J. A. (1978). A framework for the
measurement of software quality. In Proceedings of
the Software Quality Assurance Workshop on Func-
tional and Performance Issues, page 133–139, New
York, NY, USA. Association for Computing Machin-
ery.
Dahman, K., Charoy, F., and Godart, C. (2013). Align-
ment and change propagation between business pro-
cesses and service-oriented architectures. In IEEE
SCC 2013, Santa Clara, CA, USA, pages 168–175.
IEEE Computer Society.
Di Francescomarino, C., Marchetto, A., and Tonella, P.
(2009). Reverse engineering of business processes ex-
posed as web applications. In 2009 13th European
Conference on Software Maintenance and Reengi-
neering, pages 139–148. IEEE.
Etien, A. and Rolland, C. (2005). Measuring the fitness
relationship. Requirements Engineering, 10(3):184–
197.
Euzenat, J., Mocan, A., and Scharffe, F. (2008). Ontol-
ogy Alignments, pages 177–206. Springer US, Boston,
MA.
Gellweiler, C. (2021). IT architects and it-business align-
ment: a theoretical review. In CENTERIS 2021 - Pro-
jMAN 2021 - HCist 2021, Braga, Portugal, volume
196, pages 13–20. Elsevier.
Gero, J. S. and Kannengiesser, U. (2014). The Function-
Behaviour-Structure Ontology of Design, pages 263–
283. Springer London, London.
Gouigoux, J.-P. and Tamzalit, D. (2021). Business-IT align-
ment anti-patterns: a thought from an empirical point
of view. In ISD 2021, Valencia, Spain.
Habba, M., Fredj, M., and Benabdellah Chaouni, S. (2019).
Alignment between business requirement, business
process, and software system: a systematic literature
review. Journal of Engineering, 2019.
Henderson, J. C. and Venkatraman, H. (1999). Strate-
gic alignment: Leveraging information technology
for transforming organizations. IBM Systems,
38(2.3):472–484.
ISO/IEC/IEEE (2011). Systems and software engineer-
ing – architecture description. ISO/IEC/IEEE
42010:2011(E), pages 1 –46.
Kassahun, A. and Tekinerdogan, B. (2020). Bita*:
Business-it alignment framework of multiple collabo-
rating organisations. Information and Software Tech-
nology, 127:106345.
K
¨
uster, J. M., V
¨
olzer, H., Favre, C., Branco, M. C., and
Czarnecki, K. (2016). Supporting different process
views through a shared process model. Softw. Syst.
Model., 15(4):1207–1233.
Lankhorst, M. M. (2013). Enterprise Architecture at Work -
Modelling, Communication and Analysis (3. ed.). The
Enterprise Engineering Series. Springer.
Long
´
ep
´
e, C. (2003). The enterprise architecture IT project:
the urbanisation paradigm. Elsevier.
Pepin, J., Andr
´
e, P., Attiogb
´
e, J. C., and Breton, E. (2016).
An improved model facet method to support EA align-
ment. Complex Systems Informatics and Modeling
Quarterly, 9:1–27.
S
´
anchez, E. S., Clemente, P. J., Conejero, J. M., and Prieto,
A. E. (2020). Business process execution from the
alignment between business processes and web ser-
vices: A semantic and model-driven modernization
process. IEEE Access, 8:93346–93368.
Zhang, M., Chen, H., and Luo, A. (2018). A systematic re-
view of business-it alignment research with enterprise
architecture. IEEE Access, 6:18933–18944.
ICEIS 2024 - 26th International Conference on Enterprise Information Systems
568
