
Analyzing Sepsis Treatment Variations in Subpopulations with Process
Mining
F. M. Rademaker, R. H. Bemthuis
a
, J. Jayasinghe Arachchige
b
and F. A. Bukhsh
c
University of Twente, Drienerlolaan 5, 7522 NB, Enschede, The Netherlands
Keywords:
Subpopulation Analysis, Process Mining, Healthcare Processes, Sepsis.
Abstract:
Healthcare processes frequently deviate from established treatment protocols due to unforeseen events and the
complexities of illnesses. Many healthcare procedures do not account for variations in treatment paths across
different diseases and patient subpopulations. Understanding the similarities and differences in treatment
paths for different patient groups can provide valuable insights and potential process enhancements for various
subgroups of concern. For hospitals, understanding various patient populations, such as severe or non-severe
cases, is key for enhancing care paths. In this paper, we aim to compare treatment procedures for different
subpopulations of patients using process mining techniques and identify indicators to improve the care path.
We utilize the process mining for healthcare (PM
2
HC) methodology to identify variations in treatment paths
among different patient subgroups. We conducted a case study on sepsis, a complex illness with a wealth
of available data, for in-depth analysis. Our findings indicate that various subpopulations exhibit different
outcomes, offering promising directions for further research.
1 INTRODUCTION
Hospital Information Systems (HISs) contain a
wealth of data on healthcare processes (Mans et al.,
2013). These processes, while partially structured,
frequently involve multiple stakeholders and excep-
tion handling, which can lead to ad hoc decision-
making (Mans et al., 2015). The information stored in
a HIS can reveal valuable insights into how healthcare
processes are actually carried out in practice (Mans
et al., 2013).
This research focuses on sepsis, a life-threatening
condition typically resulting from infections, with a
mortality rate ranging from 20% to 50% (Gyawali
et al., 2019). The elderly are particularly vulnera-
ble to this condition. The mean mortality rate of
hospital-based sepsis is 35%. Approximately 10 out
of 1000 patients are diagnosed with sepsis, and 30%
of them develop Multiple Organ Dysfunction Syn-
dromes (MODS) (Polat et al., 2017). In addition to
the high mortality rate, sepsis has the second-highest
readmission rate, with 18 − 26% of patients returning
to the hospital within 30 days (Mans et al., 2008).
Process mining techniques present methods for
analyzing sepsis data and pinpointing the procedures
a
https://orcid.org/0000-0003-2791-6070
b
https://orcid.org/0000-0001-8619-6523
c
https://orcid.org/0000-0001-5978-2754
involved in sepsis treatment. Despite prior research
demonstrating the effectiveness of process mining in
analyzing sepsis event logs (Hendricks, 2019), to our
knowledge, there has been no exploration of the dif-
ferences in treatment and care pathways for various
subpopulations. While researchers have discovered
how sepsis can impact a patient (Gyawali et al., 2019),
the question of how to learn from best treatment prac-
tices remains to be addressed. As an initial step,
we can investigate subpopulation comparisons, em-
phasizing specific subgroups to understand best prac-
tices better. Subpopulations based on attributes such
as age (Martin et al., 2006), severity (Mans et al.,
2008), and Systemic Inflammatory Response Syn-
drome (SIRS) criteria (Comstedt et al., 2009) have
been demonstrated to be reliable predictors of sepsis.
The exploration of processes within electronic
health record event data provides insights into patient
flows. Ongoing research continues to explore these
processes across various sub-populations (Marazza
et al., 2020). This paper contributes to the aforemen-
tioned research direction by systematically identify-
ing and comparing patient sub-populations. In this
paper, we aim to analyze and contrast treatment pro-
cedures across diverse patient subpopulations using
process mining techniques. Our goal is to identify
key indicators that could significantly enhance pa-
tient care path trajectories. To achieve this goal, we
first categorize subpopulations by identifying distinct
Rademaker, F., Bemthuis, R., Arachchige, J. and Bukhsh, F.
Analyzing Sepsis Treatment Variations in Subpopulations with Process Mining.
DOI: 10.5220/0012600700003690
Paper published under CC license (CC BY-NC-ND 4.0)
In Proceedings of the 26th International Conference on Enterprise Information Systems (ICEIS 2024) - Volume 1, pages 85-94
ISBN: 978-989-758-692-7; ISSN: 2184-4992
Proceedings Copyright © 2024 by SCITEPRESS – Science and Technology Publications, Lda.
85

treatment procedures based on attributes discovered
through literature search and data exploration. We
then apply process mining discovery techniques to
these subpopulations and compare the resulting pro-
cess models to examine the efficacy of care paths. Ac-
knowledging the limitations of solely visual compar-
isons, we supplement our analysis with quantitative
evaluations. We guide our process mining project us-
ing the PM
2
HC methodology (Pereira et al., 2020)
and select appropriate tools/plug-ins for comparing
the process models. The results of this comparison
can provide insights into best practices for each sub-
population, facilitating the design of more personal-
ized and efficient treatments and thereby improving
the overall quality of care for sepsis patients.
Our contributions are as follows: (1) we intro-
duce an approach that incorporates a well-established
PM
2
HC methodology for conducting a process min-
ing project, with the added step of subpopulation anal-
ysis; (2) as an evaluation, we perform a case study on
sepsis using the proposed approach and a real-world
dataset, providing valuable insights into optimal care
paths.
The remainder of this paper is structured as fol-
lows. Section 2 discusses the background of this re-
search. Section 3 presents the approach that is fol-
lowed. Section 4 discusses the findings based on the
case study. Section 5 provides a discussion. Finally,
Section 6 concludes and discusses future work.
2 BACKGROUND AND RELATED
WORK
Early diagnosis and optimal patient care are essential
for the effective management of sepsis (Gyawali et al.,
2019). Researchers have proposed a scoring system
that uses biomarkers to assess the likelihood of devel-
oping sepsis (Samraj et al., 2013). This system can as-
sist in early detection, pinpointing high-risk patients,
and monitoring the disease’s progression. One widely
recognized biomarker is the SIRS criteria, which en-
compasses measurements such as temperature (below
36°C or above 38°C), heart rate (exceeding 90 beats
per minute), respiratory rate (more than 20 breaths per
minute), and white blood cell count (10
3
/µL) either
below 4 or above 12 (Comstedt et al., 2009).
Numerous academic studies have delved into the
application of process mining in healthcare (Dal-
lagassa et al., 2021; Munoz-Gama et al., 2022),
also with a particular focus on contrasting processes
among varied subpopulations. Research in process
mining has been pivotal in evaluating care paths
for sepsis, notably from bottleneck and performance
viewpoints (Hendricks, 2019). One study (Parting-
ton et al., 2015) analyzed processes across four Aus-
tralian hospitals, comparing service performance and
efficiency. The authors devised a unified process
model encompassing the paths of patients from all
the participating hospitals. While this study provided
valuable insights into healthcare processes, the visual
representation of their comparative analysis was con-
strained. Further research is required to enhance these
visualizations and to correlate observed processes
with health outcomes (Partington et al., 2015). An-
other study (Mans et al., 2008) applied process min-
ing techniques to analyze clinical data of stroke care
across various hospitals and subpopulations. Simi-
larly, another study (Marazza et al., 2020) contrasted
cancer treatment processes across two hospitals em-
ploying process mining techniques.
However, on the whole, there has been a scant fo-
cus on contrasting these processes specifically within
defined subpopulations. While factors like patient
age, gender, and infection type can influence the pre-
scribed care path (Quintano Neira et al., 2019), there
is limited research on comparing subpopulations to
identify the most effective care paths. In contrast, our
study illustrates the delineation of sepsis patient sub-
populations and the integration of subsequent analy-
ses into a pre-existing process mining methodology.
We employ a dataset with real-world case data and
adapt the widely adopted PM2 methodology for pro-
cess mining projects (van Eck et al., 2015) to discern
and illustrate treatment variations across subpopula-
tions.
3 APPROACH
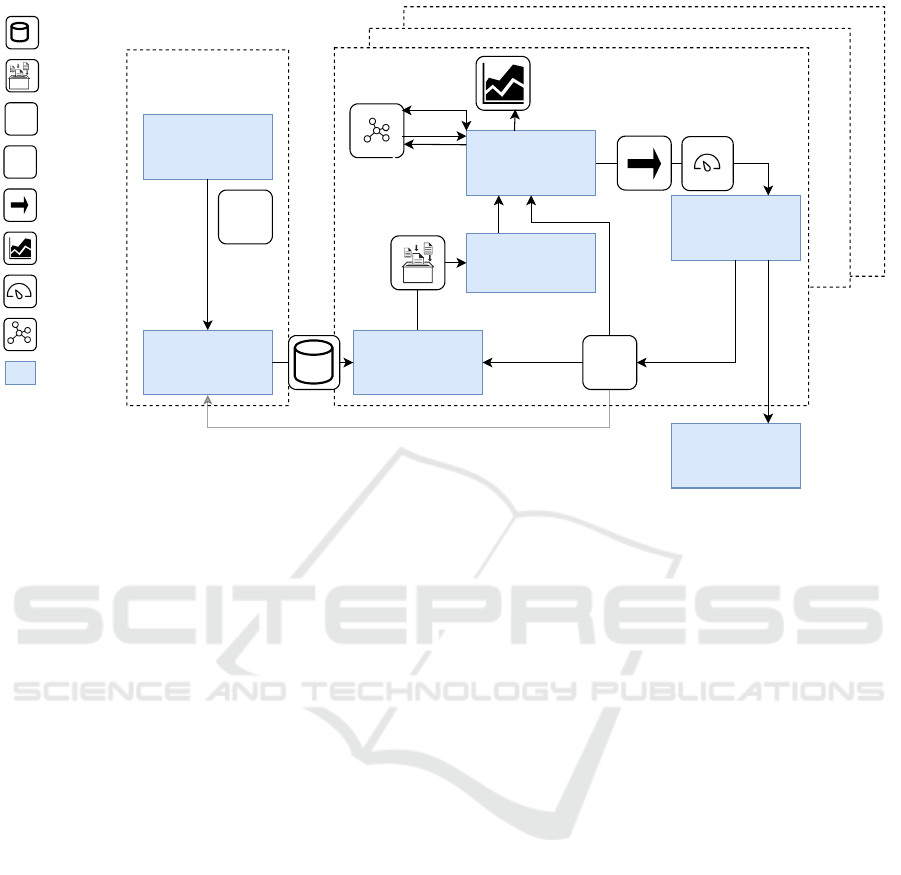
The modified methodology is detailed below and vi-
sualized in Figure 1. Although our approach aligns
with the PM
2
HC methodology, which is specifically
designed for the healthcare domain, we have made
some modifications by introducing stakeholder roles
and a subpopulation selection phase for simplification
purposes.
3.1 Research Planning
In the first phase, a healthcare process is selected, and
research goals are defined. During this phase, the
scope and metrics to be used for comparing process
models should also be determined. Additionally, one
must select the tools and algorithms for process ex-
ploration and mining.
We selected the sepsis dataset (Mannhardt, 2016)
for comparison using BPMNDiffViz and ProM (van
ICEIS 2024 - 26th International Conference on Enterprise Information Systems
86
1. Planning
6. Evaluation
2. Extraction 3. Data Processing
5. Mining and Analysis
Initialization
Analysis Iterations
Analysis Iterations
Analysis Iterations
?
?+
Analytics
Discovery
Conformance
Enhancement
4. Subpopulation
Selection
?
?+
F
F
Event Data
Event Logs
Refined/New research
questions
Research question
Compliance findings
Analytic models
Performance findings
Process models
Stage
Filtering
C
Clustering
C
7. Process
Improvements from
Best Practices
Figure 1: Visualization of the approach, based on the PM
2
HC methodology (Pereira et al., 2020).
Dongen et al., 2005). Section 4.2 explains how we
will use the graph edit distance (using the graph edit
distance metric and conformance checking metrics).
3.2 Extraction
In the extraction phase, the study’s boundaries are fur-
ther determined. It involves selecting the relevant data
and excluding irrelevant information. In this research,
we extracted and retrieved event data related to sep-
sis cases from a hospital dataset (Mannhardt, 2016).
The extracted data underwent cleaning and prepara-
tion. We performed data preparation steps as dis-
cussed by (Mannhardt and Blinde, 2017). We have
limited the scope of the study to real-life data of pa-
tients who were admitted to the hospital’s emergency
room (Hendricks, 2019). Each case is represented by
a trace, which records the patient’s journey through
the hospital. More information about the dataset can
be found in Subsection 4.1.
3.3 Data Processing
This phase encompasses an iterative analysis process
requiring iteration between the third, fourth, and fifth
phases of our methodology. In this phase, the data is
processed by creating visualizations of the processes
(i.e., process discovery). The typical steps involved
in this phase include aggregating events, filtering and
enriching logs, and identifying performance indica-
tors. These steps culminate in the outcomes of the
third, fourth, and fifth phases.
The visualizations created in this phase provide
more insight into the recorded events. We will use
dotted charts and process model visualizations. To do
this, we import the XES file containing the events logs
into the ProM platform and then filter the file into sub-
populations using the “Filter Event Log” and “Filter
Log by Attributes” plugins.
3.4 Subpopulation Selection
The subpopulation identification phase is introduced
as an additional step to the PM
2
HC methodology
for data processing. This step involves using the
“LogVisualiser (LogDialog)” plugin to analyze the
data and conduct literature research to identify rel-
evant attributes (such as age, severity, process dura-
tion, etc.) that can be used to create subpopulations.
As suggested by (Mamaliga, 2013), the data should
be segmented into data cubes based on a combination
of these attributes. A more detailed explanation of
subpopulation selection and analysis can be found in
Subsection 4.1.
3.5 Mining & Analysis
In the fifth phase, process-related data is mined and
analyzed to gain insight into different treatment paths
and care paths. The main objective of this phase is
Analyzing Sepsis Treatment Variations in Subpopulations with Process Mining
87

to derive insights from the sepsis treatment processes.
Performance analysis is conducted to gain insights,
and the models created are evaluated through confor-
mance analysis.
To further examine the process models, the “In-
ductive Visual Miner” plugin is employed. This tool
helps to analyze the number of resources, such as
individuals, following specific activities, identifying
relative paths, and locating bottlenecks. Addition-
ally, performance indicators are identified using the
tool, which also enables performance and confor-
mance analysis. Subsection 4.3 provides an explana-
tion of the tool’s implementation.
3.6 Evaluation
The primary objective of this phase is to gain in-
sights into the processes involved in sepsis treatment.
The numerical values obtained are translated into new
learning perspectives and suggestions for improve-
ment, ultimately leading to conclusive findings.
In our case study, we evaluated the results ob-
tained from the comparisons made using BPMNDif-
fViz and observations gleaned from the “Inductive Vi-
sual Miner” plugin. We have supported our evaluation
through scientific literature.
3.7 Improvement & Support
In the final phase, the findings are evaluated, future
implementation plans are developed, and suggestions
for improvements are made. The aim is to provide an
optimal path for future learning guided by best prac-
tices. During this phase, all results are evaluated and
interpreted. However, as this is the final phase of the
research, it excludes the execution of the actual im-
plementation plan. For future research, we are in the
process of obtaining a sepsis dataset from hospitals in
the Netherlands. Stakeholders can use the results ob-
tained from this phase as a reference scenario for data
preparation and extraction in subsequent studies.
4 FINDINGS
This section describes the findings and the results of
execution the steps described in the previous section.
4.1 Division of Subpopulations
As mentioned previously, subpopulations are classi-
fied based on specific attributes and their relation to
the diagnosis of sepsis, as well as the severity level
that the attribute suggests. The dataset comprises 31
attributes, primarily consisting of blood values and di-
agnoses. The attributes used for categorizing the data
into different subpopulations are age, and the num-
ber of SIRS criteria met (SIRS criteria ≥ 2, which in-
dicates an increased likelihood to be diagnosed with
sepsis (Comstedt et al., 2009)). The division of sub-
populations was based on age, given its role as an im-
portant risk factor in predicting sepsis cases (Li et al.,
2022). Besides the SIRS criteria, the dataset used did
not capture other risk factors. Therefore, age and the
SIRS criteria were considered the most important risk
factors for dividing the subpopulations. The subpop-
ulations are named and summarized in Table 1. The
first column lists the subpopulations, while the first
row explains the criteria that define each subpopu-
lation. For instance, the subpopulation that includes
patients aged 65 and below is now labelled as Age
A, and the subpopulation with patients who meet less
than two SIRS criteria is called SIRS A. The nomen-
clature for the remaining subpopulations follows the
same pattern.
Please note that the duration of a treatment process
is not given beforehand and needs to be calculated.
This duration is classified into two categories: Dura-
tion A, which denotes a treatment process that takes
less than or equal 7 days, and Duration B, which de-
notes a process that takes more than 7 days. The du-
ration is determined by considering the time when an
activity starts or ends, but there is no single unit of
time for all activities, and therefore, the total duration
cannot be assumed. However, the duration can be cal-
culated by finding the difference between the starting
and ending times of the treatment process.
The recorded patient data has an average age of
70.07. In order to create subpopulations of roughly
equal size, the event log is divided at the ages of 65
and 85, resulting in three subpopulations. The first
subpopulation, Age A, includes process traces of pa-
tients who are 65 years old or below. The second sub-
population, Age B, includes patients who are between
65 and 85 years old. The third subpopulation, Age C,
includes patients who are 85 or older.
In the United States, over half of the patients in the
Intensive Care Unit are over 65 years old, and many
suffer from life-threatening sepsis (Starr and Saito,
2014). Therefore, the age of 65 is used as a thresh-
old for the first and second subpopulations.
Since the SIRS criteria can only be true or false,
the dataset is divided into two cubes. The first sub-
population, SIRS-A, includes patients who meet 0 or
1 SIRS criteria. The second subpopulation, SIRS-B,
includes patients who meet 2 or more SIRS criteria.
ICEIS 2024 - 26th International Conference on Enterprise Information Systems
88

Table 1: Division of subpopulations.
Label Age (years) SIRS criteria ≥ 2 Process duration (days)
Subpopulation A ≤ 65 False ≤ 7
Subpopulation B 65 < age < 85 True > 7
Subpopulation C ≥ 85 n/a n/a
4.2 Comparison Tools
We utilized the BPMNDiffViz tool to compare the pro-
cess models. This tool offers structural matching by
visualizing the differences between graphs and pro-
vides statistics to facilitate difference analysis (Dijk-
man et al., 2011). It computes the minimum graph
edit distance between two processes based on the
number of transformations required to change one
process into another using the event labels of activ-
ity nodes (Ivanov et al., 2015). Among other algo-
rithms, we chose the Tabu Search algorithm due to its
precise results and faster performance (Skobtsov and
Kalenkova, 2019).
We performed conformance checking by compar-
ing the percentage of total traces that perform a spe-
cific activity within a subpopulation. This analysis
revealed which subpopulation is most likely to follow
a particular activity.
4.3 Comparison of Treatment Processes
The comparison was based on the attribute by which
each subpopulation was segmented. We also con-
ducted a detailed analysis of certain activities within
the process models and compared them for confor-
mance. All the models were created using ProM and
the BPMNDiffViz tools and were saved on an online
data repository
1
. Next, we will discuss the main find-
ings of our analysis.
4.3.1 General Observations
In general, the process models consist of 12 to 16
activities, with most models containing either 14 or
16 activities. In all models, ER Registration and ER
Triage occur at the beginning in parallel. The activ-
ities that describe the patient discharge (Release Ac-
tivities A, B, C, D, E) are typically found at the end
of the treatment event(s). Only the activity Return-
ER occurs after a patient has been discharged in any
form.
Of all patients, 63.8% go through Release-A,
while Release B, C, D, and E combined are followed
by only approximately 5.5% of all patients. This also
1
this url will be made available upon acceptance
SIRS < 2
SIRS ≥ 2
≤ 7 days
> 7 days
≤ 65
65 < age < 84
≥ 84
100%
200%
300%
400%
500%
600%
77.7%
336.7%
92.2%
491%
273.1%
346%
308.9%
80.2%
346.8%
93.4%
517.9%
282.3%
369.8%
307.6%
Percentage of traces within subpopulation
performing specified event
CRP
Leucocytes
Figure 2: Conformance checking activity comparison for
CRP and Leucocytes.
implies that the patients not covered by those statis-
tics did not finish the process, for example, because
they were still in the hospital. The activities CRP (i.e.,
c-reactive protein level checking a blood sample) and
Leucocytes are the most frequently accessed activities
in all processes, often occurring more than once in a
single process.
To compare the process models of subpopulations,
we calculate the Graph Edit Distance (GED). This
metric indicates the transformations required to con-
vert one process model into another. We have pre-
sented the results of these comparisons in Table 2.
Furthermore, we have analyzed the number of traces
following the events related to leucocytes and CRP.
To analyze this, we use a metric called the number of
traces, which is the total number of occurrences of an
event by a subpopulation divided by the total number
of patients in that subpopulation. As some events oc-
cur multiple times within one process, the resulting
percentages may exceed 100%. We have visualized
the values of all processes for CRP and leucocytes in
Figure 2.
Compared to most diseases, patients with sepsis
have higher mortality and readmission rates (Mans
et al., 2008). Therefore, in this study, we focus on
the discharge activity and the readmission of patients
to the ER for different subpopulations. For illustra-
tion purposes, we analyze the process traces follow-
ing Release-A and Return-ER using the metric, num-
Analyzing Sepsis Treatment Variations in Subpopulations with Process Mining
89
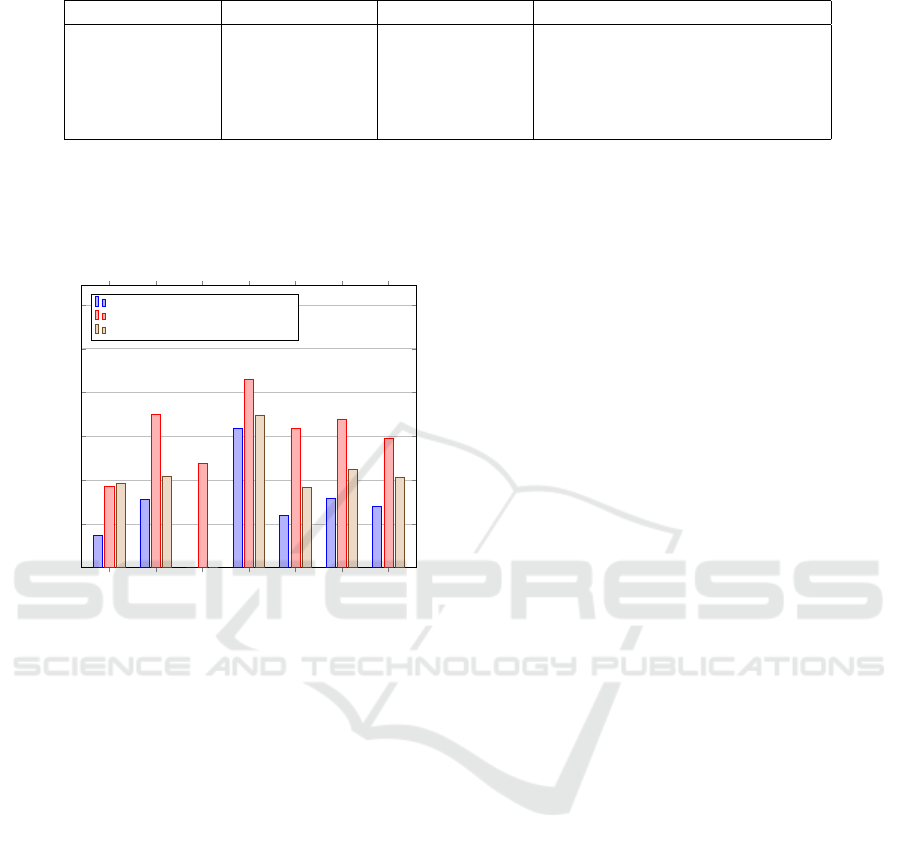
Table 2: GEDs retrieved by comparing process models.
Attribute Subpopulation 1 Subpopulation 2 Number of edits (transformations)
Age ≤ 65 65 < age < 85 72
Age ≤ 65 ≥ 85 42
Age 65 < age < 85 ≥ 85 60
SIRS criteria ≥ 2 < 2 58
Process duration ≤ 7 days > 7 days 98
ber of traces, as described in the previous section. We
also compare the number of traces following Release-
A that eventually lead to readmission to the ER across
different subpopulations. Figure 3 visualizes our re-
sults.
SIRS < 2
SIRS ≥ 2
≤ 7 days
> 7 days
≤ 65
65 < age < 84
≥ 84
0%
20%
40%
60%
80%
100%
120%
14.7%
31.1%
0%
63.5%
23.7%
31.8%
28%
37.1%
70.1%
47.7%
85.9%
63.7%
67.9%
59.2%
38.4%
41.6%
0%
69.8%
36.7%
44.9%
41.1%
Percentage of traces within subpopulation
performing specified event
Return-ER
Release-A
Percentage of Release-A returning to ER
Figure 3: Conformance checking activity comparison for
Release-A and Return-ER.
4.3.2 Age
The age attribute segments the data into three distinct
subpopulations, each represented by its own model.
Figure 4 includes the model comparing subpopula-
tions Age A (≤ 65)and Age B (65 < age < 85), which
resulted in a GED score of 72.
When comparing processes for individuals aged
≤ 65 to those aged between 65 and 85, a GED of
72 suggests a notable difference between the two pro-
cesses. This suggests that the processes for these two
age groups are considerably different. For individ-
uals aged ≤ 65 compared to those aged ≥ 85, the
GED is 42. This is somewhat counterintuitive, as one
might expect a larger difference between the youngest
and oldest age groups. However, the processes for
these two age groups are more similar than the pre-
vious comparison. The processes for the age groups
65 < age < 85 and ≥ 85 have a GED of 60, indicating
a moderate difference between the two processes.
Figure 5 shows a segment of the process model
for subpopulation Age A, where Leucocytes and CRP
are the most commonly accessed activities. In Age
A, the activity of Leucocytes has been performed in
282.30%, and CRP 273.1% of the time, as indicated
in Figure 2. For Age B, CRP has been performed
346% of the time and Leucocytes 369.8% of the time.
Finally, for Age C, CRP has been performed 308.9%
of the time and Leucocytes 307.6% of the time.
When comparing the three models’ patient dis-
charge strategies, the most significant differences are
observed between Age A and Age B. In Release-A,
the highest number of traces following the events are
associated with ‘Age >65 and <85’ for both Returns
to the ER and Overall Return ER events. Age C fol-
lows closely for both ER events. Conversely, Age A
has the lowest rate of return to the ER among the three
age groups.
4.3.3 SIRS Criteria
The GED, resulting from the comparison of two mod-
els, (a) ‘SIRS < 2’ and (b) ‘SIRS ≥2’, is denoted as
SIRS-A and SIRS-B, respectively. The processes for
individuals with SIRS criteria ≥ 2 compared to those
with < 2 have a GED of 58. This suggests a moderate
difference between the processes for these two groups
based on the SIRS criteria.
Upon examining the SIRS-A subpopulation, we
observed that the mean number of included classes is
6, while for SIRS-B, it is 10. Thus, it can be con-
cluded that the processes of patients for whom the
SIRS criteria is higher than 2 include a larger num-
ber of different events overall.
In comparison to other subpopulations, the occur-
rences of CRP and Leucocytes in SIRS-A are lower,
with events occurring in 78.2% and 80.7% of traces,
respectively. However, for ‘SIRS > 2’, CRP events
appear in 336.7% of traces, and Leucocytes events in
346.8%.
For patients in SIRS-B, 70.1% were discharged
through Release-A, of which 41.6% returned to the
ER. In the whole subpopulation, 31.1% returned to
the ER. In both SIRS-A and SIRS-B subpopulations,
all patients returning to the ER had been admitted to
the NC earlier in their treatment.
ICEIS 2024 - 26th International Conference on Enterprise Information Systems
90
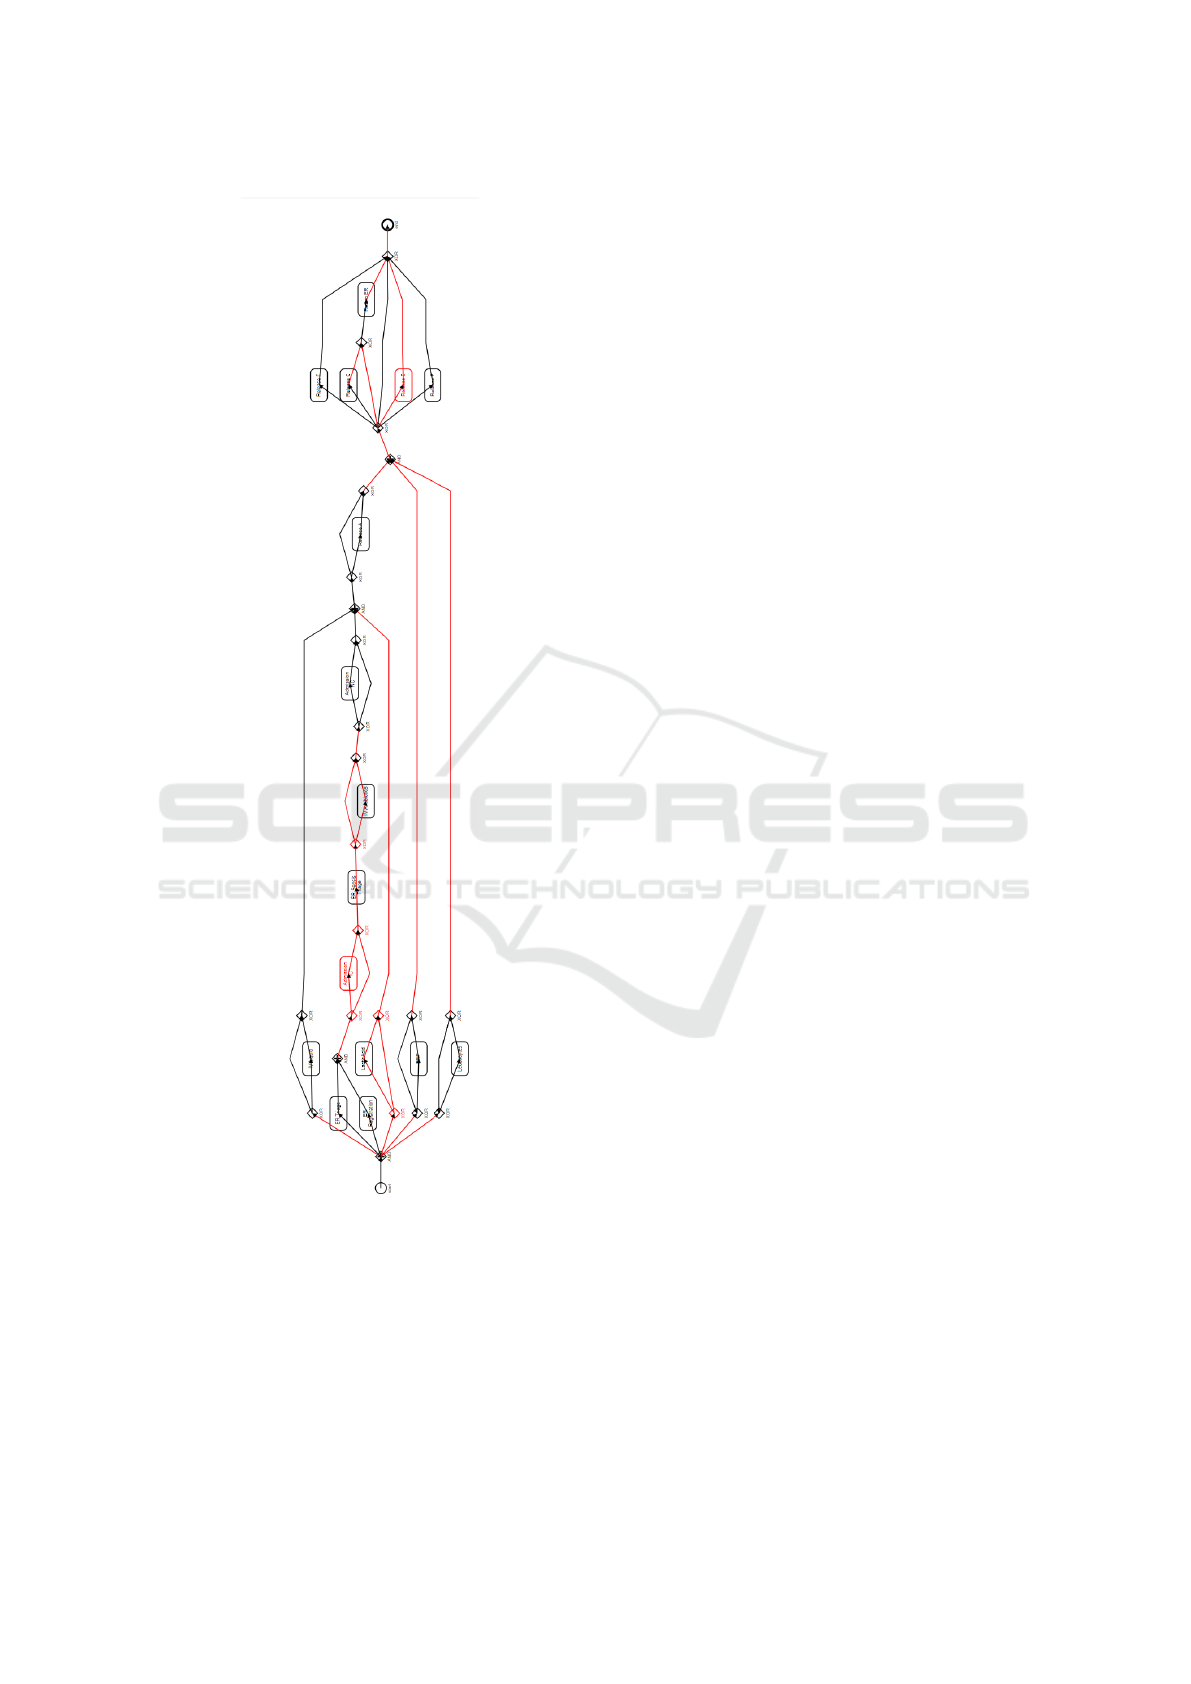
Figure 4: Comparison between process models of subpop-
ulations A and B. Red lines highlight events that need re-
moval to transform one model to the other, while black
lines denote identical events. Further comparison models
are available in an online data repository
1
.
4.3.4 Process Duration
The comparison between processes with a duration of
≤ 7 days and those with a duration of > 7 days yields
the highest GED of 98. This indicates a significant
difference between the processes of these two groups.
It suggests that the duration of the process has a sub-
stantial impact on the process model. However, it is
worth noting that the maximum number of activities
included in the two models differs. Treatments with
a duration of less than or equal to a week include 12
different activities, while longer treatments include all
16 kinds of activities. ER returns are not included
in shorter treatments, implying that no returns occur
within the same week as a patient’s hospital admis-
sion. Notably, the minimum time between admission
and return is 7 days and 11 hours. On average, pa-
tients return after 91 days.
4.3.5 Concluding Remarks
The attribute with the most pronounced impact on
process differences, as indicated by the GED, is ‘Pro-
cess duration’. Processes that last ≤ 7 days are con-
siderably different from those lasting > 7 days. Age
also plays a role in process differences, but the rela-
tionship is not linear. The processes for the youngest
and oldest age groups are more similar than the pro-
cesses for the youngest and middle age groups. The
SIRS criteria also influence process differences but to
a lesser extent than age and process duration.
In conclusion, this analysis provides insights into
how different attributes influence process models.
Such findings can be crucial for tailoring interven-
tions or strategies specific to subpopulations based on
these attributes.
5 DISCUSSION
While our preliminary research aimed to understand
sepsis and its treatment, the involvement of medi-
cal experts would have enhanced the identification of
treatment peculiarities. Collaboration with a hospi-
tal would have enabled a more detailed assessment
of treatment processes, verification of our results, and
ensured patient safety. Furthermore, we propose to
enhance the discussion by incorporating interpreta-
tions provided by a medical professional. This has
the potential to increase the depth of the findings and
their applicability in real-world clinical contexts.
We used data from various sepsis treatment events
within a hospital. However, the one-time assessment
of attributes like age, blood rates, and diagnoses lim-
ited our ability to perform a detailed analysis of these
differences during treatment. Anonymizing attributes
in the dataset, such as patient gender, could have pro-
vided richer data and deeper insights, especially re-
garding processes leading to death due to the high
Analyzing Sepsis Treatment Variations in Subpopulations with Process Mining
91
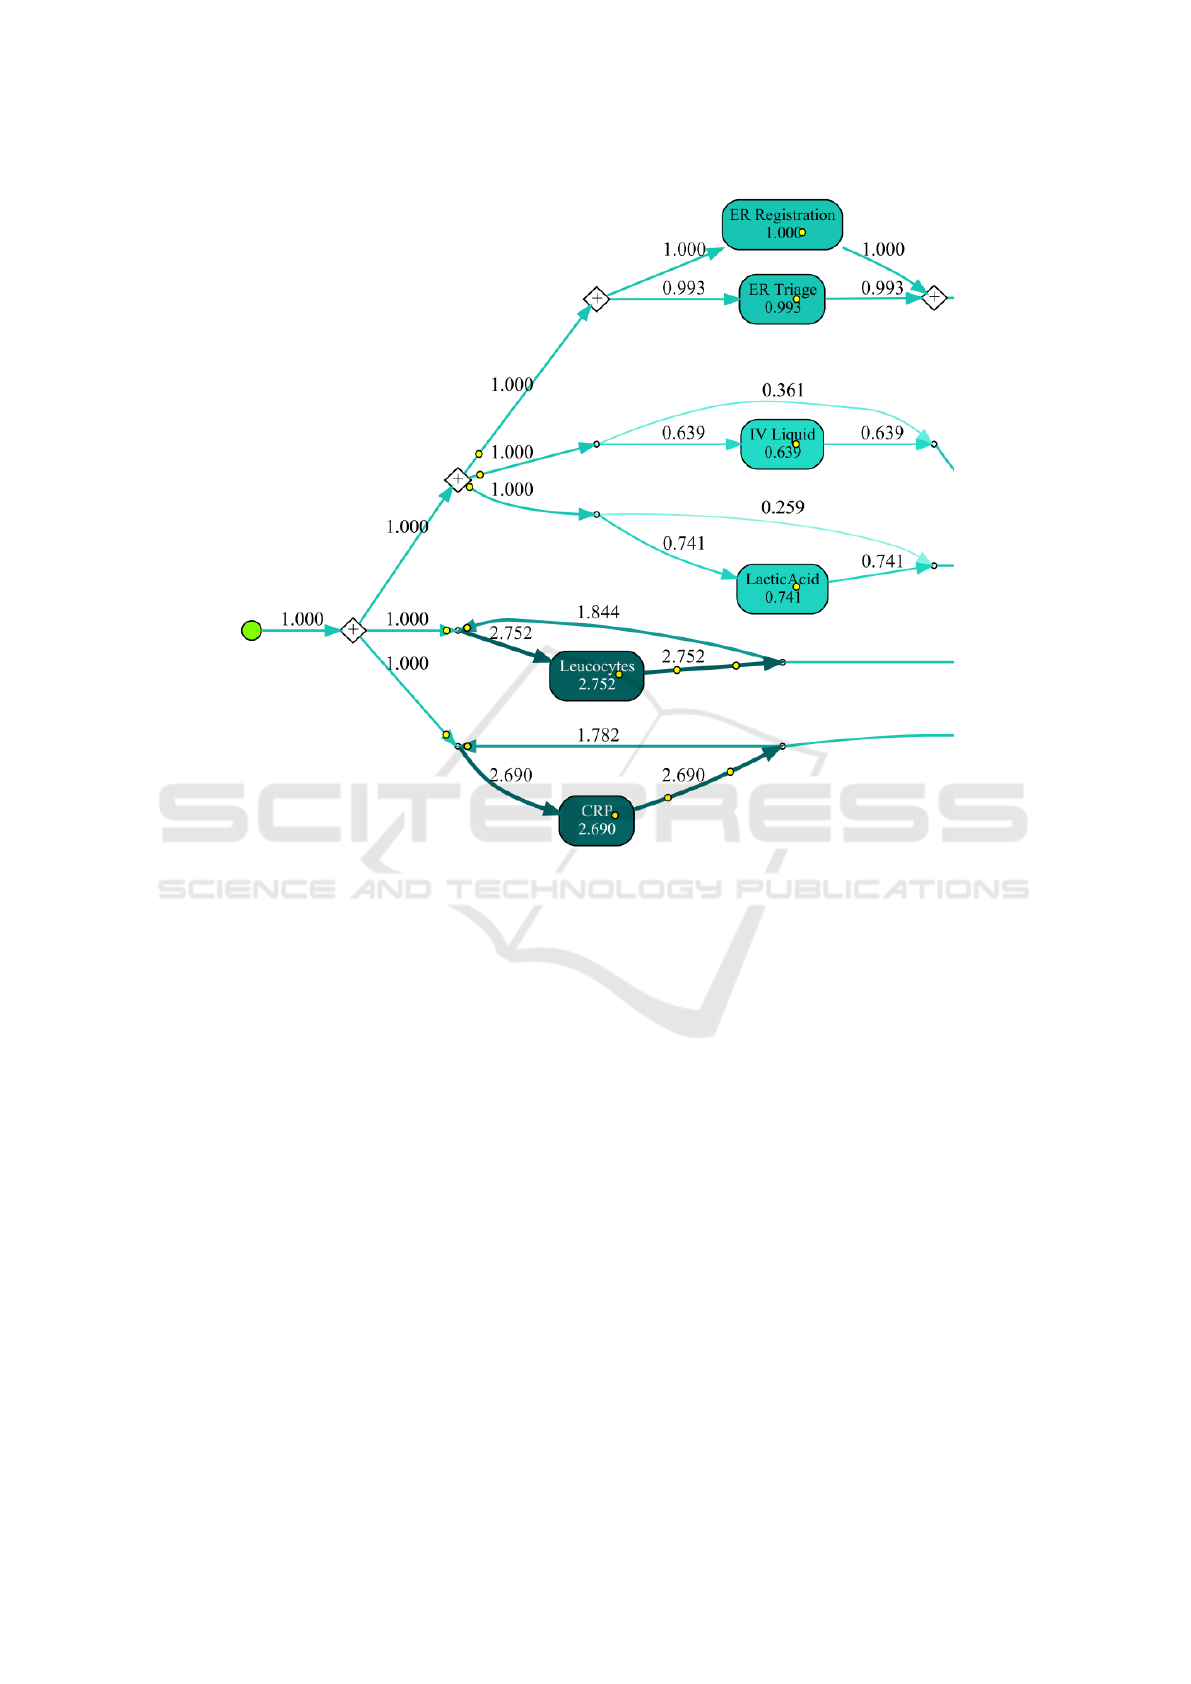
Figure 5: Process model abstraction of patients with age ≤ 65, using the Inductive Visual Miner (IvM) plugin. The complete
process model and other models are available online
1
.
mortality rate of sepsis. Furthermore, other features
not included in the dataset (e.g., history or genetics)
could also contribute to a more comprehensive result.
In this study, we did not explore the generalizability
of our findings or their applicability in other hospi-
tals or for other sicknesses. Potential biases associ-
ated with the specific undisclosed hospital might have
influenced the data. Nonetheless, our study highlights
the feasibility of comparing process models within a
hospital setting using GED and conformance metrics.
In our study, the metrics employed for compari-
son yield initial insights. Key to these insights is the
utilization of the GED via BPMNDiffViz. The integra-
tion of BPMNDiffViz in GED computations facilitates
visualization and discernment of the inherent struc-
tural variances between process models. This gains
prominence in the context of subpopulation analyses,
enabling a granular juxtaposition of process naviga-
tional patterns across varied groups. Additionally, the
derivation of conformance metrics, anchored on the
frequency of event execution by subpopulations, pro-
vides a lens to evaluate the alignment of these cohorts
with established process models. While these metrics
are useful, their role in comparing models across dif-
ferent subpopulations needs more research.
6 CONCLUSIONS AND FUTURE
RESEARCH
In this study, we aimed to explore the challenge of
contrasting subpopulations within healthcare treat-
ment processes. Our focus was on sepsis, a condition
characterized by a multitude of treatment procedures.
We applied the PM
2
HC methodology to a case study
using real-world data.
Our investigation focused on the treatment trajec-
tories of patients, taking into account factors such as
age, severity, and SIRS criteria. Our findings revealed
that distinct treatment processes were required for dif-
ferent age groups. Furthermore, we found that seg-
menting patients into two groups based on a duration
threshold of seven days was beneficial for contrast-
ing subpopulations. A notable correlation was iden-
ICEIS 2024 - 26th International Conference on Enterprise Information Systems
92

tified between age group division and SIRS score,
with the middle-aged subpopulation engaging in the
most activities. The transformation from the pro-
cess model for Age A to Age C required only 42
edits. In contrast, patients who met the SIRS-B cri-
teria participated in approximately double the activi-
ties per patient compared to those in SIRS-A. In the
subpopulation exceeding a seven-day duration, activi-
ties related to leukocytes, CRP, return-ER, and patient
discharge were most prevalent. Our results suggest
that treatment processes tailored to patient subpopula-
tions based on age, severity, and SIRS criteria provide
unique and promising insights.
Future studies should conduct an in-depth inves-
tigation of the performance of various subpopula-
tions. This investigation could include both threshold
and time-series analysis. Comparing outcomes across
these subpopulations and benchmarking them against
normative models of other healthcare providers could
provide valuable insights. Furthermore, collaborative
initiatives with hospitals to collect treatment data or
explore challenges in the treatment process could en-
hance our understanding of the implications of this
study. The conformance measures used in this study
also warrant further scrutiny to validate their effec-
tiveness. Lastly, we advocate for additional case stud-
ies on healthcare-related topics that employ compara-
tive subpopulation analysis. The goal of these studies
would be to generalize the implications of our find-
ings to other hospitals and healthcare systems.
REFERENCES
Comstedt, P., Storgaard, M., and Lassen, A. T. (2009). The
Systemic Inflammatory Response Syndrome (SIRS)
in acutely hospitalised medical patients: a cohort
study. Scandinavian journal of trauma, resuscitation
and emergency medicine, 17:67.
Dallagassa, M. R., dos Santos Garcia, C., Scalabrin, E. E.,
Ioshii, S. O., and Carvalho, D. R. (2021). Oppor-
tunities and challenges for applying process mining
in healthcare: a systematic mapping study. Journal
of Ambient Intelligence and Humanized Computing,
pages 1–18.
Dijkman, R., Dumas, M., van Dongen, B., K
¨
a
¨
arik, R., and
Mendling, J. (2011). Similarity of business process
models: Metrics and evaluation. Information Systems,
36(2):498–516.
Gyawali, B., Ramakrishna, K., and Dhamoon, A. (2019).
Sepsis: The evolution in definition, pathophysi-
ology, and management. SAGE Open Medicine,
7:2050312119835043.
Hendricks, R. M. (2019). Process mining of incoming pa-
tients with sepsis. Online Journal of Public Health
Informatics, 11(2):224–36.
Ivanov, S. Y., Kalenkova, A. A., and van der Aalst, W.
M. P. (2015). BPMNDiffViz: a tool for BPMN mod-
els comparison. In Proceedings of the Demo Ses-
sion of the 13th International Conference on Business
Process Management, CEUR Workshop Proceedings,
pages 35–39.
Li, M., Huang, P., Xu, W., Zhou, Z., Xie, Y., Chen, C.,
Jiang, Y., Cui, G., Zhao, Q., and Wang, R. (2022).
Risk factors and a prediction model for sepsis: A mul-
ticenter retrospective study in china. Journal of Inten-
sive Medicine, 2(3):183–188.
Mamaliga, T. (2013). Realizing a process cube allowing
for the comparison of event data. Master’s thesis, TU
Eindhoven.
Mannhardt, F. (2016). UMass sepsis cases - event log.
Mannhardt, F. and Blinde, D. (2017). Analyzing the trajec-
tories of patients with sepsis using process mining. In
RADAR+ EMISA 2017, pages 72–80. CEUR-ws. org.
Mans, R., Schonenberg, H., Leonardi, G., Panzarasa, S.,
Cavallini, A., Quaglini, S., and van der Aalst, W. M. P.
(2008). Process mining techniques: an application to
stroke care. In Studies in Health Technology and In-
formatics, volume 136, pages 573–8.
Mans, R. S., van der Aalst, W. M. P., and Vanwersch, R.
J. B. (2013). Process mining in healthcare: opportu-
nities beyond the ordinary, volume 1326 of BPM re-
ports. BPMcenter. org.
Mans, R. S., van der Aalst, W. M. P., and Vanwersch, R.
J. B. (2015). Process mining in healthcare: evaluat-
ing and exploiting operational healthcare processes.
Springer.
Marazza, F., Bukhsh, F. A., Geerdink, J., Vijlbrief, O.,
Pathak, S., van Keulen, M., and Seifert, C. (2020).
Automatic process comparison for subpopulations:
Application in cancer care. International Journal of
Environmental Research and Public Health, 17(16).
Martin, G. S., Mannino, D. M., and Moss, M. (2006). The
effect of age on the development and outcome of adult
sepsis. Critical Care Medicine, 34(1):15–21.
Munoz-Gama, J., Martin, N., Fernandez-Llatas, C., John-
son, O. A., Sep
´
ulveda, M., Helm, E., Galvez-Yanjari,
V., Rojas, E., Martinez-Millana, A., Aloini, D., Aman-
tea, I. A., Andrews, R., Arias, M., Beerepoot, I.,
Benevento, E., Burattin, A., Capurro, D., Carmona,
J., Comuzzi, M., Dalmas, B., de la Fuente, R.,
Di Francescomarino, C., Di Ciccio, C., Gatta, R.,
Ghidini, C., Gonzalez-Lopez, F., Ibanez-Sanchez, G.,
Klasky, H. B., Prima Kurniati, A., Lu, X., Mannhardt,
F., Mans, R., Marcos, M., Medeiros de Carvalho,
R., Pegoraro, M., Poon, S. K., Pufahl, L., Reijers,
H. A., Remy, S., Rinderle-Ma, S., Sacchi, L., Seoane,
F., Song, M., Stefanini, A., Sulis, E., Ter Hofst-
ede, A. H. M., Toussaint, P. J., Traver, V., Valero-
Ramon, Z., Weerd, I., van der Aalst, W. M. P., Van-
wersch, R., Weske, M., Wynn, M. T., and Zerbato, F.
(2022). Process mining for healthcare: Characteristics
and challenges. Journal of Biomedical Informatics,
127:103994.
Partington, A., Wynn, M., Suriadi, S., Ouyang, C., and
Karnon, J. (2015). Process mining for clinical pro-
cesses: A comparative analysis of four australian hos-
Analyzing Sepsis Treatment Variations in Subpopulations with Process Mining
93

pitals. ACM Transactions on Management Informa-
tion Systems, 5(4).
Pereira, G. B., Santos, E. A. P., and Maceno, M. M. C.
(2020). Process mining project methodology in
healthcare: a case study in a tertiary hospital. Network
Modeling Analysis in Health Informatics and Bioin-
formatics, 9.
Polat, G., Ugan, R. A., Cadirci, E., and Halici, Z. (2017).
Sepsis and septic shock: Current treatment strate-
gies and new approaches. The Eurasian journal of
medicine, 49(1):53–58.
Quintano Neira, R. A., Hompes, B. F. A., de Vries, J. G. J.,
Mazza, B. F., Sim
˜
oes de Almeida, S. L., Stretton, E.,
Buijs, J. C. A. M., and Hamacher, S. (2019). Anal-
ysis and optimization of a sepsis clinical pathway us-
ing process mining. In Business Process Management
Workshops, pages 459–470. Springer.
Samraj, R., Zingarelli, B., and Wong, H. (2013). Role of
biomarkers in sepsis care. Shock, 40(5):358–365.
Skobtsov, A. and Kalenkova, A. (2019). Efficient algo-
rithms for finding differences between process mod-
els. In 2019 Ivannikov Ispras Open Conference (IS-
PRAS), pages 60–66.
Starr, M. and Saito, H. (2014). Sepsis in old age: Re-
view of human and animal studies. Aging and disease,
5(2):126–136.
van Dongen, B. F., de Medeiros, A. K. A., Verbeek, H.
M. W., Weijters, A. J. M. M., and van der Aalst, W.
M. P. (2005). The ProM framework: A new era in
process mining tool support. In Applications and The-
ory of Petri Nets 2005, pages 444–454, Berlin, Hei-
delberg. Springer.
van Eck, M. L., Lu, X., Leemans, S. J. J., and van der
Aalst, W. M. P. (2015). PM
2
: a process mining project
methodology. In International conference on ad-
vanced information systems engineering, pages 297–
313. Springer.
ICEIS 2024 - 26th International Conference on Enterprise Information Systems
94
