
Impact of Team Formation Type on Students’ Performance in
PBL-Based Software Engineering Education
J
´
essyka Vilela
a
, Simone C. dos Santos
b
and Davi Maia
c
Centro de Inform
´
atica, Universidade Federal de Pernambuco (UFPE),
Av. Jornalista An
´
ıbal Fernandes, s/n – Cidade Universit
´
aria, Recife-PE, Brazil
Keywords:
Requirements Engineering Education, Team Formation, Performance Assessment, Impact, Problem-Based
Learning, Software Engineering.
Abstract:
In Requirements Engineering (RE) Courses, it is a common teaching practice to adopt a Problem-Based Learn-
ing (PBL) approach in which the students are divided into teams to solve problems. These teams can be defined
according to different criteria and evaluated using performance assessment models. This paper investigates
the impact of team formation type on students’ performance in PBL-based software engineering education in
RE courses. The study analyzes 25 teams across five postgraduate RE courses conducted in 2022 and 2023
using a mixed approach (qualitative and quantitative). In three of these courses, the students self-selected
the teams (S); in the other two, a team formation method (TFM) was used. We analyzed how performance
assessment results and project scores differ between self-selected and TFM-formed teams. We also explored
how performance in some soft skills varies between assessments or team formation methods. The difference
in average performance between S and TFM teams is statistically significant. We cannot conclude that there is
a statistically significant difference in grades between the S and TFM teams. Interestingly, we also observed
that the impact of the type of team formation is relatively stable, regardless of the assessment over time.
1 INTRODUCTION
Software engineering (SE) education has faced sig-
nificant challenges over the past two decades (Oguz
and Oguz, 2019). The very nature of software, in-
tangible and dynamic, almost always associated with
business processes that undergo constant change, de-
mands much more for good practices than for theo-
retical foundations as in other computing disciplines
(Kruchten, 2004). This characteristic brings to the
software engineer the need to learn techniques, mod-
els, software design, and implementation methodolo-
gies and develop skills associated with human factors
(generally called soft skills), such as business under-
standing, communication, and teamwork (Matturro
et al., 2015).
To develop these skills, students are generally
involved in practical projects in software engineer-
ing courses and disciplines. The more authentic
these projects can be, the more students will learn.
Thus, active approaches such as Problem-Based
a
https://orcid.org/0000-0002-5541-5188
b
https://orcid.org/0000-0002-7903-9981
c
https://orcid.org/0009-0007-7144-8020
Learning, Project-Based Learning (PBL) (Kolmos,
2009), Team-Based Learning (TBL) (Sisk, 2011),
and Challenge-Based Learning (CBL) (Gibson et al.,
2018) have been used to reduce the gap between
learning in academia and the demands of the la-
bor market. When dealing with authentic problems
and projects of relevant complexity, students will in-
evitably need to carry out collaborative work, being
organized into teams. Therefore, group work is essen-
tial in active approaches based on real-world problem-
solving practices. In this context, the team formation
process can significantly impact the learning process,
the social behavior of team members, and the team’s
overall performance. Motivated by this context, this
study sought answers to the following central research
question: RQ: How does team formation impact stu-
dent performance in PBL-based software engineering
education?
To better understand this issue, it is crucial to
understand the team formation process. Teams can
be formed considering different strategies, from self-
selection, when students define their teams without
any external intervention, to the use of tools based
on algorithms for automatic team formation ((Løvold
Vilela, J., Santos, S. and Maia, D.
Impact of Team Formation Type on Students’ Performance in PBL-Based Software Engineering Education.
DOI: 10.5220/0012605800003693
Paper published under CC license (CC BY-NC-ND 4.0)
In Proceedings of the 16th International Conference on Computer Supported Education (CSEDU 2024) - Volume 2, pages 327-338
ISBN: 978-989-758-697-2; ISSN: 2184-5026
Proceedings Copyright © 2024 by SCITEPRESS – Science and Technology Publications, Lda.
327

et al., 2020). Other examples are random forma-
tion (Bastarrica et al., 2023), based on the definition
of team members’ roles, using Kolb’s learning style
theory (Chen et al., 2011), by teachers’ preferences
(Løvold et al., 2020), using personality tests to match
team members (Løvold et al., 2020), or mixed ap-
proaches that use more than one strategy (dos San-
tos, 2023)(Maia et al., 2023). Despite the many pos-
sibilities, there is a lack of consensus on the most ef-
fective approach to improving learning outcomes and
students’ overall performance in teamwork (Løvold
et al., 2020).
Concerning student performance, teamwork in
software engineering education is generally based on
an assessment scheme from several aspects (Bastar-
rica et al., 2019)(Basholli et al., 2013), such as man-
agement of projects, product quality, and presenta-
tion of results. However, this scheme usually does
not consider variations in individual commitment and
technical contributions among team members since
grades are typically assigned collectively to the entire
team (Bastarrica et al., 2019).
To overcome this problem, peer assessment
(called coregulation) has been increasingly used to
evaluate teamwork (Basholli et al., 2013). The au-
thors argue that peer assessment is recognized as an
effective educational technique because it allows stu-
dents to critically reflect on the professionalism and
contribution of their team members in terms of per-
formance and behavior (Basholli et al., 2013).
A wide range of approaches and methods have
been suggested and explored in peer review (Basholli
et al., 2013). One of the methods is the performance
assessment of the PBL-SEE assessment model, pro-
posed by (Santos, 2016), which considers multiple
perspectives, combining self- and coregulation (Zim-
mermann, 2004).
Considering different team formation strategies
and the performance evaluation of the members of
this team, this article presents a comparative anal-
ysis between scenarios from real-world experiences
in teaching requirements engineering, based on 25
teams in five postgraduate courses in ES carried out
in 2022 and 2023. These experiments used the
PBL-SEE performance assessment model, adopting
two antagonistic team formation strategies: 1) self-
selection (S), in which students choose their teams,
and based on a team formation method (TFM), which
combines several strategies, defined in (dos Santos,
2023).
Focusing on obtaining answers to the central re-
search question, we sought to investigate the differ-
ences in performance results between self-selected
teams (S) and teams formed through systematic
method (Santos, 2016), bringing essential insights for
the decision-making of software engineering educa-
tors in the context of teamwork.
To report this research, this paper is organized into
five sections. In Section 2, we discuss the main meth-
ods and related works. Section 3 details the research
design and context of the five experiments. In Section
4, we provide answers to the central and secondary
research questions. Finally, in Section 5, we present
conclusions and future work.
2 BACKGROUND
2.1 Method of Team Formation
This study analyzes the impact of team formation
on the performance of its members. According to
(Parker, 1990), in teams, people interact with each
other to solve a problem or task; therefore, they share
the same objective. Complementing this definition,
(Salas et al., 1993) also emphasize that team members
have specific functions and are assigned according to
their capabilities.
Regarding the team formation process, (da Silva
et al., 2011) highlight several attributes that can be
considered based on a study that reveals what man-
agers consider when selecting members of a software
team.However, in the educational context, some of
these attributes may be more appropriate than oth-
ers, especially those related to the human aspects in-
volved, such as students’ interpersonal skills, behav-
ior, and personality.
Team formation can be carried out using different
approaches (Ounnas et al., 2007), criteria, and student
characteristics as highlighted by (Wessner and Pfister,
2001). For example, the teacher can form a team man-
ually or automatically by a system. The team can also
be homogeneous or heterogeneous, considering dif-
ferent characteristics of the students, or it can even
be a mixed group, considering both homogeneous
and heterogeneous characteristics. A team can also
consider the personal attributes of its members, such
as gender and individual capabilities (Ounnas et al.,
2007).
Again, reflecting the educational context, it is im-
portant to highlight how difficult it is to form the
”ideal” team so collaboration and expected learning
can effectively occur (Dillenbourg, 1999). Several
studies seek to evaluate the effect of different criteria
on team formation in this context, obtaining differ-
ent conclusions. (Manukyan et al., 2013) conclude
that homogeneous groups are better for spreading
knowledge in complex environments. (Wang et al.,
CSEDU 2024 - 16th International Conference on Computer Supported Education
328
2007) recommend forming heterogeneous groups in
this context, arguing that forming teams through a
systematic process obtained greater satisfaction and
collaboration from team members than randomly gen-
erated teams. In these studies, it is also possible to
verify that the effect of team formation can be differ-
ent for different tasks (Dillenbourg, 1999)(Manukyan
et al., 2013) (Wang et al., 2007).
A team formation method (TFM) for team build-
ing in the PBL approach, which can be applied to any
discipline in computing are presented by (dos San-
tos, 2023). The TFM suggest the formation of small
teams, on average 5 to 7 members, considering the
following attributes: age group, gender, personality,
and behavior (via MBTI – Myers-Briggs Type Indi-
cator), preferred skill in solving computing problems
(programming, modeling, or management), profes-
sional experience and affinities with other team mem-
bers.
Considering the premise of heterogeneous teams
and the balance between the teams, the team for-
mation criteria are defined: 1) rarer MBTI profiles
among the students in the class are distributed among
the teams; 2) considering the majority of male stu-
dents in STEM (Science, Engineering, Technology
and Mathematics) courses, other genders are also dis-
tributed among the teams; 3) preferred skills are bal-
anced between teams, as well as age group and pro-
fessional experience, valuing the diversity of these as-
pects; 4) all teams will have at least one member in-
dicated on each student’s affinity list. Based on these
criteria, a team formation process is applied, gener-
ating balanced teams. It is essential to highlight that
this systematic team formation was applied in some of
the experiences demonstrated in this study in contrast
to the team formation by the self-selection of the stu-
dents themselves to evaluate the impact of this train-
ing on the performance of soft and hard skills.
2.2 Students Performance and Team
Assessment
Evaluating student performance in courses that use
problems or projects is essential to team develop-
ment. Such assessments help the team understand
their strengths and areas for improvement, critically
analyzing where they can improve and what ways
they can follow to achieve improvement. A student
assessment model, called PBL-SEE, based on five
dimensions: content, process, performance, output,
and client satisfaction, which can be used to evaluate
teams in the context of real problems and projects, are
described by (Santos, 2016). In this model, the perfor-
mance refers to a subjective analysis of the student’s
interpersonal characteristics and Soft Skills. Table 1
presents the criteria used for this assessment and the
respective descriptions.
Table 1: Criteria used in the performance evaluation (San-
tos, 2016).
ID Criterion Description
SFI Self Initiative Able to identify and anticipate problems or
situations, seeking proactive solutions and
defending viewpoints with consistent argu-
ments.
CMT Commitment Meets deadlines of the work plan and com-
mitments assumed.
CLB Collaboration Cooperates with the work team and other
people in the organization to solve problems
and perform tasks. In other words, wears
the team’s and/or client’s shirt.
INV Innovation Demonstrates an entrepreneurial spirit
through creativity and innovation, identi-
fying opportunities for improvement and
adding value to the way of performing
activities.
COM Communication Expresses complex ideas, information, and
positions clearly and understandably, as
well as knows how to listen, ensuring accu-
racy and understanding of the subjects dis-
cussed.
LRN Learning Capable of identifying and raising hypothe-
ses about the problem, seeking to under-
stand and apply the necessary concepts to
its resolution.
PLN Planning Capable of planning actions and/or activi-
ties with the team, committing to the effec-
tive execution of the problem-solving pro-
cess.
EVL Evaluation Capable of analyzing and evaluating pos-
sible solution alternatives to the problem,
defending viewpoints with consistent argu-
ments.
Concerning conducting the assessment, the stu-
dents responded to a 360-degree evaluation in which
they assessed themselves and their teammates on a
scale of 1) Did not meet expectations, 2) Partially
met expectations, 3) Met expectations, 4) Exceeded
expectations, and 5) Surpassed expectations for each
of the criteria above. At the end of the criteria
evaluation, they are asked to present each member’s
strengths and areas for improvement. Finally, at the
end of the collections, performance reports are sent to
each team member containing the evaluation results
and their strengths and areas for improvement.
2.3 Related Work
Some results related to this study were found when
searching for references that help base the research
objective. In general, the relationship occurs in the
method of team formation, using performance assess-
Impact of Team Formation Type on Students’ Performance in PBL-Based Software Engineering Education
329
ment, or comparing the results of different teams.
The differences in performance between teams
formed by students and the teacher/instructor are as-
sessed by (Løvold et al., 2020). For this, the class was
divided into teams with a project following the course
of the discipline. A project performance evaluation
was used to evaluate the team situation, using student
reports and an individual technical knowledge assess-
ment.
Which informal roles arise in software teams is
aimed to be examined in the work of (Beranek et al.,
2005). For this, the class was divided into mixed
teams of 6 members who carried out a Software Engi-
neering project. As an evaluation method, this experi-
ence assessed technical knowledge using a five-point
scale and an assessment of behavior and teamwork
based on subjective feedback.
The student’s perspective on evaluating the team
project in a CS course is investigated by(Tafliovich
et al., 2015). For this, the class was divided into teams
formed by the students and created by the teacher,
who carried out projects in three disciplines. A five-
point assessment covering hard and soft skills was
used as an evaluation method. Our study is similar
to the work of their work, but it takes a more holistic
approach to student performance, covering both tech-
nical abilities (hard skills) and interpersonal compe-
tencies (soft skills). Additionally, it introduces dis-
cussions in a new context, emphasizing the context-
dependence of qualitative research. This paves the
way for further analysis and reflections that can assist
decision-making in similar educational settings.
Finally, from five requirement engineering
courses, this study aims to evaluate whether there
are differences in performance, considering two
situations: when the students form the teams (self-
selection or S) and when the instructor forms the
teams using TFM (TFM-based or TFM).
For team formation by the teacher, we consid-
ered the team formation method (TFM) defined in
(dos Santos, 2023) and described in Section 2.1. The
performance evaluation was based on the evaluation
model described in Section 2.2 (Santos, 2016) com-
bined with the assessment of the results of the partic-
ipating projects. The analysis also used the t-test to
verify the results’ significance.
3 RESEARCH METHOD
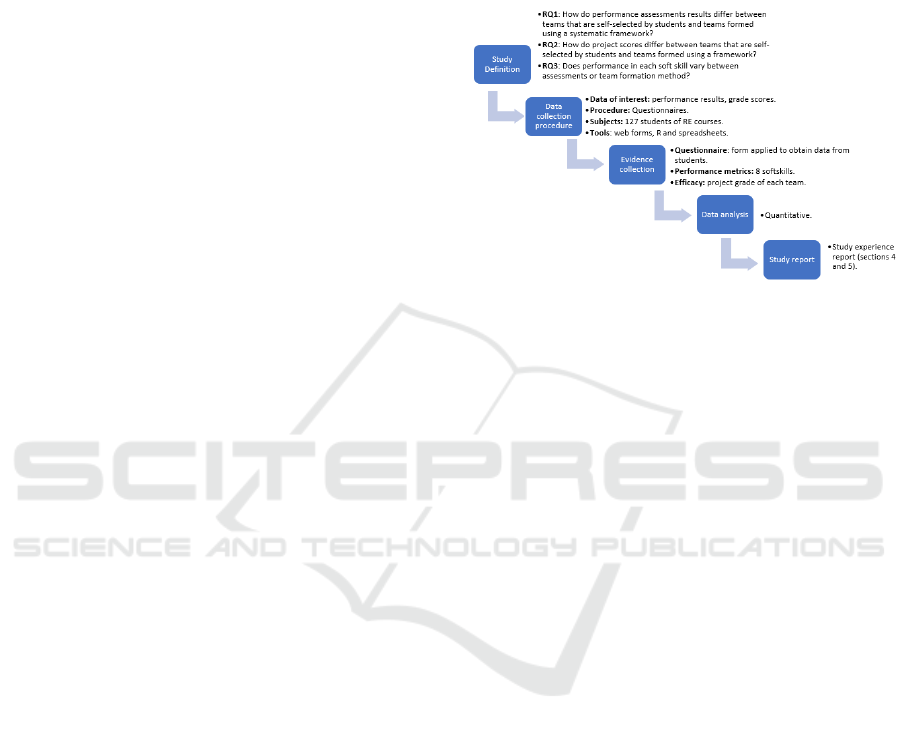
The methodology adopted in this paper is inspired by
the work of (Cadette et al., 2022). It comprises six
steps, as illustrated in Figure 1. To address the re-
search questions, we conducted a field experiment.
The study was organized into two cycles where five
courses were taught as described in Table 2. The units
of analysis included (1) three courses where the stu-
dents self-selected their teams and (2) two courses
where the TFM method (dos Santos, 2023) was ap-
plied.
Figure 1: Methodology for conducting the study (adapted
from (Cadette et al., 2022)).
3.1 Research Questions
As mentioned in the introduction section, this work is
guided by the following research question RQ: How
does team formation impact student performance in
PBL-based software engineering education?
We divided this RQ into three research questions:
RQ1: How do performance assessment results dif-
fer between teams that are self-selected by students
and teams formed using the TFM systematic method;
RQ2: How do project scores differ between teams that
are self-selected by students and teams formed using
TFM; and RQ3: Does performance in each soft skill
vary between assessments or team formation method?
To answer R1, we compared the performance
evaluation results of the courses where the teams were
self-selected (S) by the students versus the team for-
mation method (TFM) (dos Santos, 2023) and how
teams evolved in the second evaluation compared to
the first evaluation. In RQ2, we compared the project
scores among the S and F teams. To answer RQ3,
we performed a Mixed Effects Variance Analysis for
soft skills. This analysis examined if there is a differ-
ence in the average soft skills scores between the two
assessments and also if there is a difference in the av-
erage soft skills scores between the different types of
team formation.
3.2 Courses Description
This work intends to answer the research questions
based on the data collected from five RE Postgraduate
CSEDU 2024 - 16th International Conference on Computer Supported Education
330
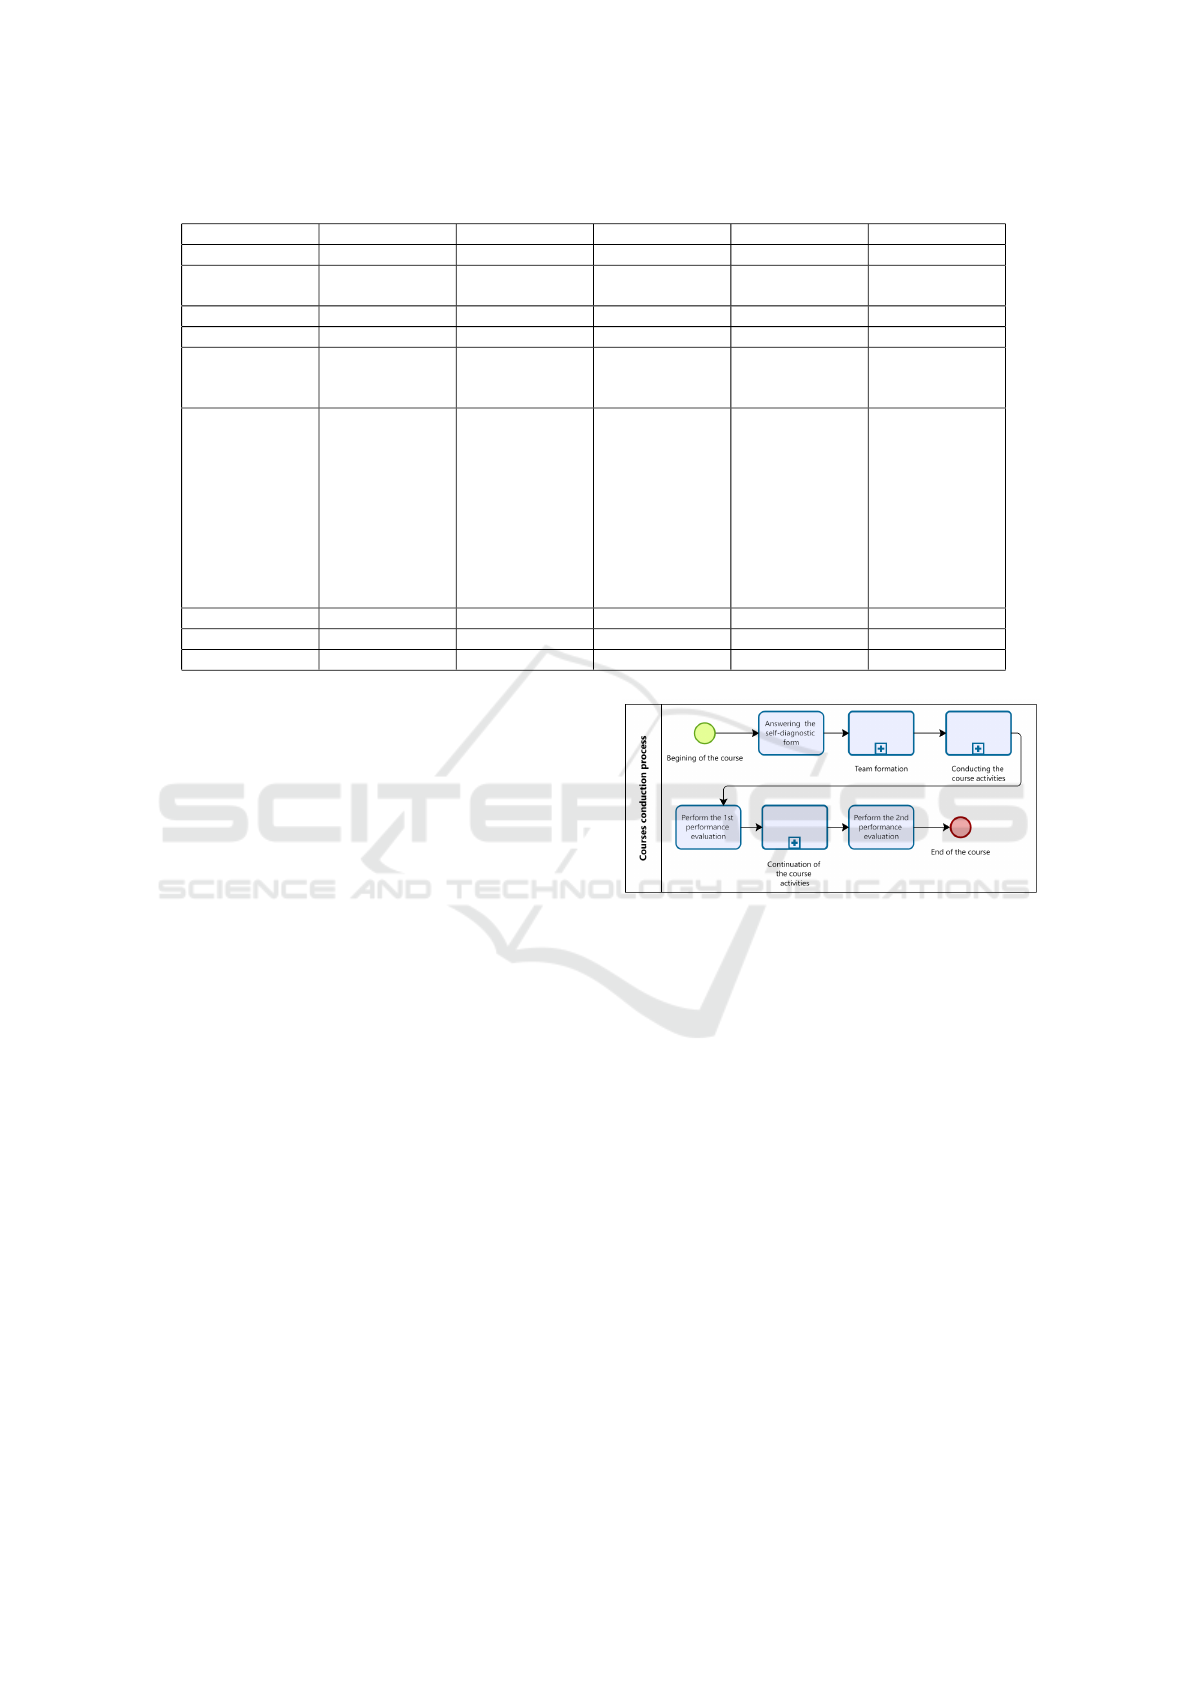
Table 2: Courses’ Information.
Course 1 Course 2 Course 3 Course 4 Course 5
Year 2022 2023 2022 2023 2023
Course focus Traditional RE Traditional RE Requirements for
Embedded Systems
Requirements for
Embedded Systems
Requirements for
Embedded Systems
Format In-person In-person Remote Remote Remote
Number of students 21 26 31 29 20
Number of teams
formed
3 teams of 5 people
and 1 team of 6 peo-
ple
4 teams of 5 people
and 1 team of 6 peo-
ple
5 teams of 5 people
and 1 team of 6 peo-
ple
5 teams of 5 people
and 1 team of 6 peo-
ple
4 teams of 5 people
Objectives of the
real-life projects
Asset Report Con-
solidation Tool,
Bus schedule man-
agement app with
integration to sub-
way, Supermarket
shopping list and
price research app,
Parking spot man-
agement app
Academy app,
Challenges faced by
Uber drivers with
the platform, Uni-
versity restaurant
app, Social media
app manager, Event
and cost manage-
ment system
Smart refrigerator,
Smart dishwasher,
Smart TV
Smart bread ma-
chine, Smart
dishwasher, Smart
coffee maker
Smart bread ma-
chine, Smart
dishwasher
Duration One week One week Two weeks Two weeks One week
Team formation Self-selected Self-selected Self-selected TFM TFM
Tutor No No No Yes No
courses, whose design is presented in Table 2. Our
goal in these courses was to focus on technical and
soft skills. An experience report of the dynamics of
this course is presented in (Vilela and Silva, 2023).
Activities and Responsibilities of the Student
Teams. The courses adopted a mixed approach in
which the students had theoretical classes and the op-
portunity to practice the topics in simulated projects
conducted in teams during the classes. In these
projects, students were required to elicit, analyze and
specify software requirements chosen by the team in
courses 1 and 2 or randomly assigned by the professor
in courses 3, 4, and 5. The classroom was divided into
teams, and students had dedicated time to work on the
project during the class. They could seek guidance
and clarification from the professor whenever needed.
3.3 Courses Conduction Process
In courses 4 and 5, where the professor assigned the
teams, we adopted the process illustrated in Figure
2. First, the students answered the self-diagnostic
form, and the professor formed the teams using the
TFM method of (dos Santos, 2023), and the students
started conducting the course activities. In the half
of the course, the first performance evaluation using
the framework of (Santos, 2016), the results were
shared with the students, the students continued the
course activities, and the second performance assess-
ment was performed at the end of the course.
In courses 1 and 2, the first setp of answering the
self-diagnostic form was not performed since the stu-
Figure 2: Courses conduction process.
dent self-selected the teams, and in course 3, the per-
formance assessment was only performed at the end
of the course. It is important to highlight that the
initiative of using real-life problems, adopt PBL, and
performance assessment is only of the professor, and
not of the institution.
3.4 Grading Schema
The professor determined the grade in each course
by considering multiple factors (partial deliveries,
requirements documents, performance assessments)
with distinct weights. The grading schema of all
classes considers performance assessment as 20% of
the final grade, and it consists of an average of indi-
vidual and team grades in the two evaluations. In four
out of the five courses, there were no tutors available.
Hence, only the professor supported the students and
assigned all the grades.
Impact of Team Formation Type on Students’ Performance in PBL-Based Software Engineering Education
331
3.5 Participants
This study relies on the data collected from 127 stu-
dents distributed in five courses. The professor was
the same across all courses investigated in this study
and in course #4, there was one tutor available.
Most of the students did not have prior experi-
ence in RE, software engineering, problem-solving or
team-oriented software development.
4 PERFORMANCE ASSESSMENT
RESULTS
This section is organized as follows: first, we provide
the performance assessment for each course and soft-
skill then we present an overview of the average of
Performance Assessment Results in both team forma-
tion types.
4.1 Course 1: Performance Assessment
Results
Two Performance Assessments were conducted in
this course (two cycles), and the results are presented
in Table 3. We followed the model of (Santos, 2016)
described in Section 2.2. Each team showed improve-
ments in the soft skills assessed, with team 3 standing
out for its significant overall growth. This suggests
a strong focus on developing skills and adapting to
learning needs. The areas of Innovation, Communica-
tion, and Planning showed the greatest improvements
in general, perhaps reflecting an emphasis on these
skills throughout the course. Regarding consistency,
team 1 consistently improved in almost all areas, al-
beit with smaller increments than team 3.
Table 3: Performance results of Course 1.
#team # cycle SFI CMT CLB INV COM LRN PLN EVL
1 1 4.32 4.52 4.44 4.20 4.12 4.12 4.36 4.28
1 2 4.44 4.28 4.36 4.40 4.32 4.44 4.24 4.44
2 1 4.04 4.28 4.08 3.84 4.00 3.88 3.88 3.92
2 2 4.12 4.32 4.36 4.08 4.16 4.20 4.12 4.16
3 1 3.70 4.03 4.08 3.56 3.98 3.93 3.79 4.08
3 2 4.40 4.48 4.53 4.48 4.58 4.54 4.57 4.49
4 1 4.34 4.47 4.49 4.22 4.45 4.42 4.36 4.52
4 2 4.36 4.62 4.70 4.47 4.52 4.47 4.67 4.56
Average 4.21 4.37 4.38 4.16 4.27 4.25 4.25 4.31
4.2 Course 2: Performance Assessment
Results
Two cycles of Performance Assessment were also
conducted in this course, as shown in Table 4. Course
2 showed a trend of significant improvements in soft
skills, especially notable in team 4. The focus ap-
pears to be on strategic and analytical development,
as evidenced by the growth in Planning and Assess-
ment. Consistency in skill development across teams
suggests an effective learning environment and an em-
phasis on continuous improvement of soft skills.
Table 4: Performance results of Course 2.
#team # cycle SFI CMT CLB INV COM LRN PLN EVL
1 1 4.72 4.72 4.76 4.64 4.68 4.80 4.76 4.68
1 2 4.84 4.88 4.80 4.76 4.80 4.92 4.96 4.88
2 1 4.02 3.85 4.02 3.78 3.90 3.90 3.88 3.82
2 2 3.92 4.00 3.98 3.93 3.87 3.87 3.82 3.90
3 1 4.32 4.56 4.40 4.36 4.12 4.52 4.20 4.28
3 2 4.36 4.48 4.52 4.40 4.16 4.52 4.32 4.56
4 1 4.68 4.64 4.84 4.36 4.48 4.40 4.48 4.68
4 2 5.00 5.00 4.96 4.96 5.00 5.00 5.00 5.00
5 1 4.56 4.64 4.60 4.64 4.52 4.64 4.68 4.68
5 2 4.80 4.84 4.76 4.84 4.76 4.92 4.80 4.88
Average 4.52 4.56 4.56 4.47 4.43 4.55 4.49 4.54
4.3 Course 3: Performance Assessment
Results
Only one performance assessment was conducted in
this course, as demonstrated in Table 5. Team 1 had
strong scores for Collaboration (4.60) and Commit-
ment (4.55), indicating good performance in team-
work and reliability. Team 2 presented lower scores
than the other teams, especially in Innovation (3.64)
and Communication (3.72), which may indicate areas
for development. Team 3 demonstrated exceptional
performance with very high scores in all areas, espe-
cially in Innovation (4.92) and Learning (4.96), stand-
ing out as the strongest team in terms of creativity and
learning skills.
Team 4 achieved consistent but moderate scores in
all areas, indicating a balanced performance but with
room for improvement. Team 5 had generally lower
scores, with the lowest scores in Innovation (3.50) and
Learning (3.60), suggesting specific areas for devel-
opment. Team 6 performed relatively well with con-
sistent and balanced scores across the board, although
without any exceptional areas of emphasis.
CSEDU 2024 - 16th International Conference on Computer Supported Education
332
Table 5: Performance results of Course 3.
#team # cycle SFI CMT CLB INV COM LRN PLN EVL
1 1 4.35 4.55 4.60 4.20 4.20 4.45 4.20 4.20
2 1 3.68 4.00 4.00 3.64 3.72 3.92 3.80 3.76
3 1 4.84 4.76 4.88 4.92 4.92 4.96 4.84 4.88
4 1 4.00 4.05 4.10 4.00 4.05 3.85 4.10 4.00
5 1 3.60 3.85 3.90 3.50 3.75 3.60 3.60 3.70
6 1 4.17 4.09 4.13 4.04 4.08 4.00 4.13 3.96
Average 4.11 4.22 4.27 4.05 4.12 4.13 4.11 4.08
4.4 Course 4: Performance Assessment
Results
Two performance assessments were performed in this
course as presented in Table 6. In course 4, while
most teams showed some level of improvement in
soft skills, team 2 stood out with the greatest over-
all growth. Team 4 also showed good development,
especially in creative and collaborative areas. On the
other hand, teams 5 and 6 struggled, with a notable
reduction in their skills, pointing to possible areas for
intervention or additional support.
Table 6: Performance results of Course 4.
#team # cycle SL CM CL I CC L P A
1 1 4.00 4.30 4.20 3.80 3.70 3.80 4.00 4.00
1 2 4.10 4.10 4.30 4.00 4.10 4.10 4.20 3.90
2 1 4.00 4.10 4.20 3.80 4.00 4.10 4.10 4.10
2 2 4.40 4.50 4.60 4.30 4.30 4.10 4.40 4.50
3 1 4.00 4.00 4.00 3.80 3.90 3.90 3.80 3.90
3 2 4.20 4.20 4.20 4.20 4.20 4.10 4.00 4.20
4 1 4.20 4.20 4.00 3.90 4.00 3.80 4.00 4.10
4 2 4.30 4.60 4.60 4.60 4.40 4.30 4.40 4.50
5 1 3.50 3.60 3.50 3.60 3.40 3.30 3.40 3.50
5 2 2.30 2.30 2.30 2.30 2.20 2.30 2.30 2.30
6 1 3.70 3.80 4.00 3.90 4.00 3.90 3.70 3.80
6 2 3.40 3.10 3.70 3.40 3.50 3.40 3.40 3.30
Average 3.84 3.90 3.97 3.80 3.81 3.76 3.81 3.84
4.5 Course 5: Performance Assessment
Results
Two cycles of performance assessment were also con-
ducted in this course, as shown in Table 7. In this
course, all teams showed improvements in the soft
skills assessed, with teams 1 and 2 standing out due
to their significant overall growth. Development was
particularly notable in skills such as Learning, As-
sessment, and Communication, reflecting a strong fo-
cus on these areas throughout the course.
4.6 Summary of Courses Performance
Table 8 presents the summary of performance as-
sessment results for both self-selected teams (S) and
Table 7: Performance results of Course 5.
#team # cycle SFI CMT CLB INV COM LRN PLN EVL
1 1 3.35 3.25 3.35 3.55 3.35 3.30 3.20 3.30
1 2 3.70 3.65 3.70 3.50 3.60 3.70 3.60 3.70
2 1 2.92 3.00 3.25 2.75 3.17 2.83 2.75 2.92
2 2 3.42 3.42 3.58 2.92 3.25 3.00 3.00 3.25
3 1 2.90 3.05 3.00 2.75 3.05 2.85 3.05 2.95
3 2 3.45 3.60 3.65 3.45 3.45 3.60 3.55 3.50
4 1 4.00 4.04 4.08 3.72 3.88 3.79 4.00 3.92
4 2 4.20 4.20 4.20 3.90 4.20 3.90 4.00 3.90
Average 3.49 3.53 3.60 3.32 3.49 3.37 3.39 3.43
method-formed teams (TFM), including the courses,
teams, 1st assessment score, 2nd assessment score,
the difference between the 1st and 2nd assessment
scores, and the average of first and second perfor-
mance scores. We did not include course 3 since only
one performance assessment was conducted.
Table 8: Performance Assessment Results.
Forma
tion
Course Team 1st 2nd Diff Average
S 1 1 4.33 4.33 0 4.33
S 1 2 3.99 4.19 0.2 4.09
S 1 3 3.89 4.51 0.62 4.2
S 1 4 4.41 4.55 0.14 4.48
S 2 5 4.72 4.86 0.14 4.79
S 2 6 3.9 3.91 0.01 3.9
S 2 7 4.36 4.44 0.08 4.4
S 2 8 4.57 4.99 0.42 4.78
S 2 9 4.68 4.84 0.16 4.76
F 4 10 4 4.12 0.12 4.06
F 4 11 4.06 4.42 0.36 4.24
F 4 12 3.92 4.18 0.26 4.05
F 4 13 4.04 4.46 0.42 4.25
F 4 14 3.5 3.8 0.3 3.65
F 5 15 4 4.53 0.71 4.18
F 5 16 4.16 4.58 0.42 4.37
F 5 17 3.9 4.08 0.18 3.99
F 5 18 3.74 4.43 0.69 4.09
F 5 19 3.95 4.06 0.11 4.01
From an analysis of the data obtained, an im-
provement in performance assessment score be-
tween the first and second assessments is visible for
most teams, which suggests positive progress for stu-
dents/teams throughout the courses.
Number of Students and Team Performance: To
investigate if there is a correlation between the num-
ber of students in each course and the average per-
formance of the teams, we used the Pearson correla-
tion coefficient, which is a common statistical test that
measures the degree of linear relationship between
two continuous variables. We found a correlation co-
efficient of approximately -0.013. This value suggests
that there is practically no linear correlation between
the number of students on a course and team perfor-
mance. In statistical terms, this indicates that varia-
Impact of Team Formation Type on Students’ Performance in PBL-Based Software Engineering Education
333
tions in the number of students do not have a signifi-
cant linear effect on team performance, based on the
data obtained in these courses. This suggests that the
quality of teaching and team dynamics may be more
important than class size.
5 DISCUSSION
In this section, we answer and discuss our research
questions.
5.1 RQ1: How Do Performance
Assessment Results Differ Between
Teams that Are Self-Selected by
Students and Teams Formed Using
the TFM Systematic Method?
To answer this research question, we analyzed the
performance assessment results considering two per-
spectives of Table 8: (1) Variance of teams’ per-
formance scores between the first and second as-
sessments; and (2) Comparison of performance av-
erages of teams formed by self-selection and by TFM
method.
5.1.1 Variance of Teams Performance Scores
Between the First and Second Assessments
Repeated Measures Analysis of Variance (RM
ANOVA) was performed to compare teams’ assess-
ment scores between the first and second assessments.
The results show an F-value of approximately 6.77
and a p-value of 0.0137.
The p-value is less than the common threshold
of 0.05, suggesting statistically significant differences
between the first and second assessment scores. In
other words, we can conclude with a 95% confi-
dence level that there was a significant improve-
ment in the teams’ performance from the first to
the second assessment moment.
It is important to note that RM ANOVA assumes
that the same teams or individuals are measured more
than once, which is the case of our study. Further-
more, this test only considers scores and does not con-
sider other factors, such as the formation type or spe-
cific course.
5.1.2 Comparison of Performance Averages of
Teams Formed by Self-Selection and by
TFM Method
To investigate differences in the performance av-
erages between the self-selected and TFM-formed
teams, we calculated the performance average from
the first and second assessments (except in course
3, where only one performance assessment was con-
ducted). The results summarized in Table 9 suggest
that Self-selected teams (S) appear to have slightly
better performance than teams formed using a system-
atic method (TFM). This may indicate that allowing
students to choose their teams can lead to better team
dynamics and, consequently, better performance.
Table 9: Summary of Performance Assessment Results.
Formation Course 1st 2nd Average
S 1 4.16 4.40 4.28
2 4.45 4.61 4.52
3 not performed 4.14 4.18
F 4 3.9 4.20 4.15
5 3.95 4.34 4.13
We also observed that the degree of improve-
ment seems to be higher in TFM-formed teams.
Both self-selected and TFM-formed teams improve
from the first to the second assessment. However, the
degree of improvement seems to be higher in TFM-
formed teams. This could suggest that teams formed
using a systematic method might have a higher capac-
ity for learning and adaptation.
We performed a t-test for independent samples
to compare the average performance between teams
formed by self-selection (S) and by method (TFM)
considering the following hypothesis:
Null Hypothesis (H0): There is no significant dif-
ference in the average performance between teams
formed by self-selection and those formed by TFM
method.
Alternative Hypothesis (H1): There is a significant
difference in average performance between teams
formed by self-selection and those formed by TFM
method.
The results were: t-statistic: 2.7014 and p-
Value: 0.0151. We reject the null hypothesis with
a p-value of approximately 0.0151, which is less than
the common threshold of 0.05. This suggests a statis-
tically significant difference in average performance
between teams formed by self-selection and those
formed by TFM method.
The results suggest that the team formation
method has a significant impact on performance.
This may be due to different team dynamics, com-
fort levels, or compatibility between team members,
which are influenced by the training method.
We also believe that teams formed through self-
selection may have performed better due to their
choice to work with colleagues with whom they
already have a good relationship or whose skills
complement their own. On the other hand, teams
CSEDU 2024 - 16th International Conference on Computer Supported Education
334
formed by a framework may have faced initial adap-
tation challenges or a lack of synergy.
5.2 RQ2: How Do Project Scores Differ
Between Teams that Are
Self-Selected by Students and Teams
Formed Using TFM?
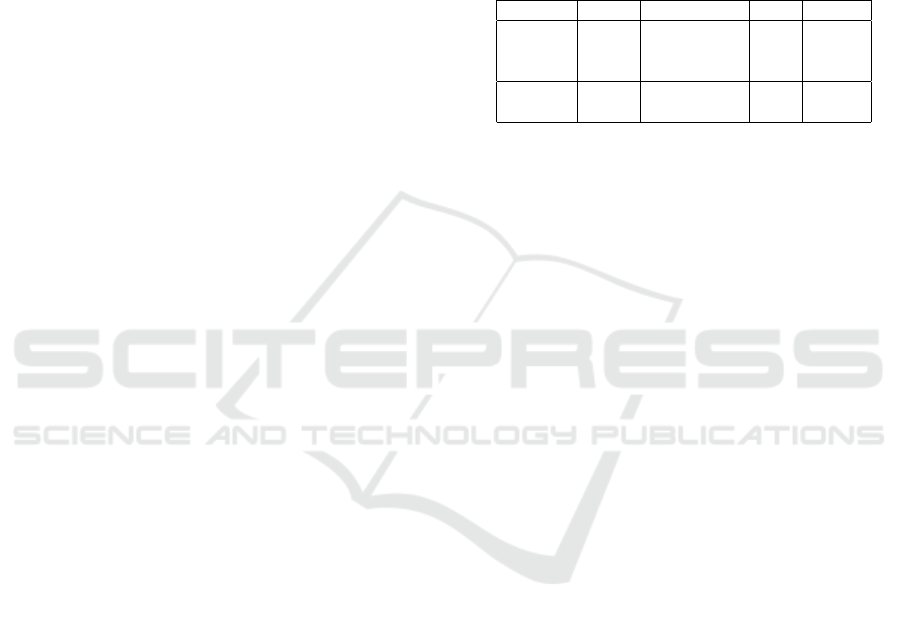
Figure 3 presents the grades (scale 0 to 100) of both
formats (self-selected and framework-formed teams)
in the form of a boxplot. The median grade for
the ”Self-selected” team is around 91, while for the
”TFM” team, it is around 90. The interquartile range
(IQR) for the ”Self-selected” team is wider, indicating
a higher dispersion of grades compared to the ”TFM”
team. The minimum and maximum values for the
”Self-selected” team are 62.14 and 100, respectively,
while for the ”TFM” team, they are 67.5 and 98.
Figure 3: Distribution of grades between the two teams,
Self-selected and TFM-formed.
Based on the boxplot, there doesn’t seem to be
a significant difference in grades between the two
teams. Both teams have a similar distribution, with
close medians and grade variation. We followed our
analysis by calculating the teams’ average scores for
each course in percentage terms and the standard de-
viation as shown in Table 10.
Table 10: Grade Score and Standard Deviation.
Formation Course Average
Grade (%)
Standard
Deviation
S Course 1 72.75 12.67
S Course 2 93.50 9.29
S Course 3 86.50 15.53
S All 84.25 3.13
F Course 4 85.31 12.25
F Course 5 86.25 11.09
F All 85.78 0.82
Analyzing the team grades in each formation type,
we discussed the conclusions below.
General Grade. Both types of team formation, self-
selected (S) and formed by a method (TFM), have
high-grading teams, with several teams achieving
grades of 80% or more. This suggests that both team
formation approaches can be effective.
Average Grade. The average grade appears to be
slightly higher for self-selected teams (S) compared
to teams formed by a method (TFM). However, the
difference is not very large, and both team formation
approaches result in generally high grades.
The standard deviation of grades varies across
courses and between forms of team formation. This
indicates that the grades’ dispersion may differ de-
pending on the specific circumstances of each course
and team formation method.
The average performance across all courses by
team formation type, also shown in Table 10, sug-
gests that using the method TFM may positively im-
pact the overall project scores. Considering the work
of (Løvold et al., 2020) that noticed the self-selected
teams formed by the students performed slightly bet-
ter than the instructor’s, our results possibly indicate
that TFM-based teams are better than instructor-based
teams.
We applied a t-test for independent samples
(specifically the Welch t-test, which does not assume
equal variances) considering the following hypothe-
sis:
Null Hypothesis (H0): There is no significant dif-
ference in grades between the two types of team for-
mation types.
Alternative Hypothesis (H1): There is a significant
difference in grades between the two types of team
formation types.
The Calculated t-value Is -0.0998, and the p-value
is 0.9214. Based on the t-test result, there is insuf-
ficient evidence to reject the null hypothesis. There-
fore, we cannot conclude that there is a statistically
significant difference in grades between the ”Self-
selected” and ”TFM Method” teams.
This conclusion, however, is restricted to the con-
text of the data analyzed and the design of the study in
question. It does not necessarily mean that there are
no differences in other contexts or that unmeasured
factors cannot influence grades. In our opinion, this
suggests that other factors, such as project complex-
ity or team members’ skill level, may also influence
the grade.
Impact of Team Formation Type on Students’ Performance in PBL-Based Software Engineering Education
335
5.3 RQ3: Does Performance in Each
Soft Skill Vary Between
Assessments or Team Formation
Method?
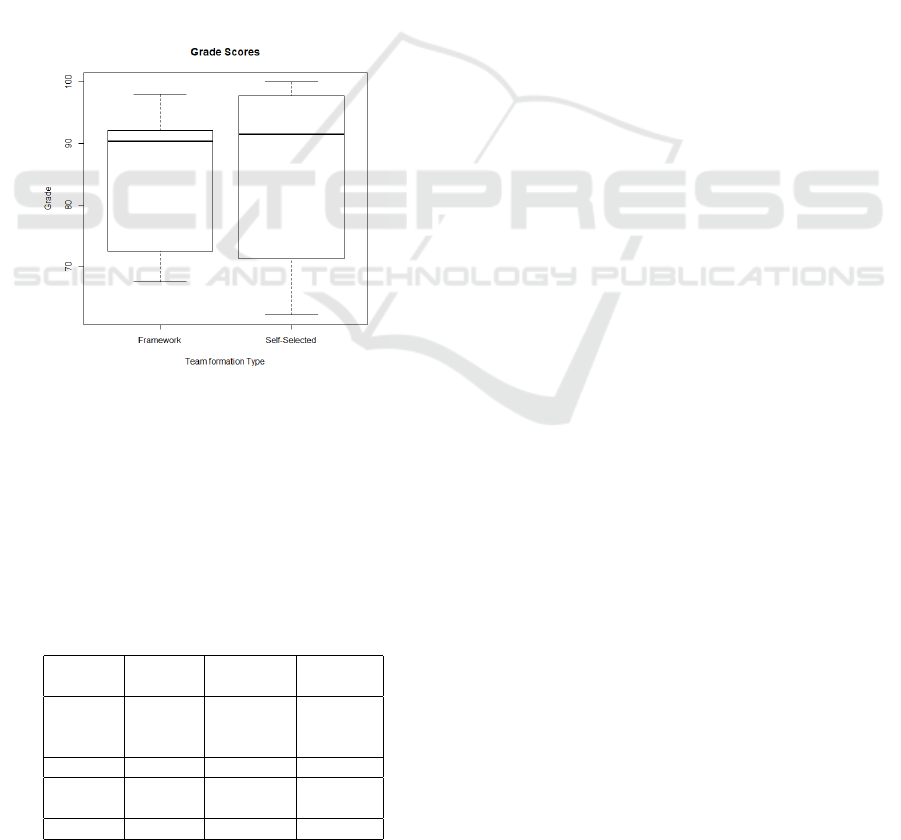
Figure 4 presents the boxplots comparing the eval-
uation of each soft skill across the two assessment
moments for the courses where the teams were self-
selected (courses 1 and 2). Each soft skill (SFI, CMT,
CLB, INV, COM, LRN, PLN, EVL) is represented
with two boxplots side by side, one for the first assess-
ment and the other for the second assessment. This
visualization allows us to easily compare the distri-
bution of scores for each soft skill between the two
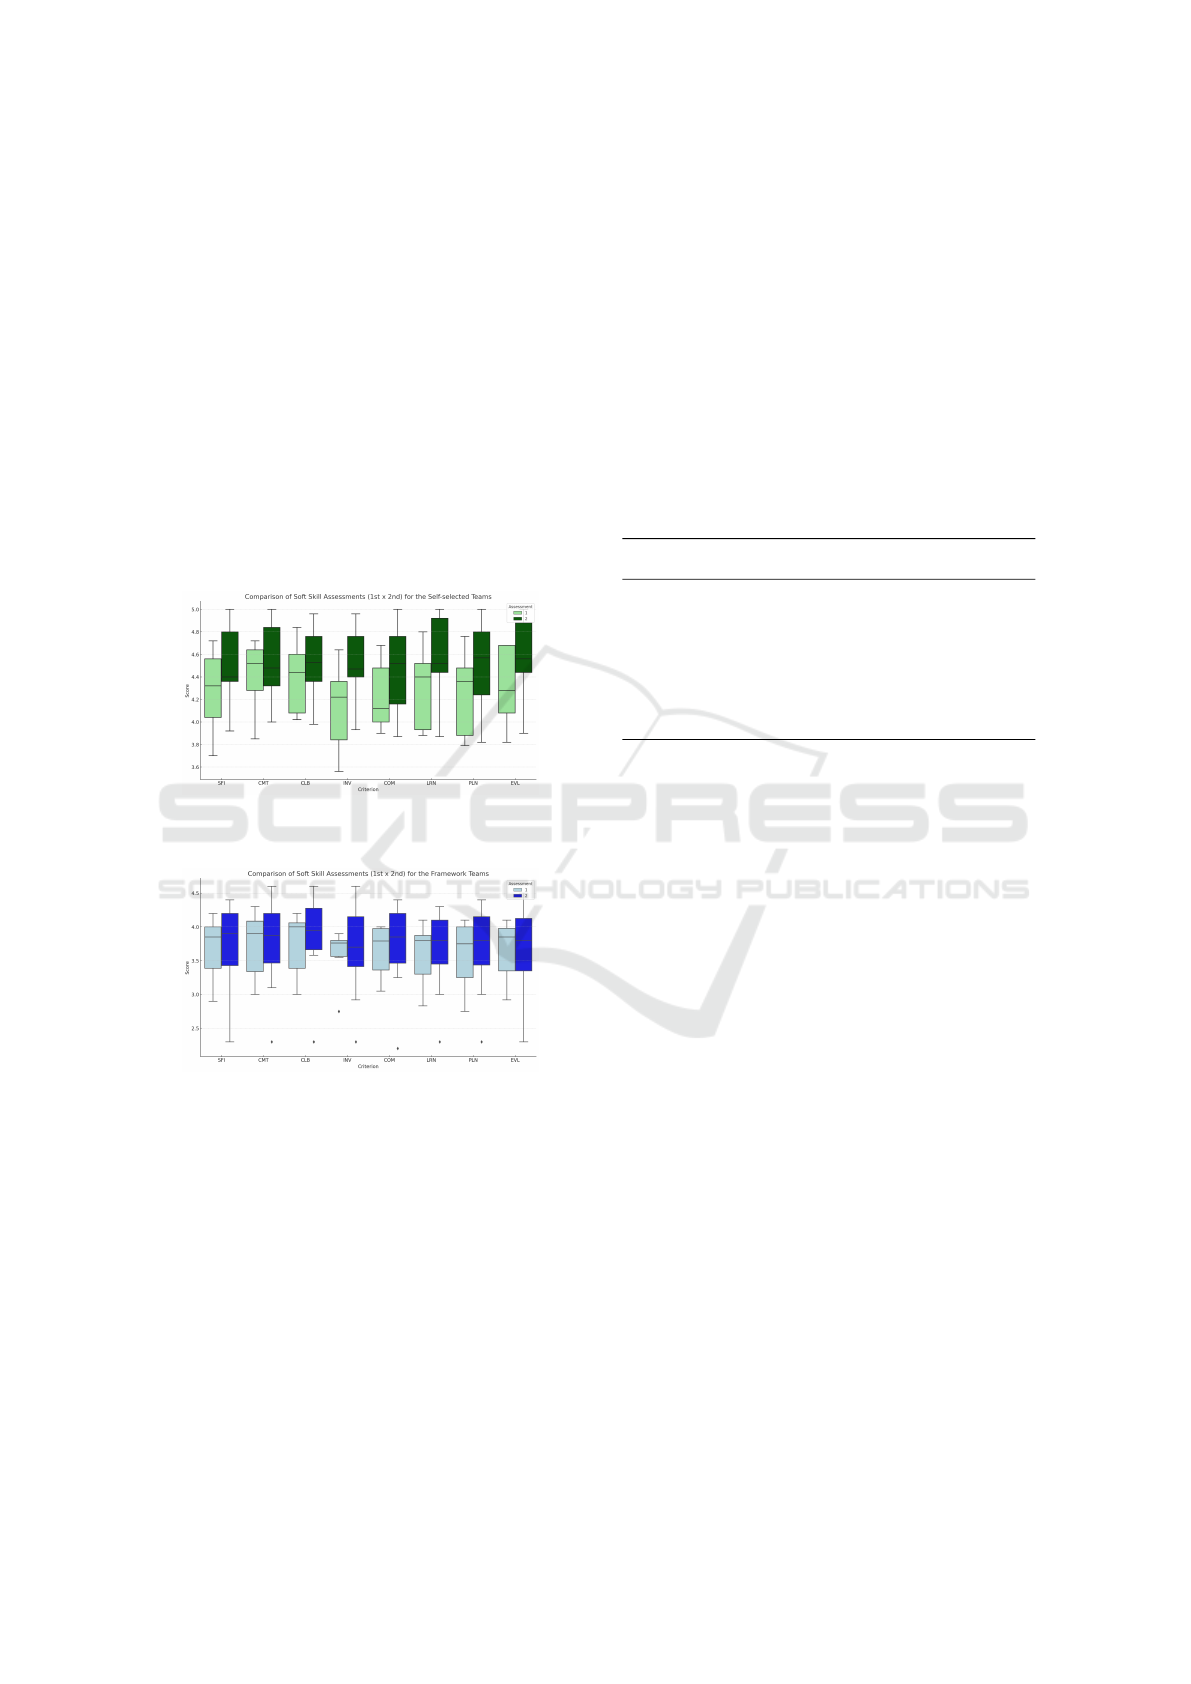
assessments. In the same way, Figure 5 shows the
boxplot for the TFM-formed groups.
Figure 4: Comparison of Soft Skill Assessments Over Two
Periods for the Self-selected Teams.
Figure 5: Comparison of Soft Skill Assessments Over Two
Periods for the TFM-formed Teams.
The comparative analysis reveals a positive trajec-
tory in soft skills development over time. We noticed
consistently high performance in skills like ’CMT’
and ’CLB’, pointing to established strengths, while
the significant improvements in ’LRN’, ’SFI’, and
’COM’ highlight areas of successful development and
focus between the two assessment periods.
As performance assessments were carried out at
two different times, we used this analysis to under-
stand how performance in soft skills evolved over
time in each type of team formation. For this, a Mixed
Effects Analysis of Variance was carried out, given
that the number of observations in each group was
not the same. The results presented in Table 11 in-
dicate the importance of the team formation type in
the “SFI” and “CMT” skills, while the evolution over
time seems to have a smaller impact.
Intercept is the average value of the soft skill score
when all independent variables (factors) are equal to
zero. InterceptP represents the P-value of the Inter-
cept. AssessmentP is the P-value of the Assessment
indicating the effect of the second assessment com-
pared to the first. FormationTypeP is the P-value of
the Formation Type. InteractionP is the P-value of
Interaction.
Table 11: Results of the Mixed Effects Analysis of Vari-
ance.
SoftSkill Intercept InterceptP AssessmentP Formation
TypeP
InteractionP
SFI 3.657 < 0.001 0.546 0.001 0.783
CMT 3.734 < 0.001 0.878 < 0.001 0.712
CLB 3.758 0 0.227 < 0.001 0.923
INV 3.557 0.000 0.628 0.004 0.522
COM 3.645 0.000 0.486 < 0.001 0.496
LRN 3.562 0.000 0.397 <0.001 0.295
PLN 3.600 0 0.432 0.003 0.611
EVL 3.649 0 0.666 <0.001 .493
Based on the Mixed Effects Variance Analysis for
soft skills, except for ’INV’, all other skills show
significant differences between types of team forma-
tion, with ”Self-Selected” teams generally presenting
higher averages. This suggests that the self-selection
of teams may be more aligned with the promotion or
recognition of certain soft skills. From this analysis,
it was observed that:
• SFI and CMT: Both skills do not show significant
differences in assessments over time, suggesting
consistency in perception or performance in these
areas.
• CLB and LRN: These skills showed significant
differences in the team formation type and main-
tained consistency in assessment over time. This
indicates that the way teams are formed can have
a lasting impact on these competencies.
• COM: This skill appears to be quite influenced
by the team formation type but without significant
variation over time or interaction between factors.
• PLN and EVL: Both skills showed significant
variations in the team formation type but without
significant changes over time. This suggests that
team formation has a greater impact than temporal
evolution in these areas.
• INV: A notable exception, ”INV” did not show
significant differences in the type of team forma-
tion, which may indicate a more individualized
CSEDU 2024 - 16th International Conference on Computer Supported Education
336

nature of this skill, less influenced by the team
context.
5.4 Threats to Validity
Considering the classification of threats to validity of
(Wohlin et al., 2012), we observe some threats to va-
lidity.
In the external validity threats, there is a lim-
ited sample size. Although we have 127 students,
the study includes data from only five postgradu-
ate courses, which may limit the generalizability of
the findings to a broader population of RE students
or different educational contexts. Therefore, caution
should be exercised when generalizing these results to
other contexts or populations.
Regarding Internal validity threats, since the real-
life projects chosen for each course are different in
some courses, their complexity could influence the
team performance and outcomes, leading to potential
confounding factors. Another threat is the fact that
comparing presential courses with remote courses
may be a threat to validity since there may be differ-
ences in learning conditions and outcomes.
In relation to conclusion validity threats, the sub-
jective nature of peer assessment, where team mem-
bers evaluate each other, may introduce bias or incon-
sistency in the evaluation process, affecting the ac-
curacy of the results. It is important to highlight the
difference between causality and correlation. It is im-
portant to remember that although the test shows a
significant difference, it does not imply direct cau-
sation. Other unmeasured factors may influence the
results.
6 CONCLUSIONS AND FUTURE
WORK
This paper investigates the efficacy of combining a
team formation method (TFM) with performance as-
sessment in RE courses. The study analyzes 25 teams
across five postgraduate RE courses conducted in
2022 and 2023. The main conclusions of this study
are:
• There was a significant improvement in the teams’
performance from the first to the second assess-
ment moment.
• There is a statistically significant difference in av-
erage performance between teams formed by self-
selection and those formed by TFM.
• We cannot conclude that there is a statistically sig-
nificant difference in grades between the ”Self-
selected” and ”TFM” teams.
• The results of the Mixed Effects Variance Analy-
sis for soft skills show an interesting pattern. Most
skills, including ”SFI”, ”CMT”, ”CLB”, ”COM”,
”LRN”, and ”EVL”, revealed significant differ-
ences in performance based on the team forma-
tion type, indicating that self-selected teams tend
to have higher scores in these areas. On the other
hand, ”INV” and ”PLN” stood out for showing
less influence on the team formation type. In
terms of changes over time (assessments), none
of the skills showed significant differences, sug-
gesting consistency in perceptions or development
of these soft skills over the studied period. Inter-
estingly, the interaction between the type of team
formation and time was not significant for most
skills, indicating that the impact of the type of
team formation is relatively stable, regardless of
the assessment over time.
As contributions of this study, we argue:
We provide evidence that the team formation
type can influence the performance assessments.
We demonstrated the importance of Soft Skills
in the Educational or Organizational Context. The
study reinforces the importance of soft skills in the ed-
ucational or teamwork context. Strategies to improve
these skills can be fundamental to the team’s success.
We also compared the project grades between
self-selected teams and those formed by TFM. The
analysis shows that teams formed using the TFM
method have a slightly higher average grade than
those formed through self-selection. This suggests
that the use of the TFM may have a positive impact
on the overall project grades.
We envision several avenues for future research.
First, (1) it would be beneficial to conduct a similar
study with a larger sample size across multiple uni-
versities to validate our findings. Second, (2) explore
the relationship between personality indicators and
the performance evaluation to obtain a more compre-
hensive understanding of team dynamics; and, finally,
(3) incorporate other factors, such as the complexity
of the project and the duration of the project, to have
a more nuanced understanding of team performance
in RE courses.
ACKNOWLEDGEMENTS
The authors would like to thank all the students who
participated in this study.
Impact of Team Formation Type on Students’ Performance in PBL-Based Software Engineering Education
337

REFERENCES
Basholli, A., Baxhaku, F., Dranidis, D., and Hatziapostolou,
T. (2013). Fair assessment in software engineering
capstone projects. In Proceedings of the 6th Balkan
Conference in Informatics, pages 244–250.
Bastarrica, M. C., Gutierrez, F. J., Marques, M., and Per-
ovich, D. (2023). On the impact of grading on
teamwork quality in a software engineering capstone
course. IEEE Access.
Bastarrica, M. C., Perovich, D., Gutierrez, F. J., and Mar-
ques, M. (2019). A grading schema for reinforc-
ing teamwork quality in a capstone course. In 2019
IEEE/ACM 41st International Conference on Soft-
ware Engineering: Companion Proceedings (ICSE-
Companion), pages 276–277. IEEE.
Beranek, G., Zuser, W., and Grechenig, T. (2005). Func-
tional group roles in software engineering teams. In
Proceedings of the 2005 workshop on Human and so-
cial factors of software engineering, pages 1–7.
Cadette, W. D. A., Felizardo, F., Zavadski, A. C., Leal, G.
C. L., Balancieri, R., and Colanzi, T. E. (2022). The
impact of the group maturity on the software develop-
ment team effectiveness: an experience report. In Pro-
ceedings of the XXXVI Brazilian Symposium on Soft-
ware Engineering, pages 78–87.
Chen, J., Qiu, G., Yuan, L., Zhang, L., and Lu, G. (2011).
Assessing teamwork performance in software engi-
neering education: A case in a software engineering
undergraduate course. In 2011 18th Asia-Pacific Soft-
ware Engineering Conference, pages 17–24. IEEE.
da Silva, F. Q., Franca, A. C. C., Gouveia, T. B., Monteiro,
C. V., Cardozo, E. S., and Suassuna, M. (2011). An
empirical study on the use of team building criteria
in software projects. In 2011 International Sympo-
sium on Empirical Software Engineering and Mea-
surement, pages 58–67. IEEE.
Dillenbourg, P. (1999). What do you mean by collaborative
learning?
dos Santos, S. C. (2023). Transforming Computing Edu-
cation with Problem-Based Learning: From Educa-
tional Goals to Competencies. Cambridge Scholars
Publishing.
Gibson, D., Irving, L., and Scott, K. (2018). Technology-
enabled challenge-based learning in a global con-
text. M. Shonfeld & D. Gibson, Online Collaborative
Learning in a Global World. Charlotte, NC: Informa-
tion Age Publishing.
Kolmos, A. (2009). Problem-based and project-based learn-
ing. University science and mathematics education in
transition, pages 261–280.
Kruchten, P. (2004). Putting the” engineering” into” soft-
ware engineering”. In 2004 Australian Software Engi-
neering Conference. Proceedings., pages 2–8. IEEE.
Løvold, H. H., Lindsjørn, Y., and Stray, V. (2020). Form-
ing and assessing student teams in software engineer-
ing courses. In Agile Processes in Software Engineer-
ing and Extreme Programming–Workshops: XP 2020
Workshops, Copenhagen, Denmark, June 8–12, 2020,
Revised Selected Papers 21, pages 298–306. Springer.
Maia, D., dos Santos, S. C., Cavalcante, G., and Falc
˜
ao,
P. (2023). Managing soft skills development in tech-
nological innovation project teams: An experience
report in the automotive industry. In 2023 IEEE
Frontiers in Education Conference (FIE) Proceed-
ings, pages 1–8. IEEE.
Manukyan, N., Eppstein, M. J., and Horbar, J. D. (2013).
Team structure and quality improvement in collabora-
tive environments. In 2013 International Conference
on Collaboration Technologies and Systems (CTS),
pages 523–529. IEEE.
Matturro, G., Raschetti, F., and Font
´
an, C. (2015). Soft
skills in software development teams: A survey of the
points of view of team leaders and team members. In
2015 IEEE/ACM 8th International Workshop on Co-
operative and Human Aspects of Software Engineer-
ing, pages 101–104. IEEE.
Oguz, D. and Oguz, K. (2019). Perspectives on the gap
between the software industry and the software engi-
neering education. IEEE Access, 7:117527–117543.
Ounnas, A., Davis, H. C., and Millard, D. E. (2007). To-
wards semantic group formation. In Seventh IEEE In-
ternational Conference on Advanced Learning Tech-
nologies (ICALT 2007), pages 825–827. IEEE.
Parker, G. M. (1990). Team players and teamwork. Citeseer.
Salas, E., Cannon-Bowers, J. A., and Blickensderfer, E. L.
(1993). Team performance and training research:
Emerging principles. Journal of the Washington
Academy of Sciences, pages 81–106.
Santos, S. C. (2016). Pbl-see: An authentic assessment
model for pbl-based software engineering education.
IEEE Transactions on Education, 60(2):120–126.
Sisk, R. J. (2011). Team-based learning: systematic
research review. Journal of Nursing Education,
50(12):665–669.
Tafliovich, A., Petersen, A., and Campbell, J. (2015). On
the evaluation of student team software development
projects. In Proceedings of the 46th ACM techni-
cal symposium on computer science education, pages
494–499.
Vilela, J. and Silva, C. (2023). An experience report on the
use of problem-based learning and design thinking in
a requirements engineering postgraduate course. In
Proceedings of the XXXVII Brazilian Symposium on
Software Engineering, pages 432–441.
Wang, D.-Y., Lin, S. S., and Sun, C.-T. (2007). Diana:
A computer-supported heterogeneous grouping sys-
tem for teachers to conduct successful small learning
groups. Computers in Human Behavior, 23(4):1997–
2010.
Wessner, M. and Pfister, H.-R. (2001). Group formation
in computer-supported collaborative learning. In Pro-
ceedings of the 2001 ACM International Conference
on Supporting Group Work, pages 24–31.
Wohlin, C., Runeson, P., H
¨
ost, M., Ohlsson, M. C., Reg-
nell, B., and Wessl
´
en, A. (2012). Experimentation in
software engineering. Springer Science & Business
Media.
Zimmermann, A. (2004). Regulation of liver re-
generation. Nephrology Dialysis Transplantation,
19(suppl
4):iv6–iv10.
CSEDU 2024 - 16th International Conference on Computer Supported Education
338
