
AI Technology Adoption & Sustainability Improvement Though
Cloud Solutions
Maarten Voorneveld
Leiden Institute of Advanced Computer Science Snellius Gebouw, Niels Bohrweg 1, 2333 CA Leiden, The Netherlands
Keywords: AI, ML, Cloud, Industry, Sustainability, Adoption.
Abstract: Cloud and AI are game changers in digital transformation, as it facilitates long-term digital development
and technology adoption. A study of over 1000 organizations in Western Europe was conducted to identify
company adoption of AI technology and cloud computing-based sustainability benefits. This paper offers
the survey results and situates them within the larger context, showing how businesses employ cloud
technology to achieve their AI and sustainability goals. Digital innovations such as AI technology are being
realized
via
cloud
services,
allowing
companies
to
better
develop
their
product
and
services.
1
INTRODUCTION
There's a growing emphasis on artificial intelligence
(AI) and cloud-enabled technologies. Organizations
have doubled their use of AI capabilities, with a
focus on robotic process automation and computer
vision (Quantumblack, 2022). The environmental
impact of technology, particularly data centres, is a
growing concern (Wan, 2019). Cloud plays a critical
role in AI systems' creation, implementation, and
scalability, providing essential resources like
computing power and storage (Hummer, 2019).
Cloud facilitates collaboration for AI development
and enables distributed workloads for faster
processing (Gill, 2019). Cloud services offer a cost-
effective and energy-efficient way to apply AI
(Buyya, 2018). The pay-as-you-go model of cloud
computing benefits businesses in accessing AI
resources on demand (Attaran, 2019).
The flexibility of cloud technologies enhances
AI innovation in various fields. Cloud is the ideal
platform for AI, providing a broad data lake
connection for cognitive capabilities (Montori,
2018). Cloud-based AI solutions leverage machine
learning algorithms and big datasets for
sophisticated decision-making (Allahvirdizadeh,
2019). Robotics also relies on the cloud, using AI
and ML for automation (Lee, 2018). Automation,
powered by cloud-based solutions, enhances
productivity and streamlines operations (Ahmad,
2021). Cloud-hosted analytics solutions process IoT-
generated data for data-driven decision-making
(Antonopoulos, 2020). Cloud-based technologies
collaborate to enable large-scale data gathering,
analysis, and usage for sustainable decision-making.
AI implementation is in early stages, with
companies recognizing its potential but facing social
challenges. Cloud computing accelerates AI and
supports environmental benefits by providing IT
resources without hefty hardware investments
(Ahmad, 2021). AI is making strides in the
sustainable energy industry (Antonopoulos, 2020).
Cloud operations prioritize renewable energy
sources for data centres. However, challenges in AI
implementation, connectivity to cloud technologies,
and sustainability need industry attention (Muhlroth,
2020).
Despite AI's increasing adoption, there's a
knowledge gap on its industry implications.
Research areas include challenges in AI adoption, its
impact on organizational culture, AI-driven
automation in decision-making, organizational
structure changes, AI's influence on value
propositions and sustainability, innovation through
AI, and ethical considerations (Enholm et al., 2021).
An industry-oriented survey can fill these gaps,
offering insights for effective AI implementation.
This study focuses on the deployment of AI with a
foundation in cloud computing and a sustainability
perspective. It will look at how Western European
(WE) businesses are progressing with AI technology
adoption, on cloud-based innovation and its
sustainability footprint. The research question we
Voorneveld, M.
AI Technology Adoption & Sustainability Improvement Though Cloud Solutions.
DOI: 10.5220/0012612500003690
Paper published under CC license (CC BY-NC-ND 4.0)
In Proceedings of the 26th Inter national Conference on Enterprise Information Systems (ICEIS 2024) - Volume 2, pages 675-687
ISBN: 978-989-758-692-7; ISSN: 2184-4992
Proceedings Copyright © 2024 by SCITEPRESS – Science and Technology Publications, Lda.
675

aim to answer is as follows:
How have AI enabling technologies based on
cloud computing on West European companies
been adopted and enabled sustainability?
This paper contributes to theory and practice in
three ways. At first, we contribute to practice as
research findings will be used to provide insights
into the adoption of cloud based technologies IoT,
Analytics, Automation, Robotics, ML, and AI by
companies. This research will be beneficial to
companies, as it will provide them with a better
understanding of the potential of cloud driven AI for
their sectors. Secondly, this paper will also explore
the broader implications of cloud computing
including examining the impact on enabling
technologies as it looks into the impact of AI
technologies and sustainability though cloud
computing
on
industry-specific
sectors,
such
as
automotive and manufacturing. The final
contribution is to the broader societal impact as it
will explore the potential for start-ups and young
companies in terms of innovation and market
positioning, it will examine the state of AI
technologies and sustainability of cloud for energy
efficiency and carbon emission reduction. This paper
continues with a literature review, followed by a
methodology, analysis and conclusions section.
2
BACKGROUND
AI is a scientific discipline, technologies used to
realize AI, and AI capabilities. AI emulates human
performance by acting as an intelligent agent, which
performs actions based on a specific understanding
of input from the environment. This should be
accomplished without relying on preconceived rules
or action sequences throughout the whole procedure.
AI is defined in two ways: as a tool that solves a
specific task that could be impossible or very time-
consuming for a human to complete, and as a system
that mimics human intelligence and cognitive
processes. advancements in AI have produced AI
systems that are capable of persuading humans, even
systems that are not explicitly designed to persuade
may do so in practice,. (Burtell & Woodside, 2023).
Using AI technology improves choice behaviour and
increases perception of decision quality, but it
creates the risk of overreliance, which may be
explained by both a higher level of confidence in the
adviser and the attribution of a more organized
procedure (Keding 2021).
As AI gains prominence in organizations,
research explores its role in achieving organizational
goals, addressing both advantages and constraints
(Kakatkar, 2020). AI capabilities involve leveraging
data, methodologies, processes, and people for
automation, decision-making, and collaboration.
These capabilities encompass technological and non-
technical resources, highlighting the need for holistic
utilization to unlock AI's full strategic potential.
However, the real-world implementation at the firm
level, along with its connection to cloud and
sustainability, remains unclear. A mixed-method
approach, incorporating interviews, is recommended
for future studies to gain comprehensive insights
(Assunta di Vaio, 2020).
Cloud computing has emerged as a game-
changing technology that offers significant benefits
to businesses and is a core enabler for AI
technologies. It allows for virtually unlimited
capacity to process large amounts of data, enabling
the use of new technologies such as machine
learning and big data analytics (Kaisler et al., 2013).
Scalability allows for ramping up or down of
capacity as needed without major adjustments,
increasing flexibility and the ability to handle peak
workloads (Armbrust et al., 2010). The cloud also
facilitates experimental approaches that require
computational power, increasing potential for
innovation (Marston et al., 2011). Additionally,
cloud technology reduces IT costs by eliminating or
reducing hardware purchases, potentially increasing
sales while decreasing costs (Aljabre, 2017). Cloud
technology also strengthens the resilience of
businesses by improving cost control and response
capabilities to changing market events (Cao et al.,
2014). Finally, the cloud contributes to sustainability
by providing better energy balance and data security,
particularly if the provider relies on renewable
energy sources (Bardhan et al., 2010). Despite the
numerous benefits of cloud computing, research
suggests that businesses have been slow to adopt this
technology due to concerns about data security and
privacy (Goscinski et al., 2011). In terms of the
impact of cloud computing on digital
transformation, research has shown that cloud
adoption can enhance digital capabilities,
particularly in terms of data analytics, collaboration,
and mobility (Gupta et al., 2019). Additionally, there
is a lack of understanding about the costs and
benefits of cloud computing and how it can be
effectively integrated into existing IT infrastructure
(Chang et al., 2013). Research has also shown that
the impact of cloud computing on businesses varies
depending on the specific context and industry
(Lacity et al., 2010). Adoption of cloud computing
ICEIS 2024 - 26th International Conference on Enterprise Information Systems
676

had a positive impact on firm performance in the
financial services industry, but not in the
manufacturing industry (Kshetri, 2014). Cost and
energy savings of cloud computing can have a
significant impact on businesses, by reducing the
need for hardware and IT staff, businesses and
increase profitability (Agrawal et al., 2013).
However, it is important to note that the cost savings
associated with cloud computing may not be
immediate, and businesses must carefully consider
the total cost of ownership over the long term (Weill
et al., 2013). AI is rapidly evolving, offering
businesses benefits like sustainability, but also
challenges and risks. Companies must consider their
context, industry, legal, and regulatory requirements
when adopting AI technologies, contributing to the
literature on AI implementation in WE companies.
The present study aims to address this gap in the
literature by examining the impact of cloud
computing on WE companies in terms of digital
transformation, innovation, cost savings, data
security, and resilience.
3
METHODOLOGY
We collected data on the use of AI technologies and
sustainability in WE (Benelux and Germany)
companies in a large-scale digital survey.
Companies are asked about the use of various AI
technologies and sustainability enabled by cloud.
Additionally qualifying questions on revenue and
employee developments as asked. This allows
statistically significant correlations to be revealed
from the context of the survey without revealing
these correlations to the companies during the
survey, to avoid suggestive contexts. As part of the
research project to determine the significance of
cloud, over 1000 WE companies are interviewed in
2022 for this purpose in a digital survey.
Participating companies are sampled in a random
drawing stratified with respect to industry and size
categories. Stratification is necessary to ensure that
even marginally populated classes (firms with more
than 200 employees) have enough cases. The final
data is extrapolated to be representative of the
overall WE are using number weighting so that the
survey results can be interpreted beyond the sample
for the WE economy. The anchor variable here is the
industry class composition in the industries Services
and Production.
In preparation for the extensive survey, case
study interviews were conducted with selected
company representatives who have gained extensive
experience with the use of cloud services in the
recent past. Case study interviews belong to the
group of qualitative research methods. They are
suitable for deep examination. In contrast to the
company survey explained above, the case study
interviews do not aim to determine a representative
picture of cloud use and effects in WE companies
that can be derived on the basis of large numbers but
rather, in the sense of an in-depth investigation, to
explore further effects (which, for example, cannot
be collected in detail as part of the standardized
survey) as well as concrete enrichment in the form
of individual experience reports, concise success
stories, and precise effect descriptions. In this way,
the number-based results of the survey analogous
categories were used for the presumed effects of
cloud use enabling new technologies. These
categories were refined using stimulus questions and
tested for connectivity to the survey questions. As
the WE corporate landscape is largely made up of
service companies with a small number of
employees, it is precisely these companies that are
given greater weight in the survey. Weighting is
used to calibrate the industry and size class
composition of the sample to the composition of the
population. Company information is subjective in
nature. The data collected in the business survey will
be used to approximate reality and make data-based
deductions. The logic of the survey is based on a
top-down approach, including the various survey
blocks (i.e., introduction, company profile, key
points of cloud use, concrete effects and examples,
summary, outlook and further procedure, adoption)
defined. The corresponding text and question
formulations were then created for these individual
blocks.
Identify and recruit interview participants The
pool of interview participants was fed from two
sources. On the one hand, particularly interested
cloud users were approached directly; on the other
hand, a number of participating cloud customers also
agreed to be available for an additional case study
interview during the survey. As a matter of
principle, care was taken to ensure a broad
composition of the participant pool in order to take
into account different perspectives, industries,
company sizes and locations. These participants
were contacted by email and briefly introduced to
the objectives, key points, and content of the case
study interviews in advance. The surveys were
conducted digitally and input lasted approximately
40 to 60 minutes. Participants were encouraged to be
specific about their own experiences, focusing on
the key points of cloud use, and the significance for
AI Technology Adoption & Sustainability Improvement Though Cloud Solutions
677
the company. The answers were then evaluated; for
this purpose, a number-based statistical analysis of
the survey based on the interview logic and the use
of cloud services was used.
4
ANALYSIS
This section focuses on presenting the findings
derived from the data and providing a
comprehensive understanding of the research topic.
We will now present the collected data as examined,
interpreted, and analysed to address the research
objectives. The analysis data has been prepared by
cleaning and organizing the collected data, including
checking for missing values, outliers, and data
inconsistencies. The data has been visualized by
graphs to present the analysed data visually, to help
convey the findings in a concise and accessible
manner. The visualization is accompanied by an
interpretation of findings to explain the meaning and
implications of the analysed data. To connect the
findings back to the research objectives, discusses
any unexpected or significant results. For the
technology adoption questions there are 4 categories
of adoption which are measured in the percentage of
companies are at this level of adoption, very strong
(Company level), Strong (Business level), Limited
(Team level), and Very Limited (PoC). Please find
the results of technology adoption described per
topic.
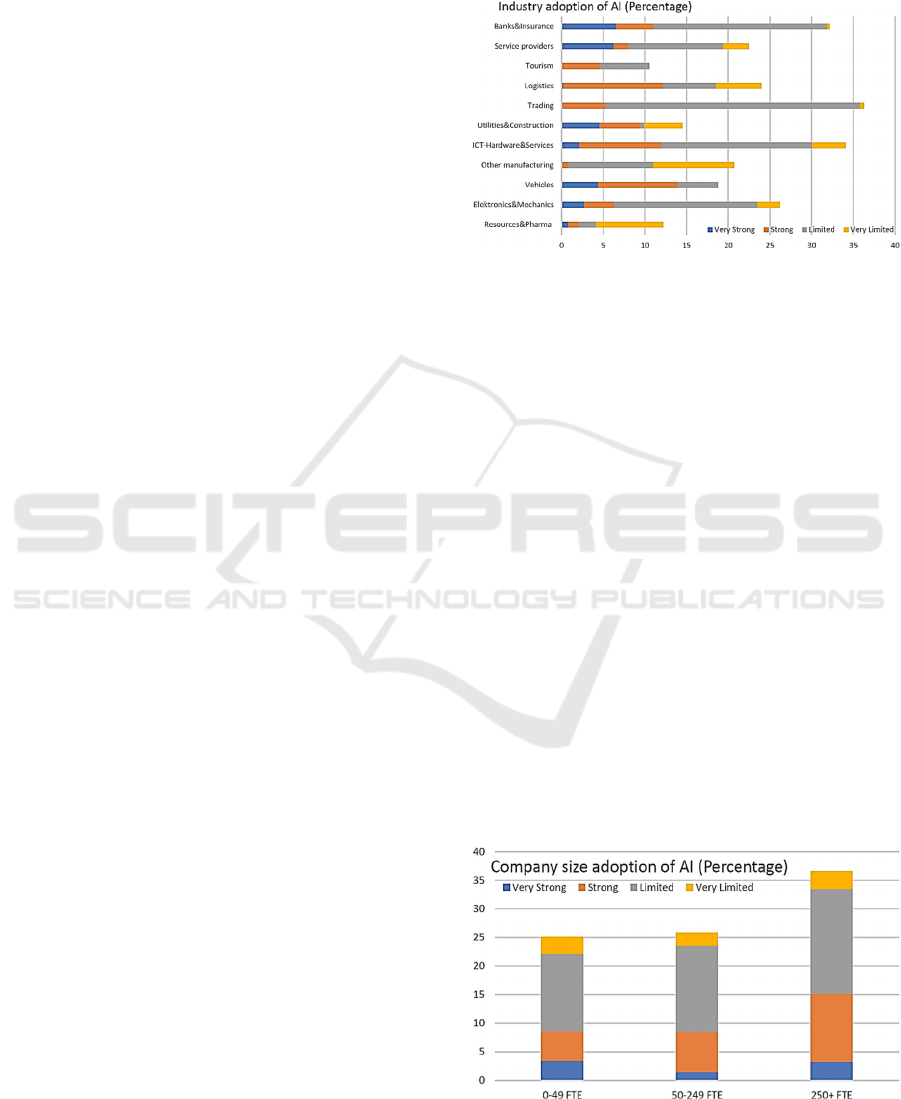
4.1 Industry Adoption of AI
There are many challenges to AI adoption, including
a lack of understanding and competence, privacy
concerns, cost, resistance to change, and ethical and
legal difficulties. The following graph provided
illustrates the percentage of cases where AI adoption
is categorized into different levels of strength within
each industry. The industries represented in the
graph are Resources & Pharma, Electronics &
Mechanics, Vehicles, Other manufacturing, ICT-
Hardware & Services, Utilities & Construction,
Trading, Logistics, Tourism, Service providers, and
Banks & Insurance.
The data presented in graph 1 provides insights
into the levels of AI adoption across different
industries. From the analysis, several observations
can be made. The percentages of AI adoption vary
significantly across industries. Some industries, such
as Electronics & Mechanics and ICT-Hardware &
Services, show higher levels of adoption across all
categories, including "Very Strong," "Strong,"
"Limited," and "Very Limited." On the other hand,
industries like Other Manufacturing and Tourism
exhibit lower levels of adoption, particularly in the
"Very Strong" and "Very Limited" categories.
Figure 1: Industry adoption of AI (%).
There is a dominance of Limited Adoption in
several industries, including Resources & Pharma,
Utilities & Construction, Trading, and Service
Providers; "Limited" adoption appears to be the
most prevalent category. This suggests that many
organizations in these industries have implemented AI
to some extent, but the adoption may not be uniform
across all strength levels. The data also reveals
variations in AI adoption patterns among different
industries, such as the dominance of "Very Strong"
and "Strong" adoption in Electronics & Mechanics,
indicating a more advanced level of implementation.
The Resources & Pharma industry shows lower
percentages across all adoption categories, suggesting
a slower uptake of AI technologies. The following
graph in fig 2 provides an overview of the company
size distribution
of
AI
adoption.
It
shows
that
AI
adoption varies across company size, with larger
companies having higher percentages of "Strong" and
"Limited" adoption. The percentages of "Very
Strong" adoption are relatively low across all
company sizes, indicating a limited implementation of
AI.
Figure 2: Company size adoption of AI (%).
ICEIS 2024 - 26th International Conference on Enterprise Information Systems
678
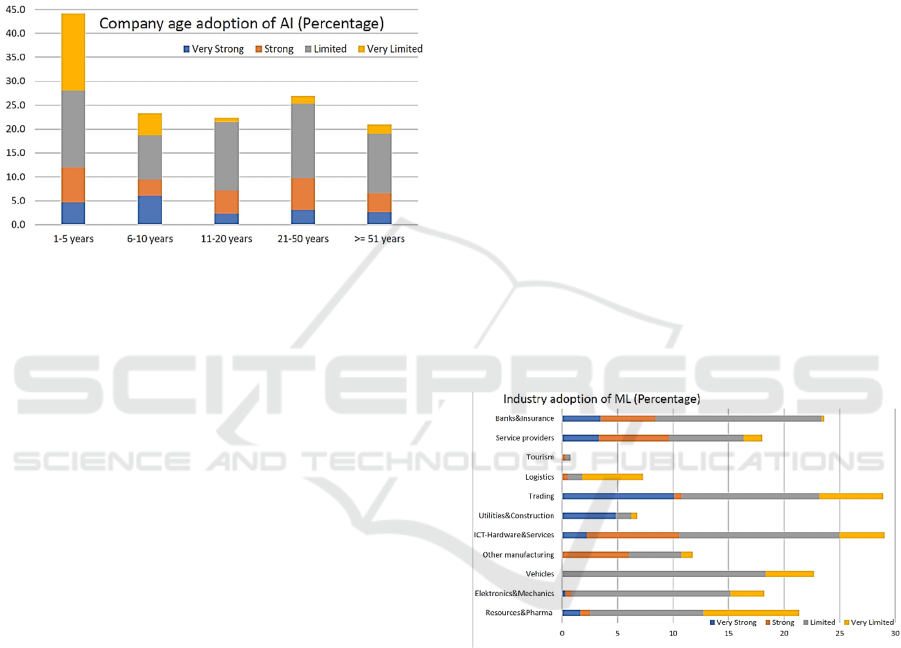
Lastly we would like to show the company age
distribution for the adoption of AI in fig 3,
showing younger organizations have a higher
likelihood of implementing AI solutions. Whilst the
intensity of implementation does differ much over
age. the data highlights the varying degrees of AI
adoption across industries. It indicates that while
some industries have made significant strides in AI
implementation, others are still in the early stages or
have limited adoption.
Figure 3: Company size adoption of AI (%)
In conclusion, larger and younger organizations tend
to have the highest likelihood of implementing AI,
especially if they are active in Electronics Vehicles
production, Utilities construction or banking
services industries. Understanding these patterns can
help policymakers, researchers, and industry leaders
in identifying opportunities and formulating
strategies to promote AI adoption and its potential
benefits across diverse sectors.
4.2 Industry Adoption of ML
Machine learning has the potential to transform the
way organizations run, but there are significant
barriers to its widespread adoption. These difficulties
include a lack of data quality, a paucity of personnel,
regulatory issues, explainability, and prejudice. The
following graph in fig 4 illustrates the percentage of
cases where ML adoption is categorized into different
levels of strength within each industry. The industries
represented in the graph are Resources & Pharma,
Electronics & Mechanics, Vehicles, Other
manufacturing, ICT- Hardware & Services, Utilities
& Construction, Trading, Logistics, Tourism, Service
providers, and Banks & Insurance.
From the chart the percentages of ML adoption
several conclusions can be drawn. The data reveals
that the distribution of ML adoption varies across
industries. Some industries, such as Resources &
Pharma, Electronics & Mechanics, and ICT-
Hardware & Services, exhibit a wider range of
adoption levels across all categories, including
"Very Strong," "Strong," "Limited," and "Very
Limited." In contrast, industries like Tourism and
Utilities & Construction show lower overall
adoption percentages, with negligible or minimal
ML adoption reported. Limited Adoption
Dominance: In several industries, including
Resources & Pharma, Electronics & Mechanics, and
Banks & Insurance, the "Limited" adoption category
represents the highest percentage. This suggests that
organizations within these industries have adopted
ML technologies to a certain extent but haven't
achieved a widespread or intensive implementation.
Notably, the "Very Limited" adoption category
appears to have low percentages across most
industries, indicating that organizations have either
embraced ML at a higher level or have not yet
started implementing ML solutions with limited
scope. Each industry exhibits its own ML adoption
pattern. For example, the Trading industry stands out
with higher percentages of "Very Strong" and
"Limited" adoption, indicating a more diverse range
of adoption levels. On the other hand, the Tourism
industry shows no reported ML adoption in any of
the categories, indicating a lack of ML
implementation in this sector.
Figure 4: Industry adoption of ML (%).
The following graph in fig 5 provides an overview
of the company size distribution of ML adoption. It
shows that ML adoption varies across company size,
with larger and medium companies having higher
percentages of "Strong" and "Limited" adoption. The
percentages of "Very Strong" adoption are relatively
low across all company sizes, indicating a limited
implementation of ML.
Lastly, we would like to show the company age
distribution for the adoption of ML in fig 6, showing
younger organizations have a higher like-lihood of
implementing ML solutions. The intensity of
implementation does differ strongly over age.
AI Technology Adoption & Sustainability Improvement Though Cloud Solutions
679
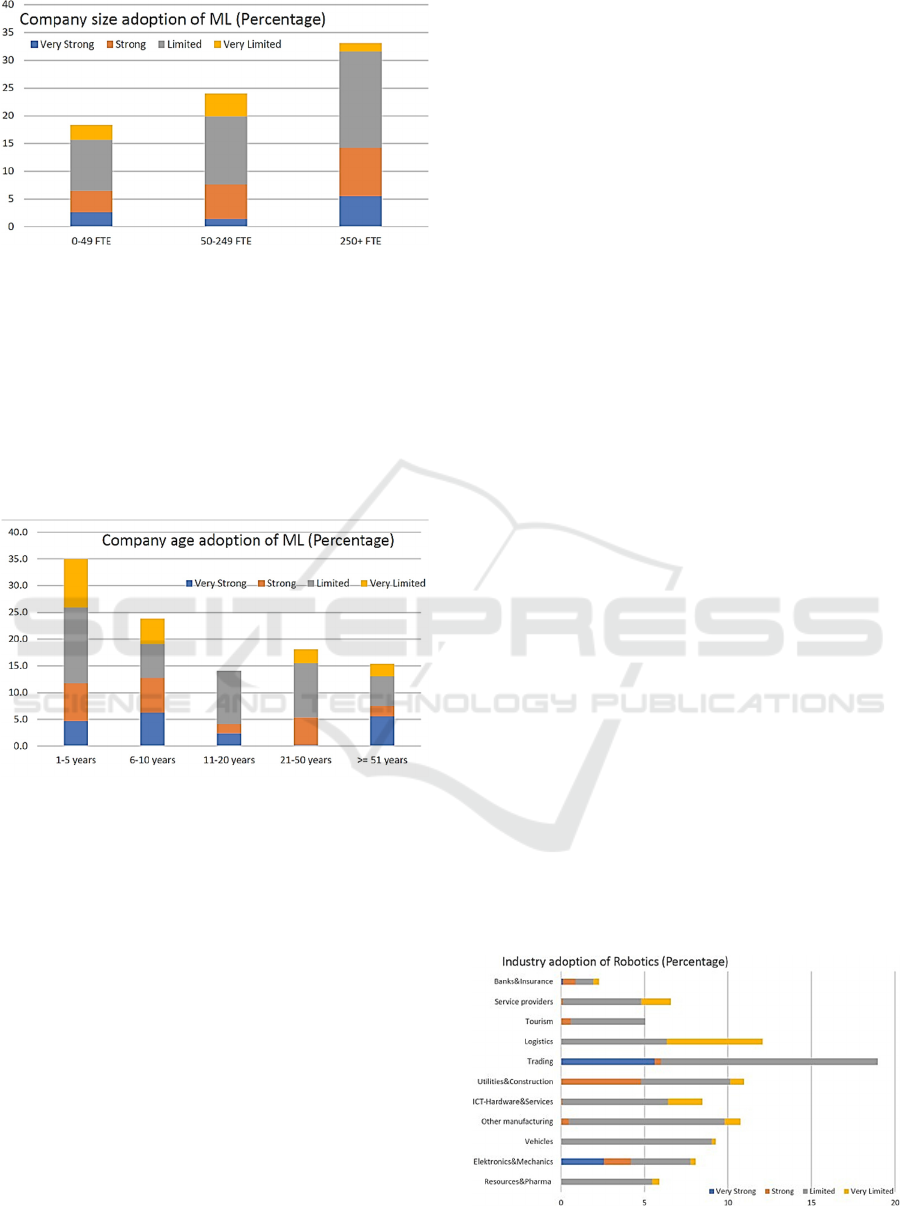
Figure 5: Company size ML adoption (%).
Comparative study of ML adoption across
sectors, displaying the distribution of instances
within each degree of adoption strength. various
degrees of ML deployment, with certain industries
having a greater number of examples with
significant acceptance than others. This data can be
useful for assessing the current level of ML usage in
various industries and identifying areas where more
investment may be required.
Figure 6: Company age adoption of ML (%).
Overall, the data demonstrates the various levels of
ML usage across industries, where larger and
younger organizations tend to have the highest
likelihood of implementing AI, especially if they are
active in Utilities/construction, Trading or
banking/services industries. While some industries
have made significant progress in ML deployment,
others continue to lag or have limited acceptance.
Understanding these trends can assist in informing
decision-making processes, resource allocation, and
strategic planning in order to encourage widespread
ML use and its potential advantages in many
industries.
4.3 Industry Adoption of Robotics
Robotics is facing challenges such as human-
oriented interaction, building bio-based robots,
multifunctionality, RPA management, and
communication in swarm robots. Business leaders
should encourage employees to interact with
machines and take initiatives to deploy more human-
friendly robots. Robots require communication
abilities to be integrated into feedback loops,
environment mapping, reasonable AI systems,
privacy and security, implementation of the wrong
RPA solution, and ethical values to be taken into
account. The following illustrates the percentage of
cases where robotics adoption is categorized into
different levels of strength within each industry. The
industries represented in the graph are Resources &
Pharma, Electronics & Mechanics, Vehicles, Other
manufacturing, ICT-Hardware & Services, Utilities
& Construction, Trading, Logistics, Tourism, Service
providers, and Banks & Insurance.
From the chart in fig 7 we can draw the
following conclusions, the dominant category across
most industries is "Limited" adoption, indicating that
organizations have implemented Robotics to some
extent but with restricted scope or scale. Industries
such as Resources & Pharma, Electronics &
Mechanics, Vehicles, Other Manufacturing, ICT-
Hardware & Services, Utilities & Construction,
Trading, Logistics, Service Providers, and Banks &
Insurance exhibit higher percentages in the
"Limited" adoption category. The "Very Limited"
adoption category generally shows lower
percentages across the industries, suggesting that
organizations have either not yet started adopting
Robotics or have only implemented it at a minimal
level. Notable examples of this trend can be seen in
the Resources & Pharma, Electronics & Mechanics,
Vehicles, Other Manufacturing, ICT-Hardware &
Services, Utilities & Construction, Tourism, and
Service Providers industries. The Trading industry
stands out with a relatively higher percentage of
"Very Strong" adoption, indicating a more
significant implementation of Robotics compared to
other industries.
Figure 7: Industry adoption of Robotics (&).
ICEIS 2024 - 26th International Conference on Enterprise Information Systems
680
Similarly, the Utilities & Construction
industry shows a higher percentage of "Strong"
adoption, implying a more advanced level of
adoption in this sector. The data indicates that
Robotics adoption varies across industries, with
some industries reporting higher adoption levels
and others reporting minimal or no adoption. This
suggests that certain industries may have a
higher propensity for leveraging Robotics
technology, possibly due to operational
requirements or their business processes. The
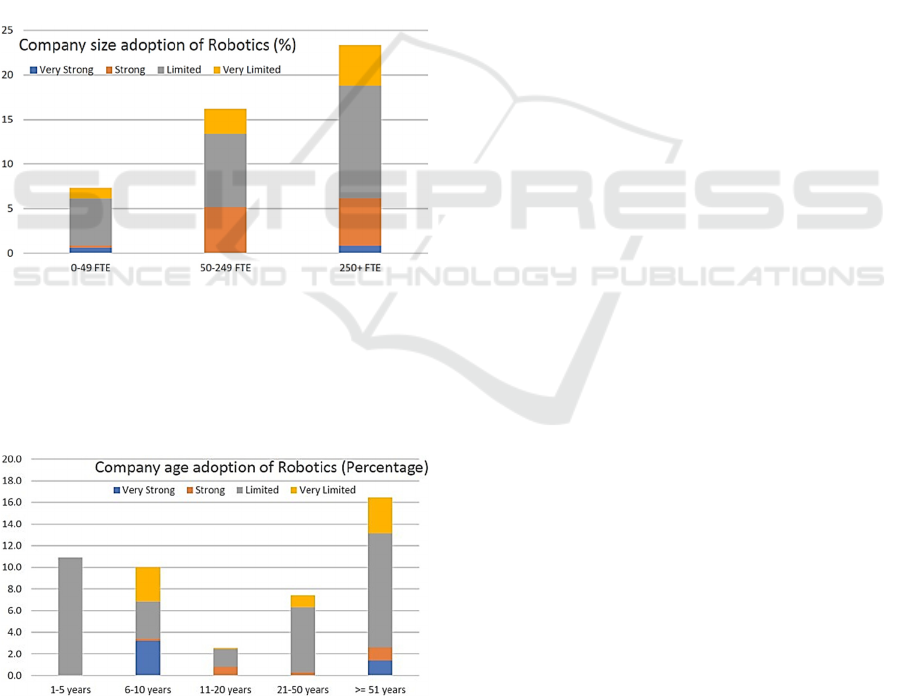
following graph in fig 8 provides an overview
of the company size distribution of Robotics
adoption. It shows that Robotics adoption varies
across company size, with larger companies
having higher percentages of "Strong" and "Limited"
adoption.
The
percentages
of
"Very
Strong"
adoption are relatively low across all company sizes,
indicating a limited implementation of Robotics.
Figure 8: Company size adoption of Robotics (%).
Lastly, the company age distribution for the
adoption of Robotics, showing older organizations
and 6-10 year old companies have a higher
likelihood of implementing Robotics solutions is
being shown in fig 9.
Figure 9: Age company Robotics adoption (%).
Comparative study of Robotics adoption across
sectors, displaying the distribution of instances
within each degree of adoption strength. various
degrees of Robotics deployment, with certain
industries having a greater number of examples with
significant acceptance than others. This data can be
useful for assessing the current level of Robotics
usage in various industries and identifying areas
where more investment may be required.
Overall, the data demonstrates the various levels
of Robotics usage across industries, where larger
and younger organizations tend to have the highest
likelihood of implementing robotics, especially if
they are active in Trading, Utilities/Construction, or
Electronics & Mechanics industries. This data
provides valuable insights into the current landscape
of Robotics adoption in different sectors and can
guide decision-making, investment strategies, and
resource allocation to promote broader adoption and
maximize the potential benefits of Robotics in
various industries.
Industry Adoption of Automation. Resource and
talent availability is a major obstacle to automation
adoption, with few having the right skills to
benefit from automation. Mastering digital skills,
and budgetary restraints are the top barrier to
limiting automation. It is important for members of
the C-suite to grow their IT knowledge and
communicate with the frontlines of IT and business
to allocate resources and hands-on support
appropriately. The following graph in fig 10
illustrates the percentage of cases where Automation
adoption is categorized into different levels of
strength within each industry. The industries
represented in the graph are Resources & Pharma,
Electronics & Mechanics, Vehicles, Other
manufacturing, ICT-Hardware & Services, Utilities &
Construction, Trading, Logistics, Tourism, Service
providers, and Banks & Insurance. From the provided
data, several conclusions can be drawn regarding
automation adoption across different industries. The
table demonstrates that the percentages of automation
adoption vary significantly among industries. Some
industries show higher levels of adoption across all
categories, such as Tourism with 22% adoption in the
"Very Strong" category. On the other hand, certain
industries exhibit lower adoption percentages, like
Utilities & Construction with only 6% in the "Strong"
category.
Across most industries, the combined
percentages of "Strong" and "Limited" adoption are
relatively high. This indicates a substantial
implementation of automation technologies in
various sectors, with Electronics & Mechanics, ICT-
Hardware & Services, and Trading industries
displaying notable percentages in both categories.
AI Technology Adoption & Sustainability Improvement Though Cloud Solutions
681
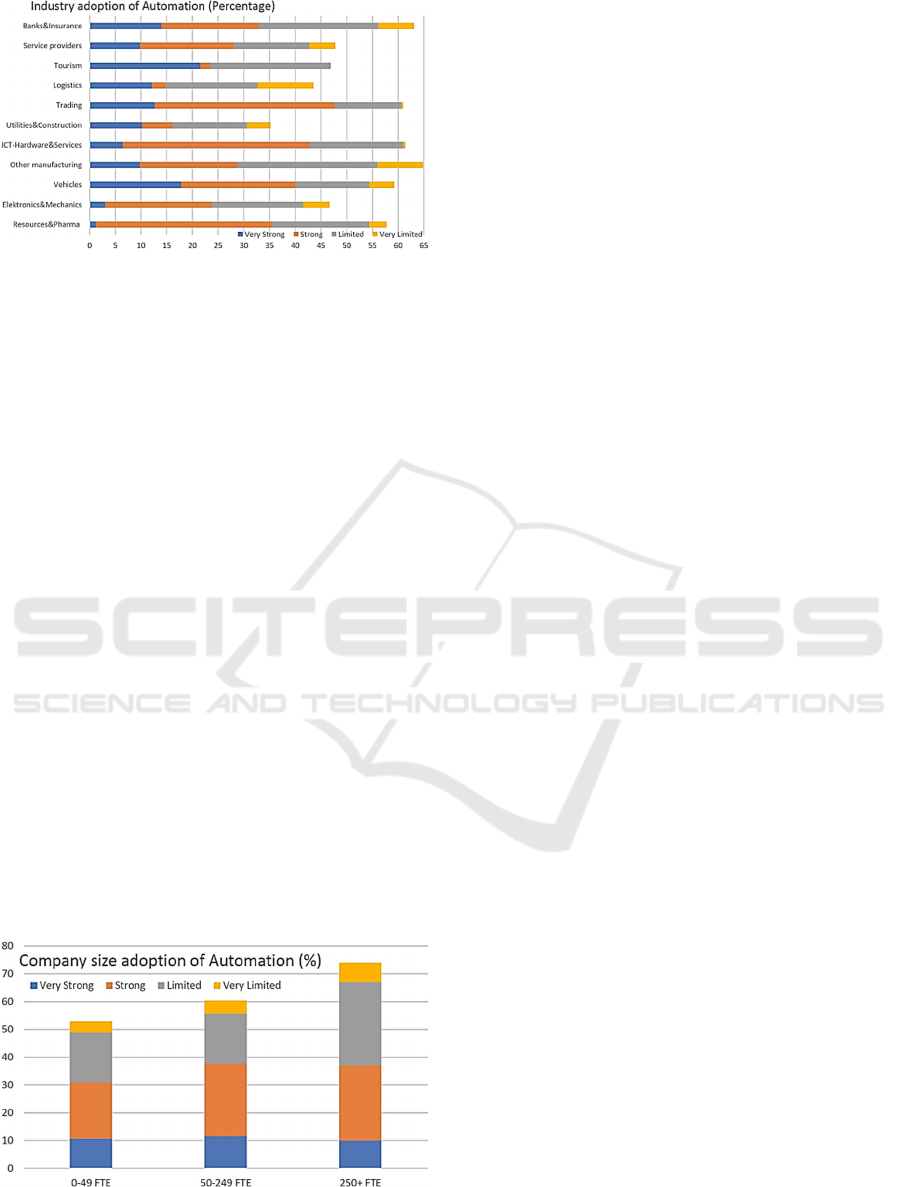
Figure 10: Industry adoption of Automation (%).
The data suggests that the "Very Strong" adoption of
automation technologies is less prevalent across
industries. However, some sectors stand out with
notable percentages in this category, including
Vehicles (18%), Tourism (22%), and Banks &
Insurance (14%). There are instances where
industries have significant percentages of adoption
falling under the "Limited" and "Very Limited"
categories. Notably, the Other Manufacturing
industry demonstrates a substantial proportion of
adoption in these categories, with 27% in the
"Limited" and 9% in the "Very Limited" categories.
Each industry has its own unique pattern of
adoption. For example, the Resources, Pharma,
Electronics & Mechanics, and ICT-Hardware &
Services industries have a higher concentration of
adoption in the "Strong" category. Conversely, the
Logistics industry shows higher adoption in the
"Very Limited" category compared to others.
The following graph fig 11 provides an overview
of the company size distribution of Automation
adoption. It shows that Automation adoption varies
across company size, with larger companies having
higher percentages of "Strong" and "Limited"
adoption. The percentages of "Very Strong"
adoption are relatively low across all company sizes,
indicating a limited implementation of Automation.
Figure 11: Adoption of Automation (%).
Lastly, we would like to show the company age
distribution in fig 12 for the adoption of
Automation, showing organization age not having a
strong influence on the likelihood of implementing
Automation solutions, with a positive outlier on the
6-10 year aged organizations.
In conclusion, the data reveals that automation
adoption varies across industries, with some sectors
demonstrating higher rates of adoption in the
"Strong" and "Limited" categories, while others
have lower adoption levels or a greater percentage of
cases falling into the "Very Limited" category. This
indicates the presence of industry-specific trends and
highlights the need for further investigation into the
factors influencing adoption patterns. Larger
organizations tend to have the highest likelihood of
implementing Automation. Understanding these
variations can help guide decision-making and
resource allocation to promote increased automation
implementation where needed.
4.4 Industry Adoption of Analytics
To improve decision making, data must be examined
through analytics. However, there are significant
Data problems that businesses face. These include
data quality, storage, a paucity of data science
personnel, data validation, and data aggregation
from many sources. The graph provided illustrates
the percentage of cases where analytics adoption is
categorized into different levels of strength within
each industry. The industries represented in the
graph are Resources & Pharma, Electronics &
Mechanics, Vehicles, Other manufacturing, ICT-
Hardware & Services, Utilities & Construction,
Trading, Logistics, Tourism, Service providers, and
Banks & Insurance. In fig 13 the adoption of
analytics in the Resources, Pharma industry is
shown to be relatively low, with the majority of
cases falling under the "Limited" adoption category.
The Electronics & Mechanics industry has a
balanced distribution of analytics adoption across all
categories, but the percentage of cases with
"Limited" adoption is the highest. The Vehicles
industry shows a moderate level of analytics
adoption, similar to the Vehicles industry. Other
Manufacturing is distributed across all adoption
categories, but the percentage of cases with
"Limited" adoption is the highest. ICT-Hardware &
Services industry stands out with a significant
analytics adoption.
ICEIS 2024 - 26th International Conference on Enterprise Information Systems
682
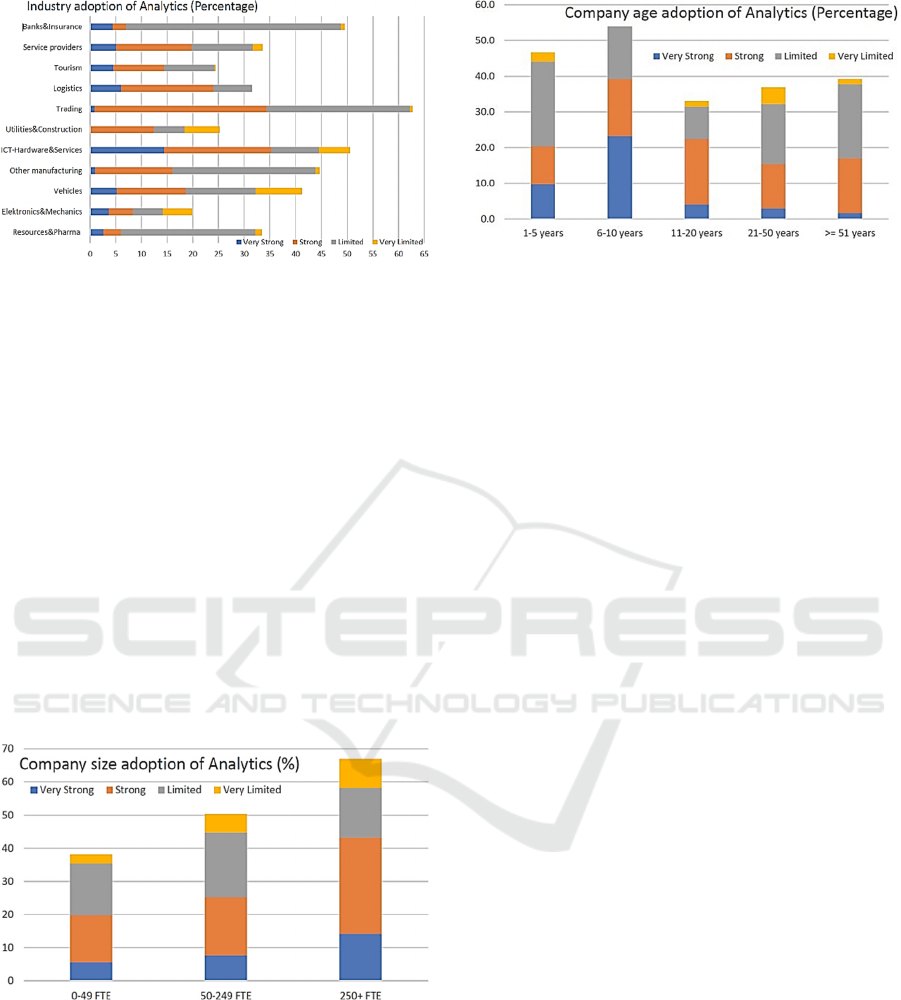
Figure 13: Industry adoption of Analytics (%).
The Trading industry has a high percentage of cases
with "Limited" and "Very Limited" analytics
adoption. The Logistics industry is relatively
balanced across the "Strong," "Limited," and "Very
Limited" adoption categories. The Tourism industry
demonstrates a distributed adoption of analytics
across all categories, with a significant percentage of
cases falling into the "Limited" adoption category.
The Service Providers industry has a relatively
balanced distribution of analytics adoption.
The following graph provides an overview of the
company size distribution of Analytics adoption. It
shows that Analytics adoption varies across
company size, with larger companies having higher
percentages of "Strong" and "Limited" adoption.
The percentages of "Very Strong" adoption are
relatively low across all company sizes, indicating a
less widespread implementation of Analytics.
Figure 14: Analytics Adoption company size(%).
Lastly, we would like to show the company age
distribution for the adoption of Analytics, showing
younger organizations have a higher likelihood of
implementing Analytics solutions. Whilst the
intensity of implementation does not differ much
over age.
Figure 15: Analytic adoption company size(%).
4.5 Industry Adoption of IoT
Data security and privacy are two of the most
serious difficulties associated with IoT. Massive
volumes of data are generated and collected by IoT
devices, which may contain sensitive and personal
information. This information may be subject to
cyberattacks, breaches, theft, or misappropriation by
hackers, rivals, or other parties. The following graph
illustrates the percentage of cases where IoT
(Internet of Things) adoption is categorized into
different levels of strength within each industry. At
the forefront of IoT adoption represented are the
industries Trading and Vehicle-Manufacturing with
near firm-wide adoption around 10 percent, followed
by Electronics/Mechanics and Logistics at 5%.
However at the business unit level also Other-
Manufacturing, Utilities/Construction with near a
quarter adoption, followed by ICT-hardware &
Services are strongly represented at 12-16%. This
level of adoption is reflecting how IoT enables
improved productivity and operational efficiency.
The top reasons companies have adopted IoT are
increased efficiency of operations and increased
employee productivity. Please review Figure 1 and
table 4.2 for more details IoT adoption in Resources
and Pharma is generally low, mostly categorized as
"Limited." There is potential for growth in
implementing IoT technologies. Electronics &
Mechanics show moderate adoption, with a notable
percentage in the "Limited" category, suggesting the
need for further integration. The Vehicles industry
has a mixed pattern, with a significant "Limited"
adoption, indicating potential for more
implementation. Other Manufacturing has a
balanced IoT adoption, with notable cases in both
"Strong" and "Limited" categories, but there is room
for improvement. ICT-Hardware & Services
demonstrate a moderate level of adoption, especially
in the "Limited" category, indicating potential for
further integration.
AI Technology Adoption & Sustainability Improvement Though Cloud Solutions
683
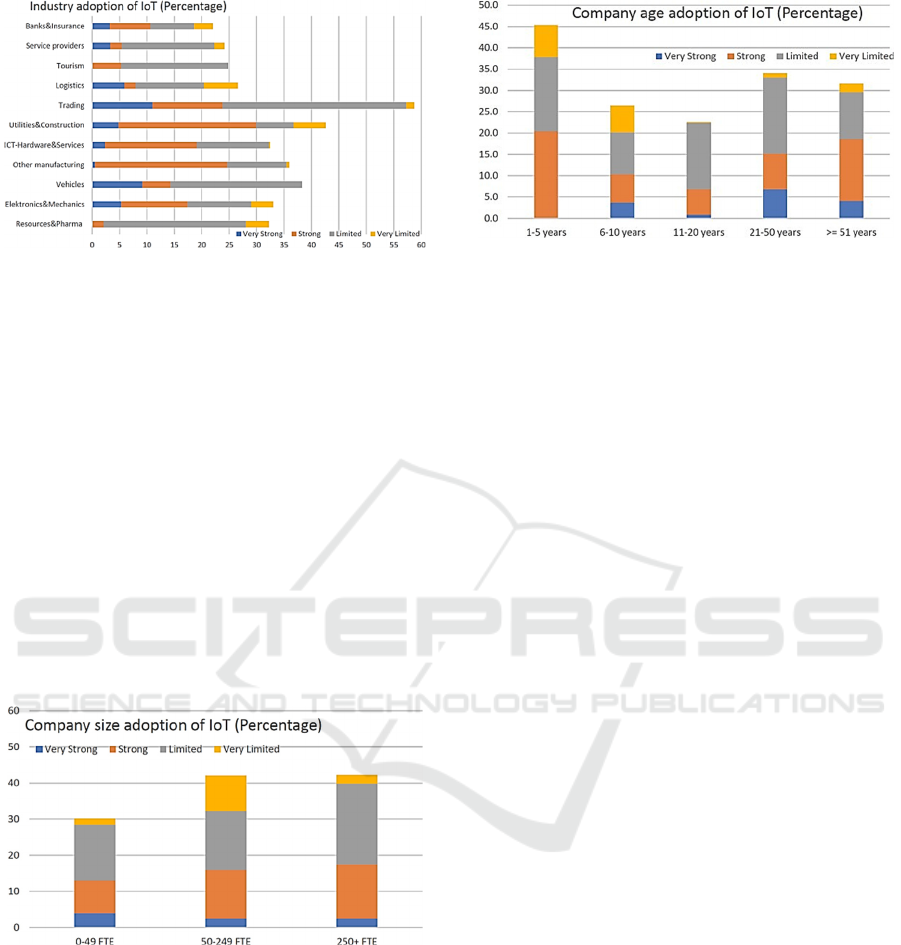
Figure 16: Industry adoption of IoT (%).
Utilities & Construction exhibit relatively high
adoption, particularly in "Strong" and "Limited"
categories. The Trading industry has a high
percentage of "Limited" adoption, indicating a need
for increased utilization. Logistics shows a balanced
adoption, suggesting a moderate level of
implementation.
In Tourism, there's notable "Limited" adoption,
indicating potential for increased utilization. Service
Providers exhibit balanced adoption, with room for
improvement. Banks & Insurance show a moderate
level of adoption across categories, suggesting
further potential. The graph illustrates varied IoT
adoption across company sizes, with larger and
medium companies having higher percentages of
"Strong" and "Limited" adoption. Medium-sized
companies notably show strong implementation
Figure 17: Company size adoption of IoT (%).
Lastly, we would like to show the company age
distribution for the adoption of IoT, showing
younger organizations have a higher likelihood of
implementing IoT solutions.
In summary, the graph provides a comparative
analysis of IoT adoption across different industries,
showcasing the distribution of cases within each
level of adoption strength. It highlights the varying
levels of IoT implementation, with some industries
having a higher proportion of cases with limited
adoption, while others have a more balanced
Figure 18: Company size adoption of IoT (%).
distribution across different adoption categories.
Larger organizations tend to have the highest
likelihood of implementing IoT, especially if they
are active in Vehicles production or Trading
industries. This information can be valuable for
understanding the current state of IoT adoption in
different sectors and identifying areas where furthr
investment and implementation may be needed.
4.6 Cloud-Enabled Sustainability
Cloud computing has the potential to improve
energy efficiency while emitting less greenhouse
gases than on-premises IT systems. The following
graph provided provides a comparative analysis of
the percentage of cases where energy usage has
decreased as a result of cloud usage, categorized by
adoption strength and industry type. In the
Resources & Pharma, Electronics & Mechanics, and
Vehicles industries, most cases reported a reduction
in energy usage, with percentages of 62.2%, 65.2%,
and 69.8% respectively. Other manufacturing had a
lower percentage (47.1%) indicating a decrease,
while ICT-Hardware & Services stood out with a
significantly high proportion (75.5%) reporting a
decrease. The Utilities & Construction, Trading, and
Tourism industries also showed a notable percentage
of cases reporting a decrease in energy usage
through cloud adoption, with percentages of 58.9%,
64.0%, and 58.5% respectively. Logistics and
Service providers had slightly lower percentages
(54.2% and 61.2% respectively), but still showed a
significant reduction in energy usage. In contrast, the
Banks & Insurance industry had a relatively high
percentage (68.7%) indicating a decrease in energy
usage, while the percentage of cases responding with
no change was 31.3%. The fig 19, with YES on the
left and NO on the right, provides a clear
comparison of the percentage of cases reporting a
decrease in energy usage through cloud adoption and
those responding with no change in energy usage
across different industries.
ICEIS 2024 - 26th International Conference on Enterprise Information Systems
684
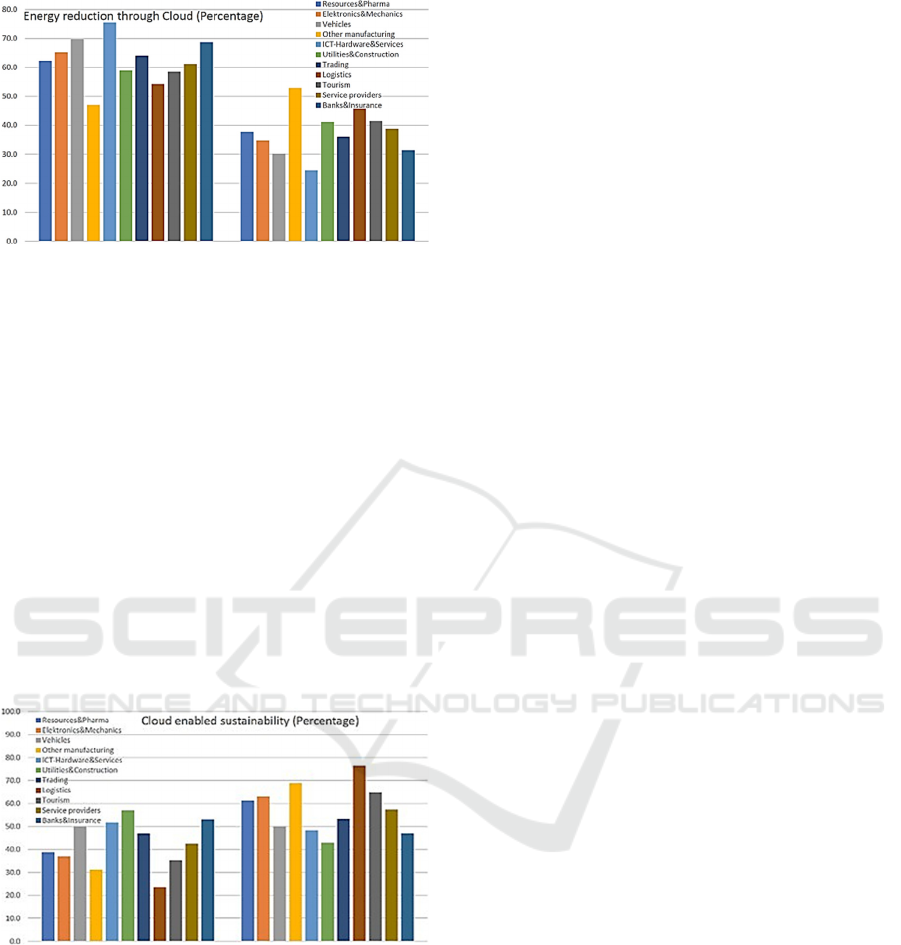
Figure 19: Cloud energy reduction (%).
We also examined the impact of cloud adoption on
sustainable energy usage across various industries.
One of the primary benefits of cloud storage is that it
eliminates the need for physical infrastructure and
equipment such as servers, cooling systems, and
power supply. As a result, cloud storage can reduce
the quantity of greenhouse gas emissions and waste
produced by your data storage activities. The
analysis shown in fig 20, with YES on the left and
NO on the right, revealed a diverse range of
outcomes, indicating that the relationship between
cloud usage and sustainable energy usage is not
uniform across industries. The following graph
provides a comparative analysis of the percentage of
cases where sustainable energy usage has increased
because of cloud usage, categorized by adoption
strength and industry type.
Figure 20: Cloud-enabled sustainability (%).
Among the industries investigated, Resources
& Pharma exhibited a higher percentage (38.7%)
of cases reporting an increase in sustainable
energy usage due to cloud adoption. However, the
majority (61.3%) responded negatively. Similarly,
Electronics & Mechanics showed a similar trend,
with 37.0% reporting an increase and 63.0%
reporting no change in sustainable energy usage.
Interestingly, the vehicles industry displayed an
equal distribution, with 50.0% of cases reporting an
increase in sustainable energy usage because of
cloud adoption and an equal 50.0% responding
negatively. Other manufacturing had a higher
proportion (31.1%) reporting an increase, but the
majority (68.9%) still responded negatively. In
contrast, ICT-Hardware & Services showed a higher
percentage (51.6%) reporting an increase in
sustainable energy usage due to cloud adoption.
Utilities & Construction followed suit, with 57.0%
reporting an increase. However, both Trading and
Tourism industries had a larger proportion
responding negatively. Notably, Logistics had a
relatively low percentage (23.5%) reporting an
increase, while Service providers and Banks &
Insurance had higher proportions (42.6% and 53.0%
respectively) indicating an increase in sustainable
energy usage. The findings suggest that the impact
of cloud adoption on sustainable energy usage varies
across industries. Factors such as industry-specific
characteristics and implementation strategies likely
contribute to this variation. Further research is
needed to understand the underlying mechanisms
and identify best practices for maximizing the
positive effects of cloud adoption on sustainable
energy usage in each industry. Such insights can
inform decision-making processes and guide future
sustainability initiatives in these sectors.
5
CONCLUSION
Digitization provides society and the economy with
huge opportunities for growth and efficiency. Many
business models, particularly those of new and
innovative enterprises, would not exist without
powerful cloud technologies such as AI. However,
established businesses are increasingly profiting
from digital technology. The increasingly visible
impacts of a skilled labour scarcity can be mitigated
by home offices, which can attract competent people
from all over the world. However, digitalization
incurs costs and has negative externalities. The high-
power usage and related environmental impact can
be major roadblocks here.
Sustainability initiatives should not be used to
undermine digitization; both ideas must exist and
function in tandem. This is where highly specialized
technology firms come in, playing an increasingly
important role in enabling boundary-pushing
technologies while lowering environmental impact.
Process automation solutions are available in 56
percent of businesses, while data analytics are
available in 46.8 percent of businesses that feel very
or moderately supported. Artificial intelligence is
used by 15.2 percent of businesses, while machine
AI Technology Adoption & Sustainability Improvement Though Cloud Solutions
685

learning is used by 14.2 percent and robotics is used
by 6.2 percent, demonstrating how rapidly
technologies are being embraced. There is a definite
technological competence across all firms, and
digital technologies are being implemented in every
area. Cloud is assisting businesses in minimizing
their environmental footprint by lowering energy
requirements for 64.5 percent of businesses.
Renewable energy sources are important to 38.9
percent of businesses. Particularly in view of
additional increases in power use because of
digitalization and the rising greener business models
of cloud, the corporate landscape is projected to
assist the corporate landscape decarbonize even
more in the future.
The utilization of the cloud appears to help
sectors rely on forward-thinking technology. Against
the backdrop of the immense economic potential of
industry's constant digitalization, cloud allows AI
and sustainability, assuring firms have a fair chance
of profiting. Organizations should convene a cross-
functional group to identify and prioritize the
highest-value use cases and enable coordinated and
safe implementation across the organization.
Companies must create scalable data architectures,
upgrade current computing & tooling infrastructure,
and build a "lighthouse" approach to take advantage
of AI. Proof-of-concept is still the best way to
quickly test and refine a valuable business case
before scaling. Business leaders must balance value
creation opportunities with risks associated with AI
and prioritize use cases that align with their risk
tolerance. Organizations need to adapt their working
approach to handle the rapidly evolving regulatory
environment and risks of AI at scale and partner
with the right companies to accelerate execution.
Companies need to experiment with and deploy
innovative technologies at an early stage,
establishing technology-based competitive edge
based on these technologies. As a result, such
businesses not only assure their own long-term
existence but also contribute to the spread of new
technology outside industry lines. Our study
contributes to the literature on innovation
management by putting light on the application of
AI and machine learning algorithms in the future
organization of innovation. Our findings suggest
areas where AI systems may already be used to
benefit organizational innovation.
REFERENCES
Agrawal, A., Gans, J., & Goldfarb, A., (2019) The
Economics of Artificial Intelligence: An Agenda
Agrawal, R., Gopalakrishnan, A., & Gupta, M. (2013).
The impact of cloud computing on IT outsourcing.
MIS Quarterly Executive, 12(2), 61-72.
Ahmad, Tanveer, et al. "Artificial intelligence in
sustainable energy industry: Status Quo, challenges
and opportunities." Journal of Cleaner Production 289
(2021): 125834.
Aljabre, A. (2017). The impact of cloud computing on
business performance: A conceptual framework.
Journal of Economic and Administrative Sciences,
33(1), 22-36.
Allahvirdizadeh, Yousef, Mohsen Parsa Moghaddam, and
Heidarali Shayanfar. "A survey on cloud computing in
energy management of the smart grids." International
Transactions on Electrical Energy Systems 29.10
(2019): e12094.
Antonopoulos, Ioannis, et al. "Artificial intelligence and
machine learning approaches to energy demand-side
response: A systematic review." Renewable and
Sustainable Energy Reviews 130 (2020): 109899.
Armbrust, M., Fox, A., Griffith, R., Joseph, A. D., Katz,
R. H., Konwinski, A., ... & Zaharia, M. (2010). A view of
cloud computing. Communications of the ACM,
53(4), 50-58.
Assunta Di Vaioa, , Rosa Palladino, Rohail Hassan,
Octavio Escobar (2020) Artificial intelligence and
business models in the sustainable development goals
perspective: A systematic literature review
Attaran, Mohsen, and Jeremy Woods. "Cloud computing
technology: improving small business performance
using the Internet." Journal of Small Business &
Entrepreneurship 31.6 (2019): 495-519.
Bardhan, I. R., Jafarizadeh, S., & Talley, W. K. (2010).
Cloud computing: implications for enterprise software
vendors. Proceedings of the 2010 ACM Symposium
on Applied Computing, 1531-1536.
Burtell, M., Woodside, T., (2023) Artificial Influence: An
Analysis Of AI-Driven Persuasion. Computers and
Society a r X i v :2303.08721
Buyya, Rajkumar, et al. "A manifesto for future generation
cloud computing: Research directions for the next
decade." ACM computing surveys (CSUR) 51.5
(2018): 1-38.
Cao, J., Yu, Z., Ma, Y., & He, Y. (2014). Impact of cloud
computing on enterprise innovation: Empirical
evidence from Chinese enterprises. International
Journal of Information Management, 34(5), 626-640.
Chang, V., Walters, R. J., & Wills, G. (2013). The
development that leads to the adoption of cloud
computing in the UK SME sector. Journal of
Small Business and Enterprise Development, 20(2),
296-312. Enholm, Papagiannidis, Mikalef,
Krogstie.(2021) Artificial Intelligence and Business
Value: a Literature Review
Gill, Sukhpal Singh, et al. "Transformative effects of IoT,
Blockchain and Artificial Intelligence on cloud
ICEIS 2024 - 26th International Conference on Enterprise Information Systems
686

computing: Evolution, vision, trends and open
challenges." Internet of Things 8 (2019): 100118.
Goscinski, A., Brock, M., & Tangasova, B. (2011). The
challenges of cloud computing adoption. Proceedings
of the 2011 International Conference on Parallel and
Distributed Processing Techniques and Applications,
409-415.
Gupta, M., Agrawal, R., & Gopalakrishnan, A. (2019).
Cloud computing and digital capabilities: A systematic
review and future research directions.
Hummer, Waldemar, et al. "Modelops: Cloud-based
lifecycle management for reliable and trusted ai." 2019
IEEE International Conference on Cloud Engineering
(IC2E). IEEE, 2019.
Kaisler, S., Armour, F., Espinosa, J. A., & Money, W.
(2013). Big data: issues and challenges moving
forward. Proceedings of the 46th Hawaii International
Conference on System Sciences, 995-1004.
Kakatkar, Chinmay & Bilgram, Volker & Füller, Johann,
2020. "Innovation analytics: Leveraging artificial
intelligence in the innovation process," Business
Horizons, Elsevier, vol. 63(2), pages 171-181.
Keding, Christoph & Meissner, Philip, 2021. "Managerial
overreliance on AI-augmented decision-making
processes: How the use of AI-based advisory systems
shapes choice behavior in R&D investment decisions,"
Technological Forecasting and Social Change,
Elsevier, vol. 171(C).
Kshetri, N. (2014). Cloud computing adoption by SMEs in
the north-central United States. Journal of Global
Information Management, 22(4), 17-34.
Lacity, M. C., Willcocks, L. P., & Kern, T. (2010). The
value of selective IT sourcing. Sloan Management
Review, 51(2), 75-83.
Lee, Ya-Ching. "Adoption intention of cloud computing at
the firm level." Journal of Computer Information
Systems 59.1 (2019): 61-72.
Marston, S., Li, Z., Bandyopadhyay, S., Zhang, J., &
Ghalsasi, A. (2011). Cloud computing—The business
perspective. Decision Support Systems, 51(1), 176-
189.
Montori, Federico, et al. "Machine-to-machine wireless
communication technologies for the Internet of
Things: Taxonomy, comparison and open issues."
Pervasive and Mobile Computing 50 (2018): 56-81.
Mühlroth, Christian & Grottke, Michael. (2020). Artificial
Intelligence in Innovation: How to Spot Emerging
Trends and Technologies. IEEE Transactions on
Engineering Management. PP. 1-18. 10.1109/TEM.20
20.2989214.
Quantumblack (2022), The state of AI in 2022—and a half
decade in review, quantumblack/our-insights/the-state-
of-ai-in-2022-and-a-half-decade-in-
review?cid=app#review
Stephan Schlögl, Claudia Postulka, Reinhard Bernsteiner
& Christian Ploder
Wan, J., Yang, J., Wang, Z., & Hua, Q. (2018). Artificial
intelligence for cloud-assisted smart factory. IEEE
Access, 6, 55419-55430.
Weill, P., Ross, J. W., & Robertson, D. C. (2013).
Enterprise Architecture as Strategy: Creating a
Foundation for Business Execution. Harvard Business
Press.
AI Technology Adoption & Sustainability Improvement Though Cloud Solutions
687
