
Enhancing Scientific Communication: Prioritizing User Experience in
Audiovisual Interfaces
Cintia Braz Mesquita
a
, Adriana Barbosa Santos
b
and Rog
´
eria Cristiane Grat
˜
ao de Souza
c
Department of Computer Sciences and Statistics, UNESP – S
˜
ao Paulo State University,
S
˜
ao Jos
´
e do Rio Preto, S
˜
ao Paulo, Brazil
Keywords:
Usability, Human-Computer Interaction, Scientific Communication, Audiovisual.
Abstract:
Audiovisual content has emerged as a powerful tool for scientific communication, enabling a broader reach,
clearer explanations of complex topics, and greater recognition for researchers. To maximize its impact and
fully unleash its potential, accessible and user-friendly interfaces are needed on platforms and mobile apps.
This work prioritizes the identification of essential usability requirements for interfaces featuring scientific
audiovisual content, aiming to streamline development efforts. Drawing from established literature and an
analysis of existing web platforms and mobile apps, we have identified 25 key usability metrics to guide
the creation of interfaces that prioritize user experience. Empirical evaluations of these platforms and apps
have revealed significant deficiencies in meeting usability criteria such as effectiveness, efficiency, and user
satisfaction.
1 INTRODUCTION
Science communication is the diffusion of scientific
research and knowledge in a simple and understand-
able approach to the general public. This not only
allows for the democratization of scientific knowl-
edge, enhancing education, but also promotes debates
on topics that directly impact people’s lives (Lord
ˆ
elo
and de Magalh
˜
aes Porto, 2012). However, the tradi-
tional methods of sharing scientific discoveries, pri-
marily through written publications, can be costly for
both authors and readers. Additionally, these methods
predominantly reach individuals within the academic
sphere, thereby limiting the diversity and size of the
audience.
During the last years, there has been significant
growth in the consumption of videos and podcasts.
This trend is so pronounced that newer generations
exhibit different views and behaviors regarding the
consumption of content in these formats (Lagger
et al., 2017). With its continuous rise, the audiovi-
sual format presents a new channel for scientific com-
munication (Santos, 2022). This format enables the
reach to diverse audiences, facilitating the dissemina-
tion of complex concepts and fostering new types of
a
https://orcid.org/0009-0006-1822-6018
b
https://orcid.org/0000-0003-4076-2475
c
https://orcid.org/0000-0002-7449-9022
interaction.
Despite numerous initiatives aiming to dissemi-
nate scientific knowledge, the study of applications
with audiovisual content is limited primarily to the
realm of online learning (Kim and Kim, 2021).
Therefore, dedicated platforms featuring video arti-
cles, research results, and application offer valuable
opportunities for learning and for stimulating new
publications focused on the audiovisual format.
Recognizing the transformative potential of such
applications for democratizing scientific knowledge,
this study delves into the development of user-
friendly and accessible solutions for disseminating
scientific videos. As the quality of an interface largely
depends on the product’s usability, there is consider-
able interest in studying the interface of these plat-
forms and applications. This is particularly true for
the factors that influence user experience and the
unique conditions for audiovisual media, thought for
simplifying and enhancing its development (ISO/IEC
25010, 2011).
This work prioritizes the identification of essen-
tial usability requirements for interfaces that handle
scientific audiovisual content. Our aim is to guide
development efforts and enhance the effectiveness of
this format as an alternative for scientific communi-
cation. As a significant contribution to usability stud-
ies for audiovisual interfaces, we introduce 25 usabil-
ity metrics. These are suggested specifically for web
Mesquita, C., Santos, A. and Gratão de Souza, R.
Enhancing Scientific Communication: Prioritizing User Experience in Audiovisual Interfaces.
DOI: 10.5220/0012616700003690
Paper published under CC license (CC BY-NC-ND 4.0)
In Proceedings of the 26th International Conference on Enterprise Information Systems (ICEIS 2024) - Volume 2, pages 369-377
ISBN: 978-989-758-692-7; ISSN: 2184-4992
Proceedings Copyright © 2024 by SCITEPRESS – Science and Technology Publications, Lda.
369

platforms and applications that deal with audiovisual
scientific content. The metrics are organized based on
three key usability criteria: effectiveness, efficiency,
and user satisfaction. Additionally, we propose a pri-
ority scale to assist in evaluation and to inform the
development process of these interfaces, keeping in
mind the goal to effectively communicate science and
reach a wider audience.
2 BACKGROUND
The diversity of web platform users, each with spe-
cific skills and restrictions, must be considered during
its development to guarantee broad and unrestricted
access to the resources and information made avail-
able. Therefore, usability represents an essential qual-
ity characteristic to facilitate access and keep users
engaged on a specific platform. In a complementary
way, the format of the content available on a platform
must also be properly designed, considering an alter-
native capable of disseminating knowledge in an agile
and efficient way, such as videos.
In this context, section 2.1 highlights the impor-
tance of usability, focusing on audiovisual content.
Section 2.2 highlights the shortcomings involving
the interface of current platforms that publish videos
about scientific research.
2.1 Usability
The user interface contributes significantly to the suc-
cess of software; therefore, for software to be widely
used and accepted, it is necessary to ensure that the
interaction between the user and the software is sat-
isfactory. In this sense, usability serves as an indica-
tion for assessing how well a user interface meets the
user’s needs.
Usability is one of the eight product quality at-
tributes according to ISO/IEC 25010:2011, a refer-
ence model for assessing software quality (ISO/IEC
25010, 2011). It is defined as the extent to which
a system can be used by specific users in a given
environment effectively, efficiently, and satisfactorily
(ISO 9241-11, 2018).
Effectiveness is the user’s capacity to achieve its
objectives when carrying out the interaction and the
level of quality attained. Efficiency is the effort
needed to accomplish a task, including any devia-
tions or mistakes committed. Satisfaction refers to the
user’s acceptance and comfort during the interaction
(ISO 9241-11, 2018). Therefore, effectiveness, effi-
ciency, and user satisfaction represent criteria used to
assess usability.
While usability focuses on the quality of the user
experience, accessibility aims to eliminate barriers so
everyone can enjoy the digital world, regardless of
their individual needs (Consortium et al., 2018).
The usability of a software system is influenced
by several factors, such as functionality, aesthetics,
and reliability. Therefore, given the subjective and
qualitative nature of this metric, ensuring a good ex-
perience with the product requires testing and user re-
search to evaluate the ease of use and acceptability of
a system to guarantee a positive user experience. The
most used practices are questionnaires, usability tests,
and heuristic evaluation (Nugroho et al., 2022).
Heuristic evaluation is one of the most popular
techniques for assessing usability, consisting of a
small team of examiners who will thoroughly inves-
tigate the interface and determine whether the system
complies with usability heuristics, which are simple
strategies that guide the design of interfaces (Nielsen,
1995).
A popular and well-known set of heuristics for
user interface design, called Nielsen’s Heuristics, pro-
vided the foundation for other specialized heuristics
(Nielsen, 1994b). For instance, Eliseo et al. (2017)
uses Nielsen’s ten heuristics to evaluate the usability
of interfaces of five well-known websites with audio-
visual content.
Regarding usability for video content, Shade
(2014) presents usability principles for videos based
on Nielsen heuristics. However, these principles are
very simplified and subjective. Therefore, there’s a
need for more specific guidelines to guide the devel-
opment of audiovisual interfaces.
2.2 Audiovisual Scientific Interfaces
Videos have become one of the most popular formats
for sharing information. Audiovisual scientific in-
terfaces, a type of human-computer interaction, use
sound and vision to represent and interact with scien-
tific data, communicate scientific results, and educate
the public about science. In recent years, scientific
videos have become more accessible to people, with
production and sharing becoming more widespread
(Rosenthal, 2020). These videos can be found on gen-
eral video websites, such as YouTube, or specific plat-
forms for scientific videos with an important impact
on knowledge transfer and particularly for improve-
ment of science communication and research activi-
ties focusing on content, authorship, epistemic qual-
ity and impacts on science communication(Boy et al.,
2020).
We searched related works of audiovisual scien-
tific interfaces to find, understand, and analyze scien-
ICEIS 2024 - 26th International Conference on Enterprise Information Systems
370

tific audiovisual interfaces. As a result, we selected a
group of five web platforms and five mobile applica-
tions. The selection considered aspects of the service
provided, such as the type of scientific videos, open
access, popularity, cost for publication, and science
areas accepted. As YouTube is not a specific platform
for scientific videos it was not considered in the fol-
lowing analysis.
2.2.1 Web Platforms
The ScienceTalks platform (available at
https://www.sciencetalks-journal.com/) is a sci-
entific journal in which publications are in video
format. It is open source, and all videos are available
for free viewing, but the publication has a fee.
The scientific video journal JoVE (available at
https://www.jove.com/) publishes scientific research
in audiovisual format. The platform is paid, with dif-
ferent plans for researchers and educational institu-
tions, while some videos are open access. Addition-
ally, for publishing a video, there is a publication fee.
Scivpro (available at https://scivpro.com/) is a sci-
entific audiovisual content platform launched in 2018
to present high-quality, professionally edited videos
for free. The publishing service is paid for and in-
cludes filming and editing of videos.
Latest Thinking (available at https://lt.org) is a
platform for scientific communication that seeks out
high-quality, publicly accessible videos. The con-
tent is open access; however, the videos are not peer-
reviewed. The publishing process is paid for by the
author or funding institution.
Finally, STEMcognito (available at
https://stemcognito.org/), founded in 2021, fo-
cuses on sharing scientific videos in the areas of
science, technology, engineering, and mathematics
- STEM. The videos are checked by experts in the
field but do not go through a peer review process, and
access to the videos is free. Video publishing is free
for authors in the education and nonprofit sectors.
2.2.2 Mobile Applications
The app Wonder Science (available on Apple Store
and Play Store) is a streaming service that shares sci-
ence videos of high artistic quality. The service is
paid, with a few free videos.
TED (available on Apple Store and Play Store) is
an application that shares videos of TED events and
conferences. All content is free and from a diverse set
of topics.
The app Scishow (available only on Play Store)
came from a YouTube channel, and all videos are free
with support for more than 15 languages.
NewScientist (available on Apple Store and Play
Store) is a scientific journal application for sharing
news in written and video formats. Part of the content
is free, but there is selected news for subscribers.
The NASA app (available on Apple Store and Play
Store) shares news and information about the organi-
zation with images, articles, and videos, all with free
access.
3 USABILITY METRICS FOR
INTERFACES WITH
SCIENTIFIC AUDIOVISUAL
CONTENT
This section presents the 25 usability metrics struc-
tured to develop and evaluate interfaces with scientific
audiovisual content. Furthermore, we adapted three
of these metrics, highlighting the necessary modifi-
cations according to the specificities of web applica-
tions. The usability metrics represent the result of
an extensive literature review on usability practices.
So, it represents a select and relevant set of metrics to
guide the creation of interfaces that prioritize user ex-
perience. We structured such metrics based on criteria
used to assess usability: effectiveness, efficiency, and
user satisfaction.
System Status - M01: The users should know
the current interaction status, which page or tab is
accessed, and how to exit from an action. Also, it
should warn the users of loading pages and if interac-
tions are working (Nielsen, 1994a; Consortium et al.,
2018).
Familiar Language - M02: Use familiar language
for text, icons, graphs, and other elements. The
user should be able to understand the words and
text easily, and technical terms and slang should be
avoided (Lakoff and Johnson, 2008).
Information Is Logically Presented - M03: Infor-
mation should be presented logically and naturally;
therefore, the users can intuitively navigate the
interface (Lakoff and Johnson, 2008).
Compatibility with Devices - M04: The interface
should be responsive since users access web content
from different devices; the interaction should happen
without problems and frustrations (Eliseo et al.,
2017).
Support for “undo” and Show How to Leave an
Interaction - M05: Users make mistakes, and offer-
Enhancing Scientific Communication: Prioritizing User Experience in Audiovisual Interfaces
371

ing the ”undo” option increases the user’s freedom
and control. Additionally, users should be able to exit
an interaction easily and without previous knowledge
(Nielsen, 1994a)
Links with a Purpose - M06: Links should be rec-
ognizable, with clear text and purpose understandable
by text or context (Consortium et al., 2018; Nielsen,
1995).
Consistency in Icons and Buttons - M07: Icons and
buttons should be consistent throughout the system
for easy recognition (Nielsen, 1994a).
Consistency Between Pages - M08: Pages should
have a consistent design following the system
patterns; this allows intuitive and straightforward
navigation (Nielsen, 1994a).
Warning Messages - M09: The system should
present visual warning messages in critical interac-
tions, especially when it’s impossible to undo the
action (Nielsen, 1995).
Help in Context - M10: Systems should offer help
and support according to the functionalities, pages,
or content accessed instead of long tutorials. For
Frequent Asked Questions (FAQ), there should be
divisions by context (Nielsen, 1995).
Search - M11: Search mechanisms should be
present, especially for systems with videos. Search
options facilitate navigation and save time and effort
(Eliseo et al., 2017).
Content and Interface Focus on the Essential -
M12: Avoid unnecessary information. The non-
essential content can pollute the interface’s design
and create a bad user experience (Nielsen, 1994b).
White Space - M13: The interface should be
designed with white space in mind; these spaces
allow a clear and better visual experience and fa-
cilitate finding the necessary content (Norman, 2007).
Use of Design Principles - M14: Design principles
such as scale, hierarchy, balance, and contrast can
guide the user’s attention more intentionally, along
with providing a pleasant visual experience (Poulin,
2018).
Errors Are Presented in Natural Language and
Following Standards - M15: Error messages should
be simple and direct, explaining the problem and
how to solve or avoid it. Standard error message
symbols, such as red text and attention signs, should
be followed (Nielsen, 1994b).
Subtitle and/or Transcription - M16: Offering
subtitles and transcriptions for videos allows users
with different needs and situations to access the
content (Eliseo et al., 2017; Consortium et al., 2018).
Response Time - M17: The response time of content
should not be prolonged, which might lead users to
get disinterested (Eliseo et al., 2017).
Information About the Videos - M18: Users should
get access to information about the videos, such as
summary, author, keywords, among others. Offering
this information helps the users decide whether to
engage with videos (Eliseo et al., 2017).
Video Control - M19: The user should have control
over the video, when it starts, stops, adjusts volume,
among others (Eliseo et al., 2017).
What and When to Watch - M20: The user should
be able to choose what, when, and how to watch the
videos (Eliseo et al., 2017).
Standard Video Control Icons - M21: Use standard
icons for video control so the users will be already
familiar with the interaction (Eliseo et al., 2017).
Appropriate Post-Video Action - M22: After
watching a video, the post-video action should be
adequate; avoid automatically starting new videos
or recommending nonrelated videos (Eliseo et al.,
2017).
Text Alternative - M23: Nontextual content, such
as images, videos, graphics, and icons, should have
an alternative text for screen readers and problems
fully loading content (Eliseo et al., 2017; Consortium
et al., 2018; Chiuchi et al., 2011).
Appropriate Color Usage - M24: Consider the
accessibility of the content, especially with the use of
colors, which should not be the only form to show an
element (Consortium et al., 2018).
Ability to Resize - M25: Content should be resized
up to 200% without loss of functionality (Consortium
et al., 2018).
Additionally, three metrics were adapted for mo-
bile applications promoting an appropriate approach
to the specific characteristics of these devices. These
ICEIS 2024 - 26th International Conference on Enterprise Information Systems
372

metrics are numbered with a double ”M” to differen-
tiate them from the corresponding metrics.
Video Transmission Performance - MM04: For
mobile applications, there is a higher concern
over transmission performance since the internet
connection is not stable. If the transmission is not
satisfactory, the video will demand time to begin and
load repeatedly, which affects the user experience
(Hussain et al., 2016).
Proper Sizes - MM06: Mobile devices have smaller
screens, and usually, the interaction is touch-based,
which needs adaptation for the size of buttons, text,
and images (Budiu, 2015).
Adjust Video Quality - MM25: Since mobile de-
vices have a limitation regarding connectivity, it is
necessary to allow users to adapt the video quality
according to their preferences and capacity (Hussain
et al., 2016).
In addition to structuring the metrics, the three us-
ability criteria (effectiveness, efficiency, and user sat-
isfaction) also supported the definition of a priority
system. Each metric was classified regarding usabil-
ity criteria affected by not attending to it. We establish
three priority levels: high, medium, and low. Tables 1
to 3 show the metrics grouped by priorities according
to criteria. This priority system allows the use of these
metrics as requirements for software development ac-
cordingly.
Table 1 includes high-priority metrics whose fail-
ure to meet compromises effectiveness and efficiency
or both effectiveness and user satisfaction. Table 2 in-
cludes medium-priority metrics whose failure to meet
compromises effectiveness or both efficiency and user
satisfaction. Finally, Table 3 includes low-priority
metrics whose failure to meet only compromises ef-
ficiency or user satisfaction.
4 EVALUATION AND RESULTS
In this study, the five web platforms (ScienceTalks,
JoVE, Scivpro, Latest Thinking e STEMcognito)
and five mobile applications (WonderScience, TED,
SciShow, NewScientist, NASA) were evaluated ac-
cording to the 25 metrics presented previously. The
degree of adequacy of each interface was assessed
through the proposed prioritization of metrics to help
obtain a more structured view of the contribution of
platforms and applications to scientific communica-
tion through video articles.
Similar to Eliseo at al. (2017), the evaluation pro-
cedure was based on a heuristic evaluation, using the
metrics defined as a guide. A pre-defined list of tasks
was followed in each interface evaluation while ob-
serving the overall experience with the interaction to
determine whether the metrics had been completely
(green), partially (yellow), or not achieved (red), as
shown in Table 4. Note that when is not possible
to analyze a metric, it is indicated with ”NA”, what
means ”Not Applicable”.
4.1 Web Platforms
Table 4 shows for the high-priority metrics, despite
the significance of search engines in systems with
video libraries, that the Scivpro and STEMcognito
platforms performed poorly in M11 (Search). M16
(Subtitle and/or transcription) and M23 (Text alter-
native), two medium-priority metrics, are particu-
larly noteworthy as they encountered issues on four
out of five platforms. Concerning the low-priority
metrics, metric M10 (Help in Context) stands out
because none of the platforms completely cover it.
While Scivpro and STEMcognito did not fully meet
M14 (Use of design principles), the ScienceTalks and
STEMcognito platforms did not fully meet metric
M08 (Consistency between pages). It suggests that
the design of these interfaces needs attention.
Regardless of the priority category, all platforms
fully satisfied the metrics directly related to the videos
(M17, M18, M19, M20, M21, M22), according to the
analysis done using the platforms, which illustrates
the significance of guaranteeing high-quality interac-
tion with the video content offered by these platforms.
After the empirical evaluation, we analyzed the
resulting data, considering the priorities assigned to
each metric. Thus, for each priority, weights were de-
fined on a scale of 1 to 6, as follows: low priority
– weight 1 if the metric was partially achieved (yel-
low) and weight 2 if it was not (red); medium priority
– weight 3 if the metric was partially achieved (yel-
low) and weight 4 if it was not (red); high priority –
weight 5 if the metric was partially achieved (yellow)
and weight 6 if it was not (red). to
Table 5 shows the number of metrics for each web
platform evaluated that received each of the estab-
lished weights. Furthermore, it shows the total score,
which is calculated by multiplying the number of met-
rics inside the cell by the weight associated with pri-
ority. The lower the total score obtained, the more ap-
propriate the interface is for usability issues. There-
fore, the positive highlight is for the JoVE platform
with the most appropriate interface, and the negative
highlight is for the Scivpro platform, which presented
the most usability problems in the evaluation carried
out. Although Latest Thinking and STEMcognito
Enhancing Scientific Communication: Prioritizing User Experience in Audiovisual Interfaces
373

Table 1: High priority metrics.
Criteria Metrics
Effectiveness and System status - M01
Efficiency Support for “undo” and show how to leave an interaction
- M05
Warning messages - M09
Search - M11
Effectiveness and Information is logically presented - M03
User Satisfaction
Table 2: Medium priority metrics.
Criteria Metrics
Effectiveness Compatibility with devices - M04
Efficiency and Video transmission performance - MM04
User Satisfaction Errors are presented in natural language and following
standards - M15
Subtitle and/or transcription - M16
Response time - M17
Video control - M19
What and when to watch - M20
Text alternative - M23
Table 3: Low priority metrics.
Criteria Metrics
Efficiency Links with a purpose - M06
Help in Context - M10
Adjust video quality - MM25
User Satisfaction Familiar language
Consistency in icons and buttons
Consistency between pages - M08
Content and interface focus on the essential - M12
White space - M13
Use of design principles - M14
Information about the videos - M18
Standard video control icons - M21
Appropriate post video action - M22
Appropriate color usage - M24
Ability to resize - M25
Proper sizes - MM06
have obtained the same total score, the last one has
a small advantage. This is because a higher frequency
(6) was registered for low priority metrics. Note that
a metric is disregarded when indicated NA (Not Ap-
plicable).
4.2 Mobile Applications
In contrast to web platforms, mobile applications dis-
played a higher quantity of metrics unfulfilled. Table
6 shows, once more, the metrics less fulfilled were
M10 (Text alternative), M16 (Subtitle and/or tran-
scription), and MM25 (Adjust video quality), with
at least three applications having usability problems
with this metrics.
Despite the importance of video searching, the
SciShow and NewScientist applications did not meet
the M11 (Search) metric. Moreover, the SciShow ap-
plication is notable for achieving completely only one
of the five high-priority metrics, impacting the inter-
ICEIS 2024 - 26th International Conference on Enterprise Information Systems
374
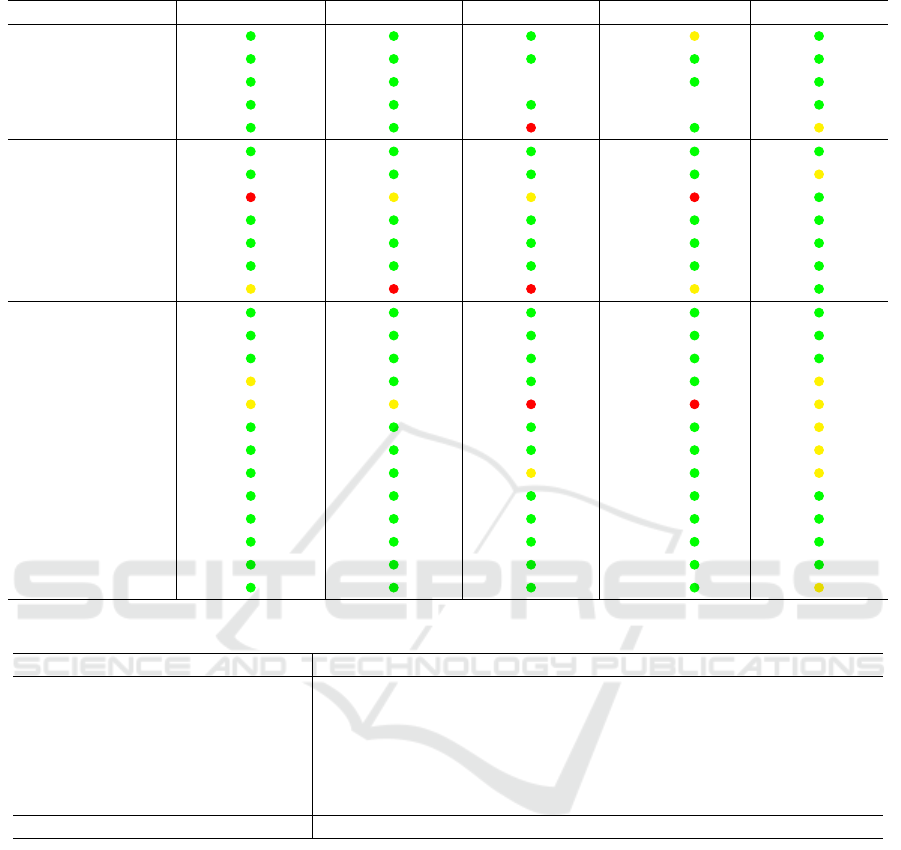
Table 4: Priority and metrics evaluation for each web platforms.
Priority Metric ScienceTalks JoVE Scivpro Latest Thinking STEMcognito
High M01
M03
M05 NA
M09 NA
M11
Medium M04
M15
M16
M17
M19
M20
M23
Low M02
M06
M07
M08
M10
M12
M13
M14
M18
M21
M22
M24
M25
Table 5: Results of total score for web platforms.
Priority (Weight) ScienceTalks JoVE Scivpro Latest Thinking STEMcognito
High Unfulfilled (6) 0 0 1 0 0
Partially (5) 0 0 0 1 1
Medium Unfulfilled (4) 1 1 1 1 0
Partially (3) 1 1 1 1 1
Low Unfulfilled (2) 0 0 1 1 0
Partially (1) 2 1 1 0 6
Total score 9 7 16 14 14
face’s usability.
MM25 (Adjust video quality) is not completely
achieved by the TED, SciShow, and NASA applica-
tions, and M10 (Help in Context) is not completely
achieved by any application. On the other hand, met-
rics M17 (Response time), M21 (Standard video con-
trol icons), and M24 (Appropriate color usage) stand
out for achieving complete compliance across all ap-
plications.
Finally, Table 7 shows the total score accumulated
for each mobile application. Thus, SciShow obtained
the worst result among the mobile applications eval-
uated. In contrast, TED provides an interface well-
suited for the user experience.
5 CONCLUSIONS
The increasing adoption of audiovisual formats for
science communication has been a notable trend in
recent years, opening new avenues for sharing sci-
entific knowledge. The development of user-friendly
web platforms and mobile applications has become
crucial in disseminating this content, with a strong
emphasis on prioritizing usability, which significantly
influences the quality and success of these interfaces.
Aligned with the transformative potential of the
applications for democratizing scientific knowledge,
our study fills a substantial research gap related to us-
ability assessments for interfaces featuring audiovi-
Enhancing Scientific Communication: Prioritizing User Experience in Audiovisual Interfaces
375
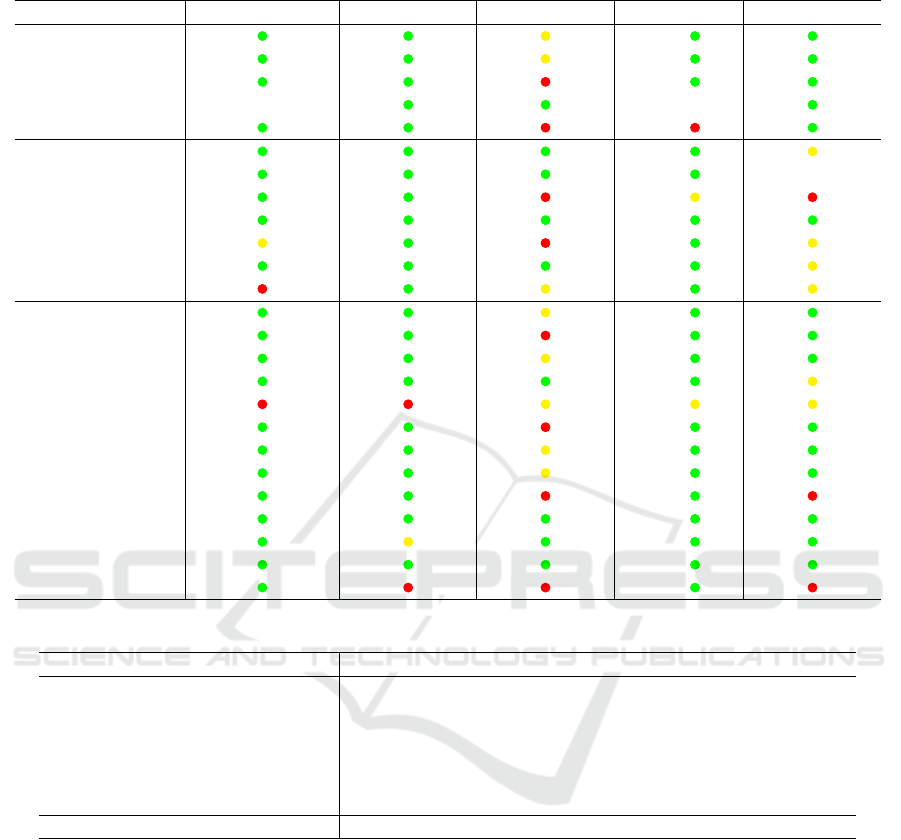
Table 6: Priority and metrics evaluation for each mobile applications.
Priority Metric Wonder Science TED SciShow NewScientist NASA
High M01
M03
M05
M09 NA NA
M11
Medium MM04
M15 NA
M16
M17
M19
M20
M23
Low M02
MM06
M07
M08
M10
M12
M13
M14
M18
M21
M22
M24
MM25
Table 7: Result score for each mobile applications.
Priority (Weight) Wonder Science TED SciShow NewScientist NASA
High Unfulfilled (6) 0 0 2 1 0
Partially (5) 0 0 2 0 0
Medium Unfulfilled (4) 1 0 2 0 1
Partially (3) 1 0 1 1 4
Low Unfulfilled (2) 1 2 4 0 2
Partially (1) 0 1 5 1 2
Total score 9 5 46 10 22
sual content, particularly regarding metrics, criteria,
and a priority scale within the domain of informa-
tive videos. Thus, our effort to identify and establish
usability metrics tailored for web platforms and mo-
bile applications hosting scientific audiovisual con-
tent represents a significant contribution to this field.
By centering our approach on three pivotal usability
criteria—effectiveness, efficiency, and user satisfac-
tion—this paper offers a comprehensive framework
for evaluating usability.
Finally, the empirical evaluation performed with
five web platforms and five mobile applications an-
alyzing the 25 identified usability metrics provided
valuable insights. This analysis not only deepened
our understanding of these metrics but also embraced
concepts to ensure that the dissemination of scientific
knowledge through audiovisual media become effec-
tive, efficient, and user-satisfactory, fostering a more
inclusive, engaging, and accessible environment for
all knowledge users.
REFERENCES
Boy, B., Bucher, H. J., and Christ, K. (2020). Audiovisual
science communication on tv and youtube. how recip-
ients understand and evaluate science videos. Fron-
tiers in Communication, 5:608620.
Budiu, R. (2015). Mobile user experience: limitations and
strengths. Nielsen Norman Group, 19:5.
Chiuchi, C., Souza, R., Santos, A., and Val
ˆ
encio, C. (2011).
ICEIS 2024 - 26th International Conference on Enterprise Information Systems
376

Efficiency and portability: Guidelines to develop web-
sites. pages 37–41.
Consortium, W. W. W. et al. (2018). Web content accessi-
bility guidelines (wcag) 2.1.
Eliseo, M. A., Casac, B. S., and Gentil, G. R. (2017).
A comparative study of video content user interfaces
based on heuristic evaluation. In 2017 12th Iberian
Conference on Information Systems and Technologies
(CISTI), pages 1–6. IEEE.
Hussain, A., Mkpojiogu, E. O., and Mohmad Kamal, F.
(2016). Mobile video streaming applications: A sys-
tematic review of test metrics in usability evaluation.
Journal of Telecommunication, Electronic and Com-
puter Engineering, 8(10):35–39.
ISO 9241-11 (2018). ISO 9241-11: 2018, ergonomics of
human-system interaction — part 11: Usability: Def-
initions and concepts.
ISO/IEC 25010 (2011). ISO/IEC 25010:2011, systems and
software engineering — systems and software quality
requirements and evaluation (square) — system and
software quality models.
Kim, J. and Kim, J. (2021). Guideline-based evaluation and
design opportunities for mobile video-based learning.
In Extended Abstracts of the 2021 CHI Conference on
Human Factors in Computing Systems, pages 1–6.
Lagger, C., Lux, M., and Marques, O. (2017). What makes
people watch online videos: An exploratory study.
Computers in Entertainment (CIE), 15(2):1–31.
Lakoff, G. and Johnson, M. (2008). Metaphors we live by.
University of Chicago press.
Lord
ˆ
elo, F. S. and de Magalh
˜
aes Porto, C. (2012).
Divulgac¸
˜
ao cient
´
ıfica e cultura cient
´
ıfica: conceito e
aplicabilidade. Revista Ci
ˆ
encia em Extens
˜
ao, 8(1):18–
34.
Nielsen, J. (1994a). Enhancing the explanatory power of
usability heuristics. In Proceedings of the SIGCHI
conference on Human Factors in Computing Systems,
pages 152–158.
Nielsen, J. (1994b). Usability inspection methods. In Con-
ference companion on Human factors in computing
systems, pages 413–414.
Nielsen, J. (1995). How to conduct a heuristic evaluation.
Nielsen Norman Group, 1(1):8.
Norman, D. (2007). Emotional design: Why we love (or
hate) everyday things. Basic books.
Nugroho, A., Santosa, P. I., and Hartanto, R. (2022). Usabil-
ity evaluation methods of mobile applications: A sys-
tematic literature review. In 2022 International Sym-
posium on Information Technology and Digital Inno-
vation (ISITDI), pages 92–95. IEEE.
Poulin, R. (2018). The language of graphic design revised
and updated: An illustrated handbook for understand-
ing fundamental design principles. Rockport Publish-
ers.
Rosenthal, S. (2020). Media literacy, scientific literacy, and
science videos on the internet. Frontiers in Communi-
cation, 5:581585.
Santos, A. B. (2022). Publicac¸
˜
ao de videoartigos como
estrat
´
egia para impulsionar o consumo de ci
ˆ
encia.
Transinformac¸
˜
ao, 34:e220011.
Enhancing Scientific Communication: Prioritizing User Experience in Audiovisual Interfaces
377
