
A Falls Risk Screening Tool Based on Millimetre-Wave Radar
Elif Dogu
1 a
, Jose A. Paredes
1,2 b
, Akram Alomainy
1 c
, Janelle M. Jones
3 d
and
Khalid Z. Rajab
1 e
1
School of Electronic Engineering and Computer Science, Queen Mary University of London, London E1 4NS, U.K.
2
School of Arts, Humanities and Social Sciences, University of Roehampton, London SW15 5PU, U.K.
3
School of Biological and Behavioural Sciences, Queen Mary University of London, London E1 4NS, U.K.
Keywords:
FMCW, mm-Wave Radar, Health Informatics, Medical Decision Support, Fall Risk Assessment,
Timed Up and Go, Gait, Mobility.
Abstract:
Falls among the older adults pose a global health concern, necessitating innovative approaches for timely and
effective falls risk screening. Aiming to develop a real-time falls risk screening tool, this study explores the
integration of millimeter-wave (mmWave) radar technology with the Timed Up and Go (TUG) test, which
is a widely used screening tool that combines parameters measuring a person’s dynamic balance and func-
tional mobility. Radar technology has emerged as a promising tool for non-intrusive, continuous monitoring
of movements – including gait patterns and mobility – in real-life scenarios. By leveraging Frequency Mod-
ulated Continuous Wave (FMCW) radar, the study assesses its performance against video recordings in TUG
completion time measurement. The completion time, conventionally measured manually with a timer in clini-
cal settings, was derived from radar measurements using two different methods based on distance, and micro-
Doppler (i.e. velocity). Results indicate radar’s superior accuracy in distance-based measures with 3.48%
error and a correlation of 0.9996, surpassing manual timing (4.26% error, 0.9960 correlation) and demonstrat-
ing viability for falls risk screening protocols. The velocity-based determination performed slightly poorer
(6.49% error, 0.9936 correlation), which is attributable to the very high sensitivity of the radar in detecting
small motions, such as shuffling in a chair, that are not a part of the TUG sequence. This study contributes to
healthcare technology innovation, emphasising radar’s transformative role beyond falls risk assessment. The
precision of radar-based measurements opens avenues for enhanced diagnostics, monitoring, and personalised
care.
1 INTRODUCTION
A fall is defined as an event which results in a per-
son coming to rest inadvertently on the ground or
floor or other lower level (WHO, 2021). Every year,
millions of older adults, and their families face the
life-altering consequences of falls. The World Health
Organization (WHO) reports that falls represent the
second leading cause of unintentional injury deaths
worldwide (WHO, 2021). These incidents not only
have immediate critical impacts such as injury, pain,
disability, and increased mortality (NICE, 2013), but
they also cast a long shadow of psychological distress
a
https://orcid.org/0000-0003-4883-3450
b
https://orcid.org/0000-0002-0412-0179
c
https://orcid.org/0000-0002-5802-9194
d
https://orcid.org/0000-0002-0910-2404
e
https://orcid.org/0000-0003-1337-2965
leading to fear of falling (Laved
´
an et al., 2018), re-
duced daily activity and reduced self-confidence in
mobility.
The American Geriatrics Society and the British
Geriatrics Society recommend that all adults over the
age of 65 should be screened for falls risk at least once
a year (Moncada, 2011). However, effective fall risk
screening is still underutilised and not routinely inte-
grated into clinical practice (Sun and Sosnoff, 2018).
There might be several reasons such as constraints of
clinical time and environment.
From a broader perspective, another limitation of
current falls risk screening tools is that they only pro-
vide a snapshot of the patient’s condition at their best,
under clinical conditions. The tests are carried out
during the working hours of clinicians, when patients
are less likely to be affected by factors like hunger,
thirst, or fatigue. Meaningful insights into how the
Dogu, E., Paredes, J., Alomainy, A., Jones, J. and Rajab, K.
A Falls Risk Screening Tool Based on Millimetre-Wave Radar.
DOI: 10.5220/0012618900003699
Paper published under CC license (CC BY-NC-ND 4.0)
In Proceedings of the 10th International Conference on Information and Communication Technologies for Ageing Well and e-Health (ICT4AWE 2024), pages 161-168
ISBN: 978-989-758-700-9; ISSN: 2184-4984
Proceedings Copyright © 2024 by SCITEPRESS – Science and Technology Publications, Lda.
161

patient’s gait pattern may vary at different times of
the day, such as when they wake up in the morn-
ing or when they get up at night, remain understud-
ied.In light of the weak association between natural
gait speed and in-laboratory gait speed (Takayanagi
et al., 2019), integrating technology with established
practices can offer a promising avenue for real-time
and continuous monitoring beyond clinical confines,
in the diverse and dynamic scenarios of everyday life.
In the present research, a millimetre-wave
(mmWave) radar was chosen to integrate with the
TUG test, to develop a falls risk screening tool, as a
digital health technology tool (DHTT) (Taylor et al.,
2020).
Radar technology is a promising solution for am-
bient sensing, as it is minimally intrusive: it does not
rely on wearables, nor does it capture camera images
or video. It can provide real-time remote monitoring
of individuals in a home, allowing for the continu-
ous evaluation of gait (Gambi et al., 2020; Alanazi
et al., 2022), mobility patterns, and overall wellbeing
(Cardillo et al., 2022). FMCW (Frequency Modulated
Continuous Wave) radar captures subtle movements
with high precision, making it an effective tool for
classifying daily-life activities such as walking, sit-
ting, standing and sleeping (Rajab et al., 2021; Yu
et al., 2022). Radars also have the capability to op-
erate through various materials and work in challeng-
ing environmental conditions such as adverse weather
and low visibility. In homes, the radars provide effec-
tive continuous monitoring which enables early de-
tection of deviations from normal mobility patterns.
In this work, we observe the feasibility of integrat-
ing radar technology with the TUG test and assess
its performance compared to video camera record-
ings. For this purpose, the paper is organised as fol-
lows: in section 2, previous studies implementing new
technologies to the TUG test are summarised. Sec-
tion 3 provides information on the procedures fol-
lowed while designing the experiments. Section 4
presents the results of the experiments and their analy-
ses. Discussions of the outcomes are provided in Sec-
tion 5 and the paper is concluded in Section 6.
2 RELATED WORK
The TUG test is widely used in current clinical prac-
tice to detect gait and balance impairment. To conduct
a TUG test, patients wear their regular shoes, and may
use a walking aid if necessary. The setup involves a
standard stable chair and a three-meter line in front
of it. The patient is instructed as: “When I say ‘Go’,
I want you to stand up from the chair, walk to the
line on the floor at a normal pace, turn around, walk
back to the chair at a normal pace and sit down again.”
The timing starts on the word ‘Go’ and ends when the
patient sits back down. The TUG completion time
is measured by the clinician manually, using a timer.
If a patient’s TUG test takes more than 15s, they are
identified as being at risk of falling. Therefore, by
definition, the TUG test involves 4 parameters: sit-to-
stand time, 3m walking time (where the gait speed can
be inferred), a 180
◦
turn time, and stand-to-sit time.
The TUG test is usually preferred for its simplicity. It
has shown to be predictive in lower functioning adults
(Beck Jepsen et al., 2022).
The TUG test recently attracted significant atten-
tion from researchers. New technologies have been
developed to instrument the TUG test in several ways,
including wearable sensors, cameras, and ambient
sensors.
Greene, Doheny, O’Halloran and Kenny used the
TUG test with shank-mounted inertial sensors and
developed a regression-based method for the assess-
ment of frailty. The experiments were conducted with
399 community-dwelling older adults (Greene et al.,
2014). Using inertial sensor data obtained during the
TUG test, the participants were classified as frail or
non-frail with mean accuracy of 75.20% (stratified
by gender). Spina et al. investigated the parame-
ter of 180-degree turns derived from an instrumented
TUG test in stroke patients (Spina et al., 2022). They
placed a single inertial measurement unit (IMU) sen-
sor on the lower back of patients. 48 chronic stroke
patients and 23 healthy controls were included in the
experiment. They reported turning speeds as accu-
rate measures of mobility, capable of discriminat-
ing stroke patients with normal and impaired mo-
bility. Fudickar, Hellmers, Lau, Diekmann, Bauer,
and Hein introduced an unsupervised screening sys-
tem for older adults and evaluated its validity for the
TUG and Five Times Sit-to-Stand test (Fudickar et al.,
2020). The system involved both wearable and ambi-
ent movement sensors. The sensor data sets of 91 par-
ticipants aged 73 to 89 years was compared to conven-
tional measurement with stopwatches. With ambient
sensor data, significant correlations of 0.89 and 0.73
were detected for TUG and sit-to-stand, respectively.
With wearable sensors, they were reported as 0.78 and
0.87.
Choi, Parker, Knarr, Gwon and Youn proposed
a model that predicts the TUG test using three-
dimensional acceleration data collected from wear-
able sensors during normal walking (Choi et al.,
2021). They recruited 37 older adults with an average
age of 69.6 and used seven IMU-based wearable sen-
sors for the experiments. They obtained better predic-
ICT4AWE 2024 - 10th International Conference on Information and Communication Technologies for Ageing Well and e-Health
162

tion accuracy with two foot sensors. However, they
recommended the use of a single IMU sensor at the
pelvis for greater comfort. Diao et al. developed an
environment-adaptive TUG test with wearable iner-
tial sensors attached to the two shanks (Diao et al.,
2021). They conducted the experiment with 103 older
adults, reporting an average accuracy 9.52% higher
than the conventional TUG in classification of high-
risk and low-risk groups for falls. Dierick, Stoffel,
Sch
¨
utz, and Buisseret proposed placing a single wear-
able IMU sensor on the lower back during the TUG
test to enhance the predictive accuracy (Dierick et al.,
2022). They recruited 73 nursing home residents for
the experiments. They reported 74% accuracy, with a
specificity of 95.9% and a sensitivity of 29.2% using
the sensor, while the conventional TUG was 64% ac-
curate. Kataoka et al. observed lower-limb kinemat-
ics of patients with Locomotive Syndrome (LS), using
a TUG test with wearable gait sensors (Kataoka et al.,
2023). They recruited 140 patients with an average
age of 72.6 in Japan for the experiments. Their sen-
sors consisted of tri-axial acceleration and gyro sen-
sors that were placed on seven lower-limb body seg-
ments. Their results showed that the subjects with LS
have longer TUG completion time than the subjects
with non-LS.
Wearable devices in assessing gait and mobility
with the TUG test have yielded promising results. The
main concern in these studies was the comfort associ-
ated with wearing the sensors. Configurations involv-
ing wires or tapes on the body, while suitable for clin-
ical or research environments, may pose challenges
in everyday life due to their intrusive nature. More-
over, their practicality is constrained by the factor of
limited battery life.
Savoie, Cameron, Kaye, and Scheme proposed
the automation of the TUG test using a single con-
ventional video camera (Savoie et al., 2020). They
recorded 30 healthy participants with both Microsoft
Kinect V2 and a standard video camera while per-
forming two versions of the TUG test with 3-meter
and 1.5-meter walking distances. They developed a
video-based vTUG system leveraging advanced com-
puter vision techniques. vTUG system yielded the
same error as the standard Kinect-based system for
all six key transitions points, and average errors of
less than 0.15 seconds from a multi-observer hand-
labelled ground truth. Li et al. developed a video-
based activity classification method to infer the TUG
parameters of Parkinson’s disease patients (Li et al.,
2018). 24 patients were recruited, and their TUG
test videos were recorded in semi-controlled environ-
ments having different backgrounds. They reported
more than 90% on average for the classification of
frames.
Cameras, coupled with computer vision technol-
ogy, have shown good performance with, however
their use for continuous monitoring can be limited due
to privacy concerns.
Frenken, Brell, G
¨
overcin, Wegel, and Hein used
a light barrier, four force sensors, and a laser range
scanner built into a single apparatus and proposed the
ambient TUG (aTUG) test for gait and balance anal-
ysis (Frenken et al., 2013). The experiment was con-
ducted with five older patients in a residential care
facility, demonstrating that aTUG could reliably and
precisely measure total duration of TUG and dura-
tions of the single components with a mean error of
only 0.05 seconds and mean standard deviation of
0.59 s. Ayena, Chioukh, Otis, and Deslandes com-
bined the performance of ultra-wideband radar and in-
strumented insole for an unobtrusive TUG test (Ayena
et al., 2021). They conducted 14 tests with a sin-
gle participant and the results reported the feasibility
of the TUG test using a sensor combination. Soubra
Mourad-Chehade, and Chkeir proposed the automa-
tion of TUG test using Doppler radar system (Soubra
et al., 2023). The radar was set into the backrest of the
chair used for TUG test. They recruited 26 healthy
participants, aged between 22 and 60. The partici-
pants performed 3 slow, 3 normal, 3 fast TUG tests as
experiments. An infrared camera system was used as
the ground truth. The Doppler radar system achieved
4.8% error on the TUG completion time.
Ambient sensors have the potential to deal with
the limitations of wearable sensors and cameras.
However, the generalisability of previous findings
may be constrained by small sample sizes. There is
a need for the radar to be validated for TUG test, and
other falls screening tools to disseminate their use in
various settings.
When all the risk factors are detected, the third
step of designing the targeted intervention and con-
trol measures begins. This step may include exercise
and education programs, modifications in home envi-
ronment, revision of medications and other actions to
eliminate the risk factors one by one from patients’
lives.
3 SYSTEM OVERVIEW AND
SETUP
Our standard TUG test setup includes a chair with a
3m line as the walking lane, as depicted in Fig. 1.
During the experiments, the radar device is placed
at two different locations to observe the variations. In
both positions, the height of the radar was 0.5m. In
A Falls Risk Screening Tool Based on Millimetre-Wave Radar
163
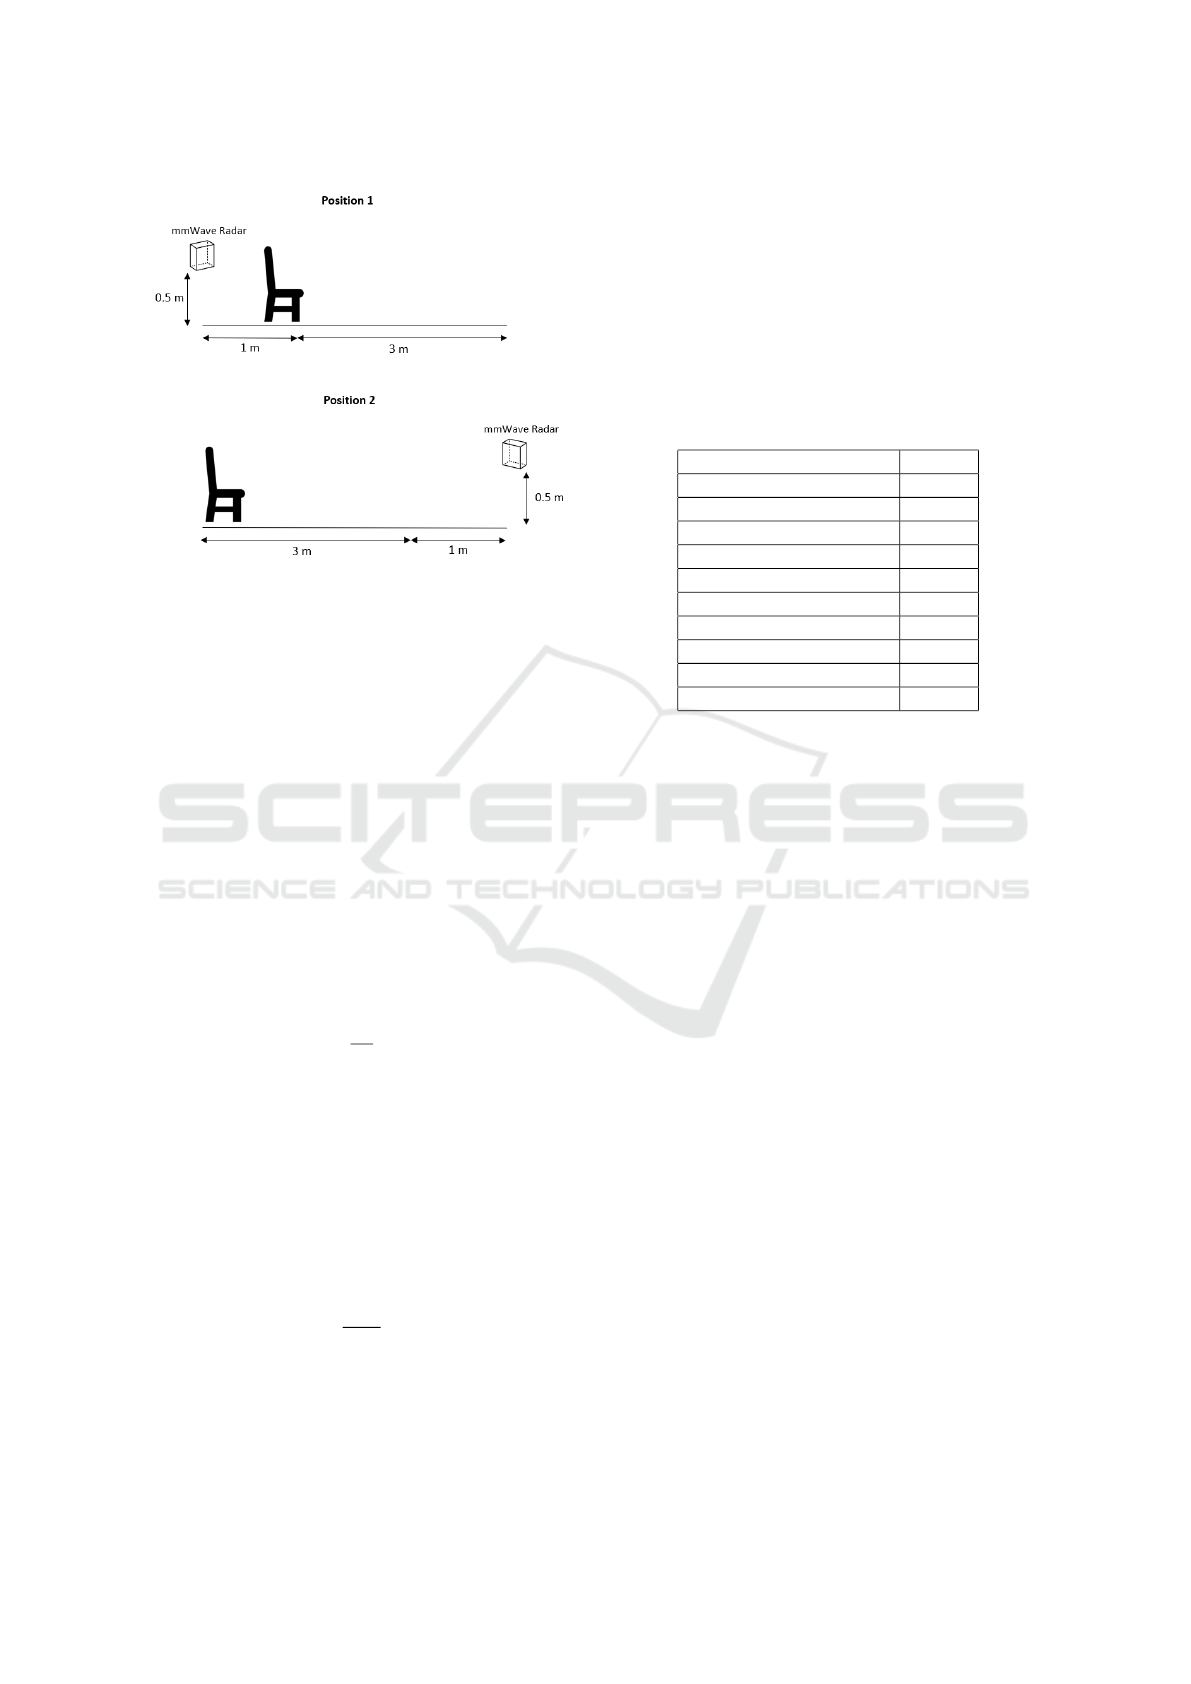
Figure 1: Two positions of the radar for the TUG test.
position 1, the radar was placed 1m behind the chair
and in position 2, 4m in front of the chair.
3.1 Radar Data Acquisition
A millimeter-wave (mmWave) radar system emits
high-frequency chirp-like signals within the GHz
range. Certain configurations incorporate multiple
receive (RX) and transmit (TX) antennas, constitut-
ing Multiple-Input Multiple-Output (MIMO) radars.
These systems present the capability to extract com-
prehensive information about range, angle (azimuth,
elevation) and radial velocity.
The Doppler frequency, which is the difference
between emitted and received signals, is measured by
the radar as f
IF
– a.k.a. intermediate frequency –, and
the distance r to the object can be expressed as:
r =
cT
2B
f
IF
, (1)
where c represents the speed of light, T signifies the
emission period, and B denotes the signal bandwidth.
For a more comprehensive exposition, please consult
(Richards, 2014).
The emission of several signals in a row, what is
known as a frame, enables the precise measurement
of radial velocities. By emitting a sequence of signals
equally spaced in time by T
c
, a resultant phase shift
∆ϕ appears. Then, radial velocity can be computed
by:
v =
λ
4πT
c
∆ϕ, (2)
where λ is the wavelength of the original emitted sig-
nal.
In this work, a Fast Fourier Transform (FFT) is
applied over each emitting-receiving antenna pair, in
order to obtain the distance r from equation (1). And
a Capon beamforming algorithm is used to determine
the velocity from equation (2).
The radar utilised in this work was manufac-
tured by NodeNs Medical Ltd (NodeNs Medical
Ltd., 2023) and is based on the Texas Instruments
IWR6843 chipset. It operates within the unlicensed
60 GHz band. For detailed specifications, its configu-
ration is outlined in Table 1.
Table 1: Radar configuration.
Start Frequency (GHz) 60.6
Slope (MHz/µs) 54.725
Samples per chirp 96
Chirps per frame 288
Frame duration (ms) 50
Sampling Rate (Msps) 2.950
Bandwidth (MHz) 2249
Range Resolution (m) 0.084
Velocity resolution (m/s) 0.17
Number of Rx antennas 4
Number of Tx antennas 3
4 EXPERIMENTS AND RESULTS
4.1 Data Collection Protocols
Two participants are recruited to repeat the TUG test
at three different speeds (normal, fast, slow) for two
different positions of the sensor (Positions 1 and 2),
which resulted in 12 experiments in total (see Ta-
ble 2). The TUG test procedure explained in the
section 2 is applied. The TUG completion time is
obtained manually using a timer, as this is the clini-
cal standard (Time-Manual column of Table 2). The
experiments were recorded on camera to obtain the
ground truth, which was defined as the TUG comple-
tion time gathered from the video (Time-Video col-
umn of Table 2). The ground truth was calculated by
determining the total number of frames captured dur-
ing the movement, and the video frame rate was set
at 30 frames per second (fps). To assess the radar
implementation to the TUG test, the completion time
is also inferred from the radar signals with two dif-
ferent methods, using velocity (micro-Doppler signa-
tures) and distance measures.
4.2 Distance-Based Proposal Analysis
The distance graph presents data on the temporal vari-
ation of the distance between the subject and the
ICT4AWE 2024 - 10th International Conference on Information and Communication Technologies for Ageing Well and e-Health
164
Table 2: Experiments. ’Time-Video*’ shows the ground truth of the TUG completion time gathered from video recordings,
’Time-Manual’ shows the version measured manually as in clinical practice, ’Time-Doppler’ shows the results of velocity-
based analysis and ’Time-Distance’ shows the results of distance-based analysis.
Experiment Participant Position TUG Test Time-Video* (s) Time-Manual (s) Time-Doppler (s) Time-Distance (s)
1 1 2 Normal 11.6 11 11.88 11.83
2 1 2 Fast 8.6 8 9.68 9.08
3 1 2 Slow 17.5 18 18.48 17.88
4 2 2 Normal 10.4 11 10.56 10.73
5 2 2 Fast 6.6 7 6.60 6.88
6 2 2 Slow 14.5 15 14.96 14.85
7 1 1 Normal 9.6 9 11.88 9.90
8 1 1 Fast 7.5 7 8.36 7.98
9 1 1 Slow 22.3 22 23.32 22.00
10 2 1 Normal 10.4 10 11.00 10.73
11 2 1 Fast 7.9 8 8.36 8.53
12 2 1 Slow 21.3 21 21.56 21.18
radar. For example, Figure 2 provides the distance
graphs of the experiments 4,5 and 6. These are nor-
mal, fast and slow versions of the TUG test with the
radar placed at the front. During these tests, the dis-
tance initially decreases as the subject walks towards
the sensor, and then increases when the subject re-
turns to the chair. The variations of the tests can be
observed from the kurtosis of their curves. While the
fast TUG test has a more pointed structure, the slow
TUG test has the widest curve.
Figure 2: Distance graphs of experiments 4 (normal), 5
(fast) and 6 (slow).
When the radar position changes, it is expected
that the curve gets mirrored for the distance measure.
Figure 3 depicts the distance graphs of experiments 6
and 12, which are slow TUG tests from different po-
sitions. The slow version of the tests are selected here
as examples, for a better distinction of boundaries.
In both distance plots, instead of a perfectly smooth
curve, small curve variations are observed at the be-
ginning and end. These represent the movements of
getting up and sitting down at the beginning and end
of the TUG test. This is attributable to the inclina-
tion of the body leaning forward when rising from the
chair, and conversely, a backward lean when seated.
These movements change the distance to the sensor,
but more slowly than the walking movement. Hence,
different slopes are observed at the beginning and end
of the curve.
Figure 3: Distance graphs of experiments 6 (top) and 12
(bottom), corresponding to positions 2 (radar in front) and 1
(radar behind) respectively.
The TUG completion time is inferred from the dis-
tance parameter by determining start and end points
of the curve, as depicted with dashed lines in Fig-
ure 3. The results for all experiments are provided
in the Time-Distance column of Table 2.
4.3 Velocity-Based Proposal Analysis
The micro-Doppler effect captures the subtle move-
ments and rotations of body segments, providing dis-
tinct signatures for different activities. Figure 4 de-
picts the micro-Doppler signatures of the experiments
6 and 12, with the axes of velocity (m/s) vs time. It
is observed that the TUG test results in a characteris-
tic S-shaped micro-Doppler curve, which is due to the
subject walking away from the radar (positive veloc-
ities), turning (approximately zero velocity) and then
walking back to the radar (negative velocities). The
S-shape can be reversed based on the position of the
sensor. The action of sitting and standing also result in
A Falls Risk Screening Tool Based on Millimetre-Wave Radar
165
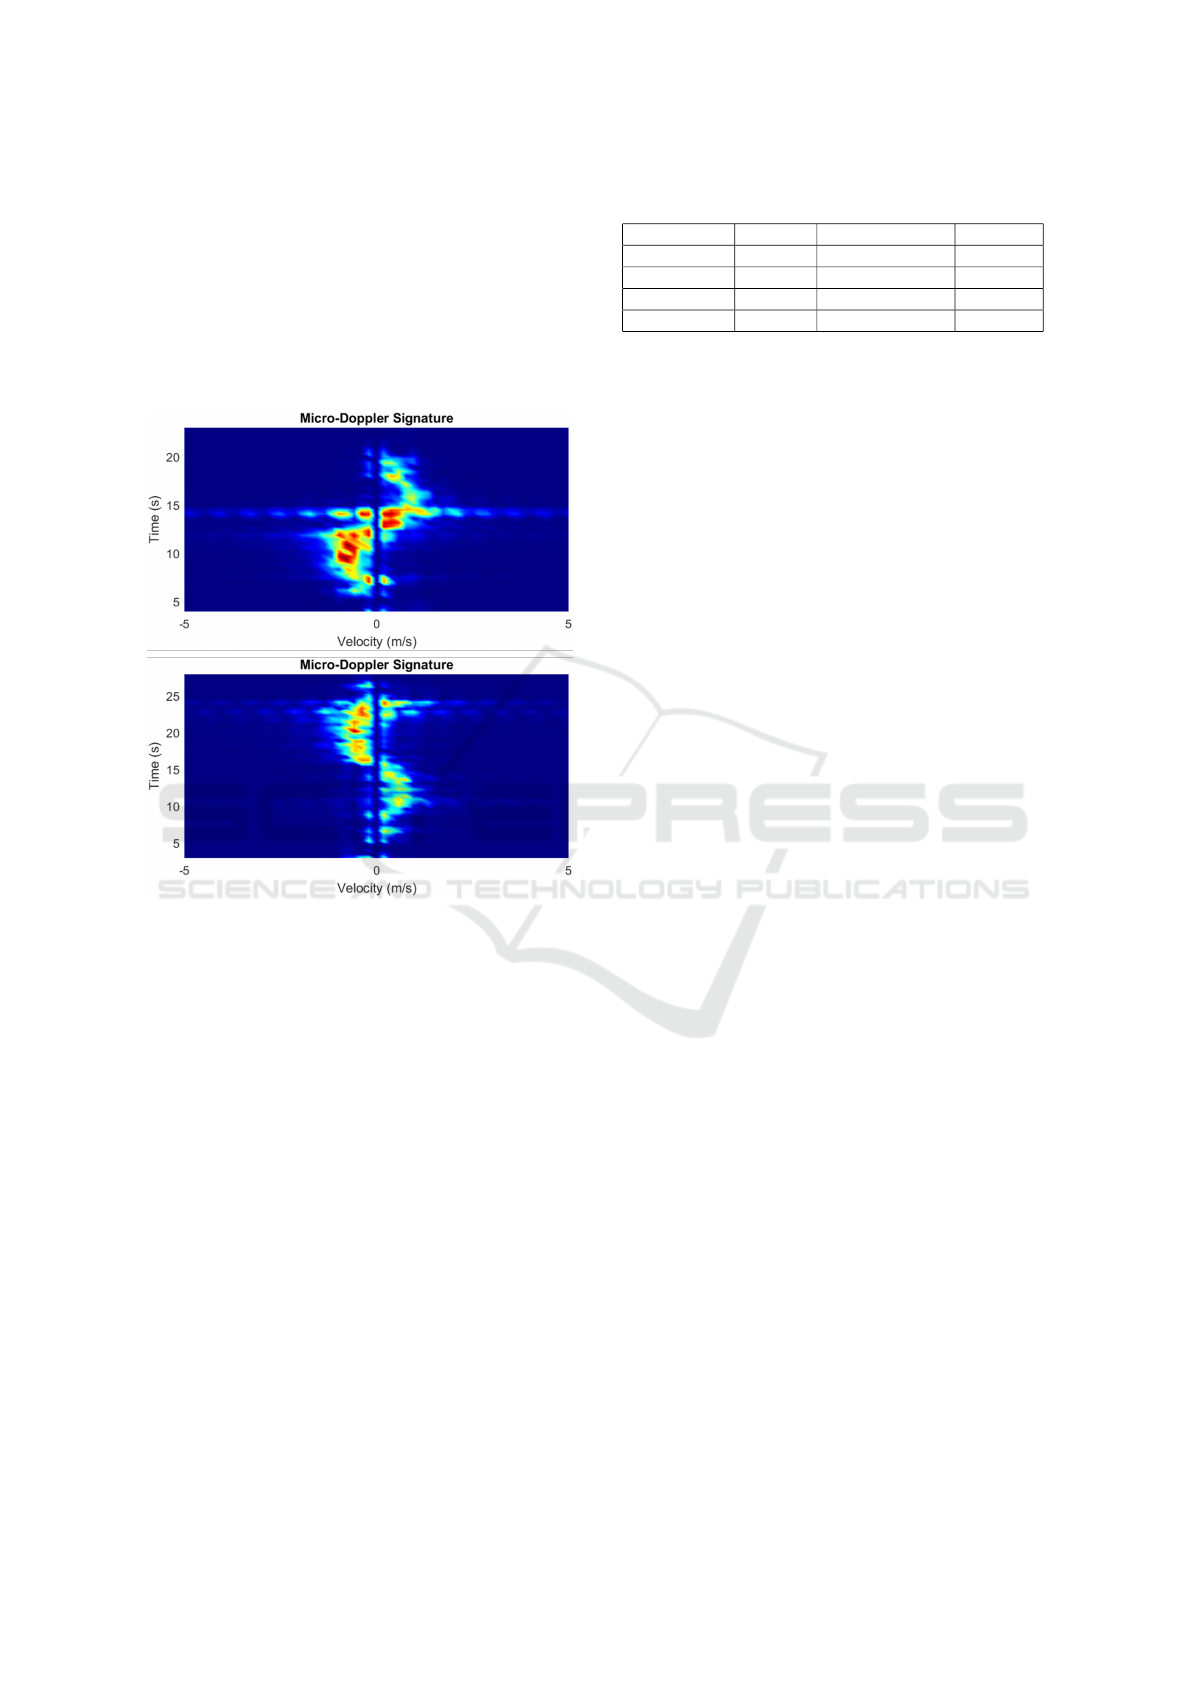
Doppler responses. Similarly to the distance graphs,
the test boundaries can be easily detected. We note
that the micro-Doppler signatures are more prominent
when the radar is in front of the chair than when it
is behind (experiment 6 compared to experiment 12),
which is likely due to the chair obstructing the radar
signal. This can be mitigated against by increasing
the height of the radar. Nevertheless, test boundary
timings can still clearly be detected.
Figure 4: Micro-Doppler signatures of experiments 6
and 12.
Using the micro-Doppler signature, the time be-
tween the start and end of the movement is calculated.
The results for all experiments are provided in Time-
Doppler column of Table 2.
4.4 Performance Evaluation
The TUG completion time gathered from the video
recording is selected as the ground truth, as the video
provides the most accurate timings through frame-by-
frame analysis to identify precise activity time seg-
ments. The TUG completion times measured man-
ually and inferred from radar data with two differ-
ent methods are compared to the ground truth. For
the evaluation, root mean square error (RMSE), mean
absolute error (MAE), mean absolute percent error
(MAPE) and correlation coefficient are calculated.
Table 3 provides the performance evaluation mea-
sures.
Current clinical practice uses manual timing of
Table 3: Performance evaluation measures.
Pe.Measure Manual Micro-Doppler Distance
RMSE 0.4743 0.9156 0.3695
MAE 0.4500 0.7033 0.3479
MAPE 4.26% 6.49% 3.48%
Correlation 0.9960 0.9936 0.9996
the TUG test. It is important to recognise that man-
ual timing does not guarantee 100% accuracy, and
so we use camera recordings to measure our ground
truth. Nonetheless, consultations with healthcare pro-
fessionals have indicated a permissible margin of er-
ror of 10% in timing, and clinicians have expressed a
preference for manual timing due to its simplicity and
cost-effectiveness.
Based on the outcomes, the TUG completion time
deduced from the distance measurement of radar sig-
nals demonstrated superior performance compared to
manual timing. The TUG completion time inferred
from the micro-Doppler signature exhibited slightly
poorer performance. Nevertheless, it is noteworthy
that all measures yielded an error of less than 10%.
5 DISCUSSIONS
There might be several underlying reasons for the dif-
ference in performance of the two radar measures. To
observe the influence of the sensor’s position on the
results, the differences from the ground truth (the er-
rors) are calculated for manual, micro-Doppler and
distance timings. The mean of the errors are com-
pared for two different positions of the radar. There
was no significant difference between the mean errors
from the two positions for any of the methods. There-
fore, the superior performance of distance-based anal-
ysis over velocity-based analysis is not contingent on
the sensor’s position. From closer inspection of the
results in Table 2 it is evident that the velocity-based
(Time-Doppler) measurements consistently overesti-
mate the duration of the TUG sequence. This can be
explained by the sensitivity of the radar in detecting
small movements, such as moving around in a chair,
which might occur just before the motion of stand-
ing up. The inclusion of these additional movements
therefore increases the detected sequence duration.
While the TUG completion times inferred from
the micro-Doppler signature exhibit less accuracy
than the ones from the distance measure, the perfor-
mance of both methods remains acceptable to health-
care professionals. The distance measure yielded an
even better performance than the manual timing. The
outcomes of the first experiments are promising for
the implementation of radar as a falls risk screen-
ICT4AWE 2024 - 10th International Conference on Information and Communication Technologies for Ageing Well and e-Health
166

ing tool. Furthermore, the sensitivity of the micro-
Doppler measurements will be combined, in a future
study, with the distance measurements for automatic
boundary detection, to more precisely determine the
TUG sequence activity boundaries and duration.
Despite the promising outcomes, certain limita-
tions should be acknowledged that provide insights
into the boundaries of our study and contribute to a
nuanced understanding of the findings. The partici-
pants of this study are not older adults and they have
no known gait or balance problems. The inherent dif-
ferences in walking patterns between young individ-
uals and older adults with gait and balance problems
may introduce variations not explicitly addressed in
this study.
The experiments were performed in a cluttered en-
vironment – an office space with multiple desks and
moving occupants – which shows the robustness of
the technique to environmental noise and movements.
Nevertheless, the TUG test’s actions were controlled,
which would not reflect the complexities of natural
movements during daily activities. Additionally, the
sample size in our study was limited to only two par-
ticipants, which may constrain the broader applicabil-
ity of our results. A larger and more diverse partici-
pant pool could provide a better understanding of the
effectiveness and reliability of the radar-based timing
of TUG test across various demographic groups and
conditions.
6 CONCLUSIONS
This study was designed to observe the innovative
application of radar technology in conjunction with
the TUG test as a means of falls risk screening. To
develop a real-time falls risk screening tool, we ex-
plored the ways to automate the process of capturing
the TUG completion time through non-intrusive am-
bient sensing.
The TUG completion time inferred from the dis-
tance measurements of radar has achieved a level of
accuracy surpassing that of manual timing. Although
micro-Doppler timings were less accurate than dis-
tance, due to the radar’s high sensitivity in detecting
small movements, both techniques had sufficient per-
formance to satisfy the requirements set by healthcare
professionals. This suggests a viable and effective in-
corporation of radar technology into falls risk screen-
ing protocols.
The results of this study not only underscore the
feasibility of integrating radar technology into falls
risk screening but also highlights the importance of
continuous innovation in healthcare technology. The
superior performance of radar-based measurements
hints at the transformative role this technology can
play in healthcare. The implementation of radar as
a falls risk screening tool represents just one facet of
its potential application. The ability to capture move-
ments and timings with precision, without interfering
with privacy, opens avenues for enhanced diagnostics,
monitoring, and personalised care.
A noteworthy finding emerged from this study
by examining the impact of environmental clutter
on measurement outcomes. The over-estimation of
TUG sequence duration by the velocity-based (micro-
Doppler) technique, due to the high sensitivity of the
radar, highlights a potential area for refinement. Fu-
ture research endeavours could expand its assessment
of radar placement, or encompass use of multiple
radars to measure gait and posture. Another possi-
bility is to expand the participant pool to include in-
dividuals with varying levels of mobility and balance
challenges. Finally, future research could also explore
a more generalised model of subjects’ activities than
the TUG test, so that a radar-based falls risk assess-
ment may more adaptively fit continuous measure-
ment during day-to-day living.
ACKNOWLEDGEMENTS
This work was supported by the UK Engineering and
Physical Sciences Research Council (EPSRC) grant
EP/W03199X/1, “Smart sensors for a wearable-free
and contactless virtual ward at home”.
REFERENCES
Alanazi, M., Alhazmi, A., Alsattam, O., Gnau, K., Brown,
M., Thiel, S., Jackson, K., and Chodavarapu, V.
(2022). Towards a low-cost solution for gait analysis
using millimeter wave sensor and machine learning.
Sensors, 22(5470).
Ayena, J., Chioukh, L., Otis, M., and Deslandes, D. (2021).
Risk of Falling in a Timed Up and Go Test Using an
UWB Radar and an Instrumented Insole. Sensors,
21(3).
Beck Jepsen, D., Robinson, K., Ogliari, G., Montero-
Odasso, M., Kamkar, N., Ryg, J., Freiberger, E., and
Masud, T. (2022). Predicting falls in older adults:
an umbrella review of instruments assessing gait,
balance, and functional mobility. BMC Geriatrics,
22(1):615.
Cardillo, E., Li, C., and Caddemi, A. (2022). Millimeter-
wave radar cane: A blind people aid with moving hu-
man recognition capabilities. IEEE Journal of Elec-
tromagnetics, RF and Microwaves in Medicine and
Biology, 6(2):204–211.
A Falls Risk Screening Tool Based on Millimetre-Wave Radar
167

Choi, J., Parker, S. M., Knarr, B. A., Gwon, Y., and Youn, J.-
H. (2021). Wearable Sensor-Based Prediction Model
of Timed up and Go Test in Older Adults. Sen-
sors, 21(20):6831. Number: 20 Publisher: Multidis-
ciplinary Digital Publishing Institute.
Diao, Y., Lou, N., Liang, S., Zhang, Y., Ning, Y., Li, G.,
and Zhao, G. (2021). A Novel Environment-Adaptive
Timed Up and Go Test System for Fall Risk Assess-
ment With Wearable Inertial Sensors. IEEE Sensors
Journal, 21(16):18287–18297.
Dierick, F., Stoffel, P., Sch
¨
utz, G., and Buisseret, F.
(2022). High Specificity of Single Inertial Sensor-
Supplemented Timed Up and Go Test for Assessing
Fall Risk in Elderly Nursing Home Residents. Sen-
sors, 22(6).
Frenken, T., Brell, M., G
¨
overcin, M., Wegel, S., and Hein,
A. (2013). aTUG: technical apparatus for gait and bal-
ance analysis within component-based Timed Up &
Go using mutual ambient sensors. Journal of Ambient
Intelligence and Humanized Computing, 4(6):759–
778.
Fudickar, S., Hellmers, S., Lau, S., Diekmann, R., Bauer,
J., and Hein, A. (2020). Measurement System for
Unsupervised Standardized Assessment of Timed ”Up
& Go” and Five Times Sit to Stand Test in the
Community-A Validity Study. Sensors, 20(10).
Gambi, E., Ciattaglia, G., Santis, A. D., and Senigagliesi, L.
(2020). Millimeter wave radar data of people walking.
Data in Brief, 31(105996).
Greene, B., Doheny, E., O’Halloran, A., and Kenny, R.
(2014). Frailty status can be accurately assessed using
inertial sensors and the TUG test. Age and Ageing,
43(3):406–411.
Kataoka, Y., Saito, Y., Takeda, R., Ishida, T., Tadano, S.,
Suzuki, T., Nakamura, K., Nakata, A., Osuka, S., Ya-
mada, S., Samukawa, M., and Tohyama, H. (2023).
Evaluation of Lower-Limb Kinematics during Timed
Up and Go (TUG) Test in Subjects with Locomotive
Syndrome (LS) Using Wearable Gait Sensors (H-Gait
System). Sensors, 23(2).
Laved
´
an, A., Viladrosa, M., J
¨
urschik, P., Botigu
´
e, T., Nu
´
ın,
C., Masot, O., and Laved
´
an, R. (2018). Fear of falling
in community-dwelling older adults: A cause of falls,
a consequence, or both? PLoS one, 13(3):e0194967.
Li, T., Chen, J., Hu, C., Ma, Y., Wu, Z., Wan, W., Huang,
Y., Jia, F., Gong, C., Wan, S., and Li, L. (2018).
Automatic Timed Up-and-Go Sub-Task Segmenta-
tion for Parkinson’s Disease Patients Using Video-
Based Activity Classification. IEEE Transactions
on Neural Systems and Rehabilitation Engineering,
26(11):2189–2199.
Moncada, L. V. V. (2011). Management of Falls in Older
Persons: A Prescription for Prevention. American
Family Physician, 84(11):1267–1276.
NICE (2013). National Institute for Health and Care Ex-
cellence. Falls in older people: assessing risk and pre-
vention. Clinical guideline [CG161]. Technical report,
NICE.
NodeNs Medical Ltd. (2023). Millimetre Wave Radar.
https://nodens.eu.
Rajab, K. Z., Wu, B., Alizadeh, P., and Alomainy, A.
(2021). Multi-target tracking and activity classifica-
tion with millimeter-wave radar. Applied Physics Let-
ters, 119(3):034101.
Richards, M. A. (2014). Fundamentals of Radar Signal
Processing. McGraw-Hill Education, New York, 2nd
edition edition.
Savoie, P., Cameron, J. A. D., Kaye, M. E., and
Scheme, E. J. (2020). Automation of the Timed-
Up-and-Go Test Using a Conventional Video Camera.
IEEE Journal of Biomedical and Health Informatics,
24(4):1196–1205. Conference Name: IEEE Journal
of Biomedical and Health Informatics.
Soubra, R., Mourad-Chehade, F., and Chkeir, A. (2023).
Automation of the Timed Up and Go Test Using a
Doppler Radar System for Gait and Balance Analysis
in Elderly People. Journal of Healthcare Engineering,
2023:e2016262. Publisher: Hindawi.
Spina, S., Facciorusso, S., D’ascanio, M. C., Morone, G.,
Baricich, A., Fiore, P., and Sandamato, A. (2022).
Sensor based assessment of turning during instru-
mented Timed Up and Go Test for quantifying mo-
bility in chronic stroke patients. European Journal of
Physical and Rehabilitation Medicine, 59(1):6–13.
Sun, R. and Sosnoff, J. J. (2018). Novel sensing technology
in fall risk assessment in older adults: a systematic
review. BMC Geriatrics, 18(1):14.
Takayanagi, N., Sudo, M., Yamashiro, Y., Lee, S.,
Kobayashi, Y., Niki, Y., and Shimada, H. (2019).
Relationship between Daily and In-laboratory Gait
Speed among Healthy Community-dwelling Older
Adults. Scientific Reports, 9(1):3496. Number: 1 Pub-
lisher: Nature Publishing Group.
Taylor, K. I., Staunton, H., Lipsmeier, F., Nobbs, D., and
Lindemann, M. (2020). Outcome measures based
on digital health technology sensor data: data- and
patient-centric approaches. npj Digital Medicine,
3(1):1–8. Number: 1 Publisher: Nature Publishing
Group.
WHO (2021). World Health Organization fact sheet on
falls providing key facts and information on scope
of the problem, who is at risk, prevention, who
response. Falls, https://www.who.int/news-room/fact-
sheets/detail/falls.
Yu, Z., Taha, A., Taylor, W., Zahid, A., Rajab, K., Hei-
dari, H., Imran, M. A., and Abbasi, Q. H. (2022).
A Radar-Based Human Activity Recognition Using a
Novel 3-D Point Cloud Classifier. IEEE Sensors Jour-
nal, 22(19):18218–18227.
ICT4AWE 2024 - 10th International Conference on Information and Communication Technologies for Ageing Well and e-Health
168
