User Story Tutor (UST) to Support Agile Software Developers
Giseldo da Silva Neo
1 a
, Jos
´
e Ant
˜
ao Beltr
˜
ao Moura
2 b
, Hyggo Almeida
2 c
,
Alana Viana Borges da Silva Neo
2 d
and Olival de Gusm
˜
ao Freitas J
´
unior
3 e
1
Campus Vic¸osa, Federal Institute of Alagoas, Vic¸osa, Brazil
2
Center for Electrical and Computer Engineering, Federal University of Campina Grande, Campina Grande, Brazil
3
Institute of Computing, Federal University of Alagoas, Macei
´
o, Brazil
Keywords:
User Story, Story Points, Education, Recommendation, Readability.
Abstract:
User Stories record what must be built in projects that use agile practices. User Stories serve both to estimate
effort, generally measured in Story Points, and to plan what should be done in a Sprint. Therefore, it is essential
to train software engineers on how to create simple, easily readable, and comprehensive User Stories. For that
reason, we designed, implemented, applied, and evaluated a web application called User Story Tutor (UST).
UST checks the description of a given User Story for readability, and if needed, recommends appropriate
practices for improvement. UST also estimates a User Story effort in Story Points using Machine Learning
techniques. As such UST may support the continuing education of agile development teams when writing and
reviewing User Stories. UST’s ease of use was evaluated by 40 agile practitioners according to the Technology
Acceptance Model (TAM) and AttrakDiff. The TAM evaluation averages were good in almost all considered
variables. Application of the AttrakDiff evaluation framework produced similar good results. Apparently,
UST can be used with good reliability. Applying UST to assist in the construction of User Stories is a viable
technique that, at the very least, can be used by agile developments to complement and enhance current User
Story creation.
1 INTRODUCTION
Every year, a report that consolidates data from tech-
nology projects from different companies in several
countries is published on the internet by the Stan-
dish Group International Organization. The report is
called Chaos Report (StandishGroup, 2015). This re-
port indicates that less than 1/3 of the surveyed soft-
ware technology projects were completely successful.
Most of the projects did not reach completion within
the planned time and cost budget estimated.
Software development is a complex process that
involves many variables and is prone to several fail-
ures (Sommerville, 2011). Much of this failure is
related to the specification of what should be done
and other factors. To minimize this problem some
methodologies and frameworks, like Agile methods,
a
https://orcid.org/0000-0001-5574-9260
b
https://orcid.org/0000-0002-6393-5722
c
https://orcid.org/0000-0002-2808-8169
d
https://orcid.org/0009-0000-1910-1598
e
https://orcid.org/0000-0003-4418-8386
can provide a conceptual structure for conducting this
software engineering projects.
Agile can be understood as a set of behaviors, pro-
cesses, practices, and tools used to create products
and subsequently make them available to end users
(Cohn, 2005). One of the best-known representatives
of Agile methods is SCRUM (Sutherland, 2014). It
focuses primarily on the aspect of what must be done.
In SCRUM requirements must be specified at an ad-
equate level of clarity, neither complex nor too rigid.
An important part of this method is writing, interpret-
ing, and implementing what is called a User Story.
A User Story is a short and simple sentence about
a feature (written from the perspective of the user who
wants it) and is used to define the scope of a software
project (Cohn, 2004). It is a requirements analysis
technique that captures the “who”, “what” and “why”
concisely and simply, usually limited in detail, so that
it can be written by hand on a small note card of paper.
These User Stories are generally stored in software
that manages all the project life-cycle (Jadhav et al.,
2023). By analyzing these raw data, recorded in these
tools, we can extract information for various software
Neo, G., Moura, J., Almeida, H., Neo, A. and Freitas Júnior, O.
User Story Tutor (UST) to Support Agile Software Developers.
DOI: 10.5220/0012619200003693
Paper published under CC license (CC BY-NC-ND 4.0)
In Proceedings of the 16th International Conference on Computer Supported Education (CSEDU 2024) - Volume 2, pages 51-62
ISBN: 978-989-758-697-2; ISSN: 2184-5026
Proceedings Copyright © 2024 by SCITEPRESS – Science and Technology Publications, Lda.
51

engineering research (Tawosi et al., 2022a).
However, writing a good User Story can be dif-
ficult. The User Story can be very shallow and not
present adequate detail to understand the expected fi-
nal result, or, conversely, it can be too comprehensive.
For example: A stakeholder may confuse the level of
detail of a User Story and write the scope of an entire
module or system, which is not appropriate. Also, the
quality of User Stories can have a big impact when
the agile team makes estimates. The writing of good
user stories, which can be used to estimate effort, ap-
pears as one of the 5 most important agile problems
informed by 119 developers (Andrade, 2021).
Improving the creation of the User Story is crucial
for better planning and consequently the success of
the project. Therefore, the objective of this study is to
assist the User Story creation process, recommending
improvements, using natural language processing in
an intelligent learning environment, i.e., a pedagog-
ical agent that assists in the learning process, char-
acterizing itself as a tutor of content or more adapted
strategies. The hypothesis is that this environment can
help agile teams build better user stories. An expected
contribution is to help development teams that use ag-
ile practices to build better user stories.
The tool User Story Tutor (aka UST), proposed
in this article, receives as input a User Story text in
English and presents personalized recommendations
for improving it, with the support of a large language
model (LLM). LLMs are very large deep learning
models that are pre-trained on vast amounts of data.
The tool also presents a prediction in Story Points,
generated by a machine learning algorithm trained
with data from other projects. The user is also pre-
sented with the User Story’s readability indexes, as
they can be used to represent an indicator of text clar-
ity.
We use the Design Science Research search
methodology with 3 phases: problem identification,
solution design, and evaluation to build the proposed
tool (Wieringa, 2014). For evaluation, a survey was
carried out with the support of the Technology Accep-
tance Model (TAM) framework (Davis et al., 1989)
and the AttrakDiff evaluation framework (Hassenzahl
et al., 2003). 40 agile practitioners who did not en-
gage in UST’s development, evaluated the proposal
solution and responded to the Survey. The TAM and
AttrakDiff evaluation results indicate that UST meets
the established objectives, with good acceptance from
participants.
The remainder of the paper is organized as fol-
lows. Section 2 summarizes the main concepts that
facilitate the understanding of subsequent sections.
Section 3 discusses the methodology and method-
ological artifacts adopted in UST’s R&D. Section 5
brings more technical details of UST. Section 4 ad-
dresses UST’s evaluation results. Section 6 is devoted
to related work. Section 7 explores threats to the va-
lidity of our investigation and its results. Lastly, Sec-
tion 8 offers the final considerations.
2 BACKGROUND
2.1 User Stories
User Stories are a central piece in the development of
requirements for teams that use agile development. A
characteristic of agile methods is their focus on fast,
value-added deliveries in short periods, dealing with
changes as quickly as possible (Dyb
˚
a and Dingsøyr,
2008). This approach has shown results and has been
used in project management (PMI, 2017), both in in-
dustry (Trimble et al., 2016; Rigby et al., 2018) and
in government (Mergel, 2016).
SCRUM is an agile method based on fixed time
cycles called sprints, where teams work to achieve
well-defined objectives; these objectives are repre-
sented in the Product Backlog, a list of things to do
that is constantly updated and re-prioritized (Suther-
land, 2014). Software requirements are usually stored
in User Stories. These artifacts describe the activities
that the development team will estimate and build and
are written in natural language.
Most teams that use User Stories, or even the agile
method, also use software tools to manage the project
and mainly to keep a record of their user stories (Jad-
hav et al., 2023). By analyzing the data recorded
by these tools we can extract information for vari-
ous software engineering research, including research
on how to improve these same User Stories (Jim
´
enez
et al., 2023).
GitLab is one of these management tools used
by agile teams to record User Stories (Choudhury
et al., 2020). It allows software engineers to automate
many actions during the development cycle, includ-
ing recording and changing User Stories (Dimitrijevi
´
c
et al., 2015). In GitLab, the User Story is registered
as an Issue, and for each User Story various pieces
of information are stored, such as the title, the task
description, and its estimate in Story Points.
This data stored in these management tools can
support decision-making in various software engi-
neering scenarios, such as: assigning User Stories
(Mani et al., 2019), improving the description of
User Stories (Chaparro et al., 2017), iteration plan-
ning (Choetkiertikul et al., 2018), sentiment analy-
sis of developers who write User Stories (Ortu et al.,
CSEDU 2024 - 16th International Conference on Computer Supported Education
52

2015; Ortu et al., 2016; Valdez et al., 2020), effort es-
timation of User Stories (Porru et al., 2016; Soares,
2018; Dragicevic et al., 2017; Choetkiertikul et al.,
2019; Tawosi et al., 2022b), and prioritization of User
Stories (Gavidia-Calderon et al., 2021; Huang et al.,
2021; Umer et al., 2020).
2.2 Recommendation Systems
Recommendation systems are software tools and
techniques that provide suggestions for items that are
more likely to arouse the interest of a particular user
(Ricci et al., 2010). Recommendations are important
for the learning process by allowing teachers and stu-
dents to find content more appropriately, according to
their profile and needs.
The evolution of Recommendation Systems is
moving towards a set of hybrid techniques, which
combine two or more different Recommendation
techniques, to resolve the limitations and obtain the
advantages of each of them (Bobadilla et al., 2013).
A hybrid Recommendation system is a term used
to describe any Recommendation system that com-
bines several Recommendation techniques to pro-
duce an output. Burke (2007) cites the following
types: Collaborative, Content-based, demographic,
and knowledge-based (Burke, 2007).
Recommendation systems have gained a lot of
popularity in the educational field, generating various
types of recommendations for students, teachers, and
schools. They can reduce student information over-
load by recommending the “right” information at the
right time and in the right format of interest to the
student (Odilinye and Popowich, 2020).
More recently, LLM-type models (for example,
ChatGPT from OpenAI) can be also used for recom-
mendations. OpenAI is the company behind an LLM
called ChatGPT. They offer this large-scale multi-
modal model to be used for third parties in situations
where reliability is not critical (OpenAI, 2023).
Despite some problems with the LLM recommen-
dation approach: responses from an LLM are not
completely reliable, have a limited context window,
and do not learn (OpenAI, 2023). They can be useful
in specific domains. They are suitable in situations
where there are well-defined intentions, for example,
opening a bank account, scheduling an air ticket, or
improving a User Story, given their controlled struc-
ture and predictable output. In this study, OpenAI will
be used as a synonym for OpenAI API, or even Chat-
GPT, and in the context of this paper, a recommen-
dation is a text to improve the User Story, which the
system suggests to the user.
2.3 Readability Indexes
There are some readability indexes commonly used
in the literature to predict the reading ease of the text.
They are used to determine the readability of an En-
glish passage and they are already used in fake news
and opinion spam detection. This section describes
the 4 most common of them.
Readability indexes can be interpreted as a numer-
ical indicator of how much easier it is for other peo-
ple to read writing text (DuBay, 2004). To extract this
numerical information some of the algorithms use the
count of words, characters, sentences, syllables, and a
list of complex words in their formula.
Readability indexes have been used by educators
since 1920. In 1980 there were already 200 known
calculation formulas (DuBay, 2004). They have al-
ready been criticized by researchers, who point out
their limitations (Koenke, 1971). However, empirical
experiments confirmed the relationship between these
indexes and the readability of the text (Bogert, 1985).
Gunning’s Fog Index is the most frequently used
and studied index and has been extensively used to
analyze text (Bogert, 1985). It is a numerical number
assigned to a given text that uses words, sentences,
and a list of complex words in their formula. The
higher the value, the more complex the text. It was
created by Robert Gunner in 1954. The Greater the
percentage of complex words, the harder the text is to
read. The Higher the index, the lesser the readabil-
ity. His algorithm and method of calculation are well
documented (Gross and Sadowski, 1985). It can be
computed by adding the average sentence length and
the percent of complex words (words of three or more
syllables) and multiplying that sum by 0.4. Like in
the formula presented in Equation 1.
0.4 ·
words
sentences
+ 100 ·
words complex
words
(1)
Another index of text readability is Flesch Read-
ing Ease, according to (Textstat, 2023). The higher
the value, the more difficult it is to read the text.
Its maximum value is 121.22. There is no mini-
mum value, negative scores are also valid. Equation 2
presents the calculation of the Flesch Reading Ease. It
is one of the oldest and most widely used tests and is
only dependent on two factors: The Greater the aver-
age sentence length, the harder the text is to read. The
greater the average number of syllables in a word, the
harder the text is to read. The higher the score, the
greater the readability.
User Story Tutor (UST) to Support Agile Software Developers
53

206.835 −1.015·
words
sentences
−84.6 ·
syllables
words
(2)
Coleman Liau Index is another complexity index
(Textstat, 2023), but this time using another Equa-
tion 3. Where L is the average number of letters per
100 words, and S is the average number of sentences
per 100 words.
CLI = 0.0588 · L − 0.296 · S − 15.8 (3)
Finally, the Automated Readability Index is calcu-
lated from the following Equation 4 (Textstat, 2023).
4.71 ·
characters
words
+ 0.5 ·
words
sentences
− 21.43
(4)
3 METHODOLOGY
The research methodology used in this research was
Design Science Research (Wieringa, 2014). We de-
signed a web application called User Story Tutor
(UST) that uses Natural Language Processing, Read-
ability Indexes and Machine Learning Prediction as a
proof of concept to improve User Story writing. We
used a survey, supported by a questionnaire in Google
Forms, to evaluate UST. The development was carried
out in the following stages:
• Literature review;
• Design of a predictive model that predicts the
number of Story Points from the User Story us-
ing Machine Learning;
• Definition of the basic text readability indexes that
can be extracted from User Stories;
• Design of a recommendation module via querying
the OpenAI API;
• Implementation all 3 modules as a web applica-
tion;
• Internal evaluation using many User Stories from
real projects;
• Evaluation with participants in a Survey;
• Qualitative and quantitative analysis of the Survey
results.
To evaluate UST, we carried out a survey based on
the Technology Acceptance Model (TAM) framework
(Davis et al., 1989) and AttrakDiff evaluation frame-
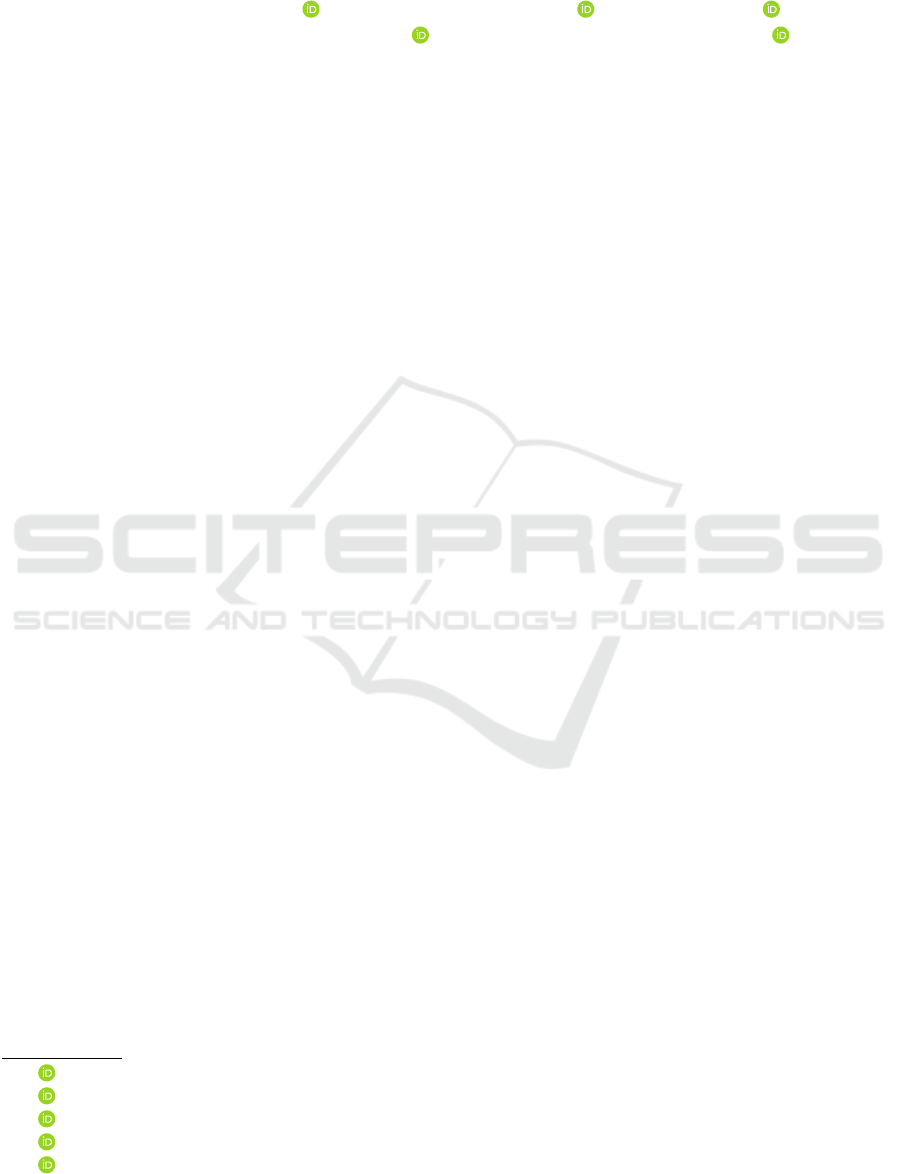
work (Hassenzahl et al., 2003). TAM is an informa-
tion systems theory that models how users accept and
use technology - please see Figure 1. For the TAM
statistical test, Cronbach’s alpha was used. The At-
trakDiff (Hassenzahl et al., 2003) test presents qual-
ity factors (hedonic and pragmatic) that can help to
better evaluate the proposal, complementing the TAM
framework. The Survey collected participants’ per-
ceptions and suggestions regarding UST, whose ob-
jective is to assist agile practitioners in building better
User Stories. The questions used in the survey are
presented in Section 5.
UST’s architecture was divided into 3 modules
(Recommender, Estimator, and Readability) and for
each module, certain procedures were selected and
executed. These selected general procedures will be
detailed in the following paragraphs.
The Recommender module is responsible for rec-
ommending improvements to User Stories by return-
ing text in natural language. The LLM model used
(made available by OpenAI) is already trained with a
large amount of text, extracted from the entire internet
(Torrent et al., 2023). However, customization of the
prompt is necessary to better personalize the return.
To customize the response from the OpenAI LLM
model, we send a prompt to configure the return ac-
cording to the needs of the recommendation system.
Following OpenAI’s guidelines for building effective
prompts, 3 main recommended techniques were used
in the prompt design.
1. Clarity in instruction
We seek a clear and precise prompt to not gen-
erate doubts when returning the recommendation.
The probability of a good return recommendation
depends on the objectivity of the hidden prompt
sent along with the recommendation.
2. Split complex tasks into simpler tasks
Intending to limit the task, we sent (a prompt) text
to limit the set of return possibilities, as complex
tasks generally have a higher error rate than sim-
pler task requests;
3. Test changes
Several interactions were necessary to create the
prompt used in search of improvements and fol-
lowing the good practices recommended by Ope-
nAI itself.
The Estimator module uses a supervised learning
algorithm, selected according to its best prediction ca-
pacity to predict the Story Points from the informed
User Story text. To elaborate the predictor module we
followed the techniques: data collection; data explo-
ration; data preparation; creation, training, and valida-
tion; adjustment of hyperparameters, and implemen-
tation of the model.
The User Story Estimator predictor was trained
with other User Stories from other agile projects. This
CSEDU 2024 - 16th International Conference on Computer Supported Education
54
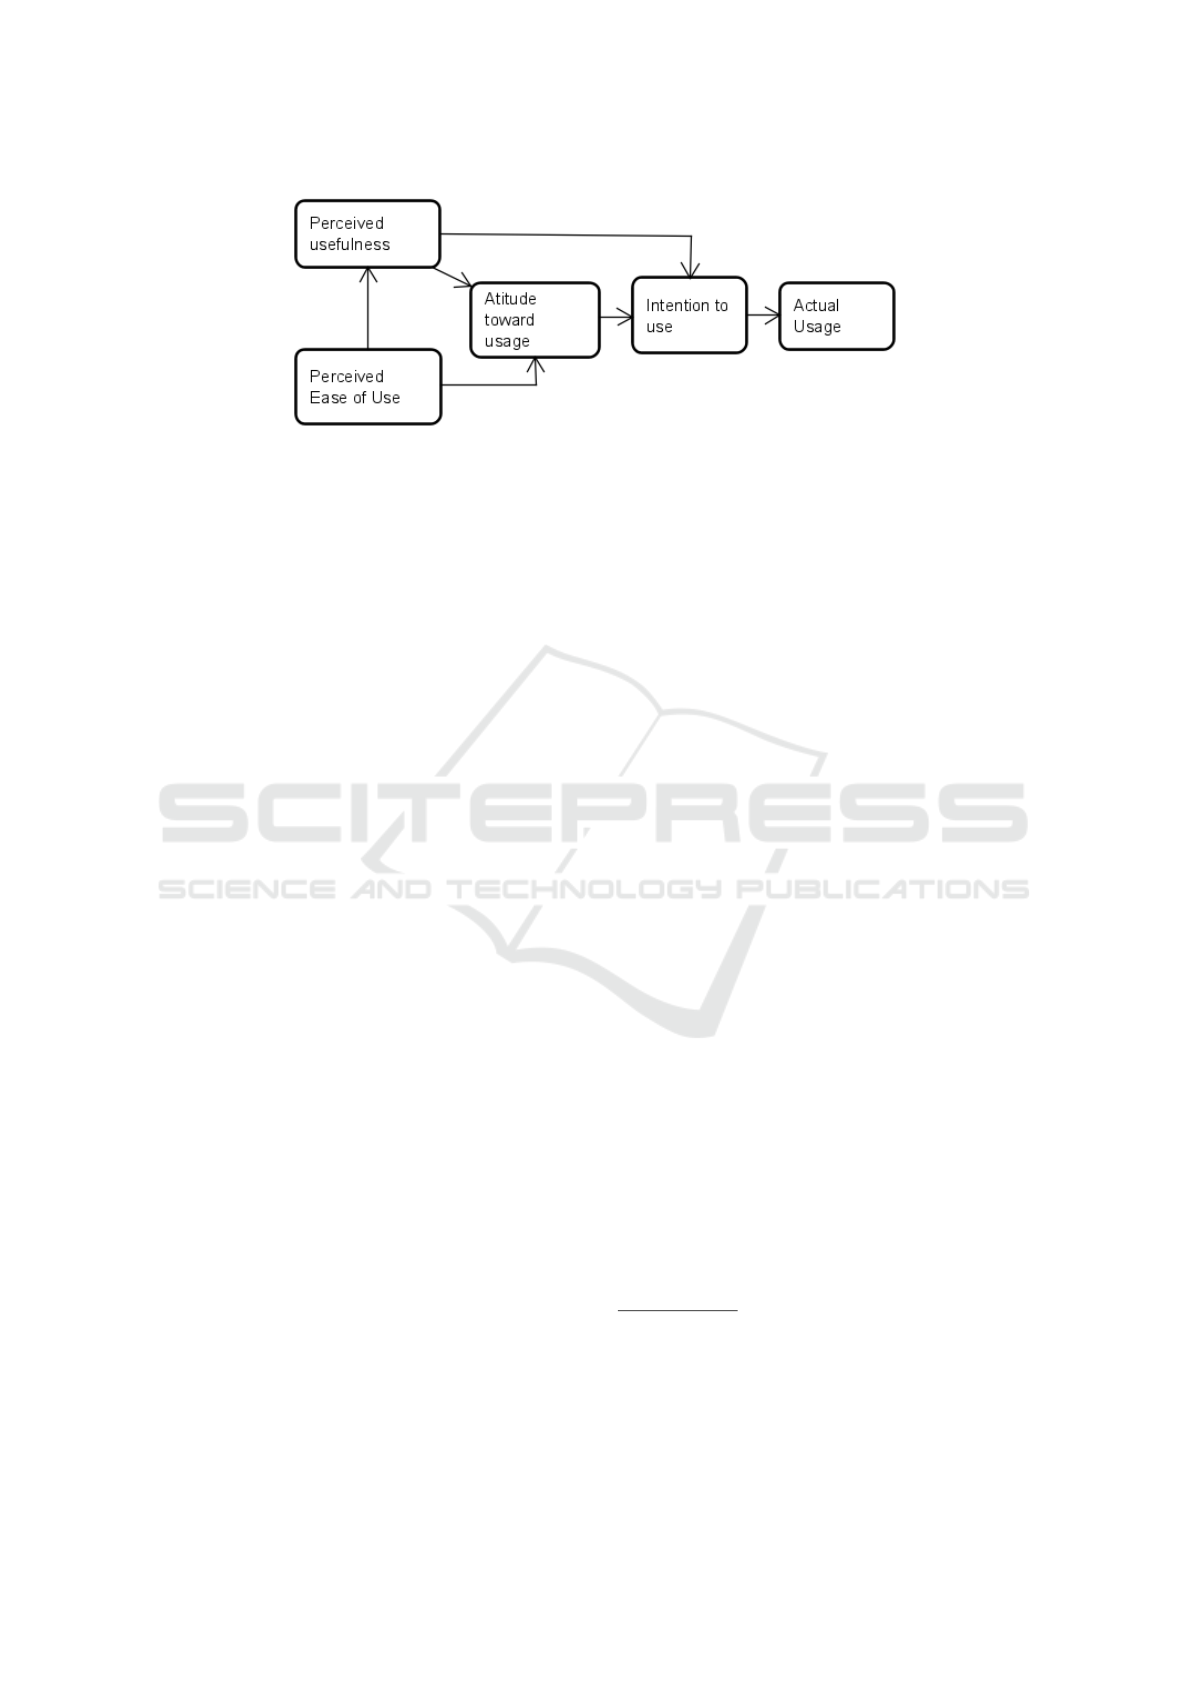
Figure 1: TAM. Adapted from (Alomary and Woolard, 2015).
dataset was collected from real open-source projects
extracted from an open-source repository. More de-
tails of the dataset are presented in Section 4.1. The
metric used to select the best algorithm and for hy-
perparameters adjusting was the Mean Absolute Er-
ror with cross-validation. In the end, The predictor
model was trained with all the data and made avail-
able for the proposed application.
Finally, the module related to Readability presents
4 text readability indexes: Gunning Fog, Automated
readability index, Coleman Liau Index, and Flesch
Reading Ease (please refer to Section 2). But it is im-
portant to highlight that for this proposal, to facilitate
the interpretation of the readability index in general,
a variable called Final Result was also created, which
is the arithmetic mean of the 4 selected Indexes.
4 THE USER STORY TUTOR
This section presents an overview of the technologies
used to build the User Story Tutor (aka UST), its high-
level architecture, the dataset used, and its application
interface.
Our idea is that UST supports agile teams during
the construction of User Stories and assists the de-
velopment process during the User Story preparation
phase and in estimating task effort. UST consists ba-
sically of a web application that can be accessed us-
ing a browser on mobile devices, PCs, and notebooks.
UST uses an LLM provided by OpenIA to recom-
mend improvements and present readability indexes.
The main parts of the tool are discussed below.
The application was designed around 3 modules
with well-defined functions. The Recommender mod-
ule responds to User Story recommender requests. It
is responsible for maintaining the prompt and com-
bining it with the text of the new User Story, query-
ing OpenAI via API, and preparing the return for
presentation to the user. The module that performs
User Story estimates in Story Points uses a predictive
model, already trained with historical data to assist
developers in their estimates, acting as a reference for
the team responsible for estimating effort. Readabil-
ity indexes are extracted from text with basic natural
language processing techniques. An image of the ar-
chitecture is presented in Figure 2.
For coding, we used StreamLit
1
- a library for
building open-source applications for machine learn-
ing and data science. Python
2
was used as the
language - a programming language that has been
increasing its market share, mainly in applications
that use machine learning. The Recommender Mod-
ule performs a query to OpenAI. The scikit-learn li-
braries were also used
3
. All source-code of the project
was available at Github
4
. The UST can be tested at
StreamLit Cloud
5
.
4.1 Dataset
We have made a new dataset (aka NEODATASET)
available together with UST. This dataset encom-
passes data from 34 software development projects,
with 40.014 User Stories taken from GitLab reposi-
tories, totaling 163.897 Story Points. It is made avail-
able on GitHub
6
so that the entire interested commu-
nity can contribute, similarly to what happens with
other datasets.
This dataset was mined during January 2023 and
April 2023. The mining process targeted GitLab’s
top open-source projects. The selected projects em-
ploy agile software development methodologies and
had the size of their tasks recorded in Story Points.
To mine information from GitLab, we created an ex-
traction tool implemented in Python that connects to
GitLab via API
1
https://streamlit.io
2
https://www.python.org/
3
https://scikit-learn.org
4
https://github.com/giseldo/userstory
5
https://userstoryteach.streamlit.app
6
https://github.com/giseldo/neodataset
User Story Tutor (UST) to Support Agile Software Developers
55
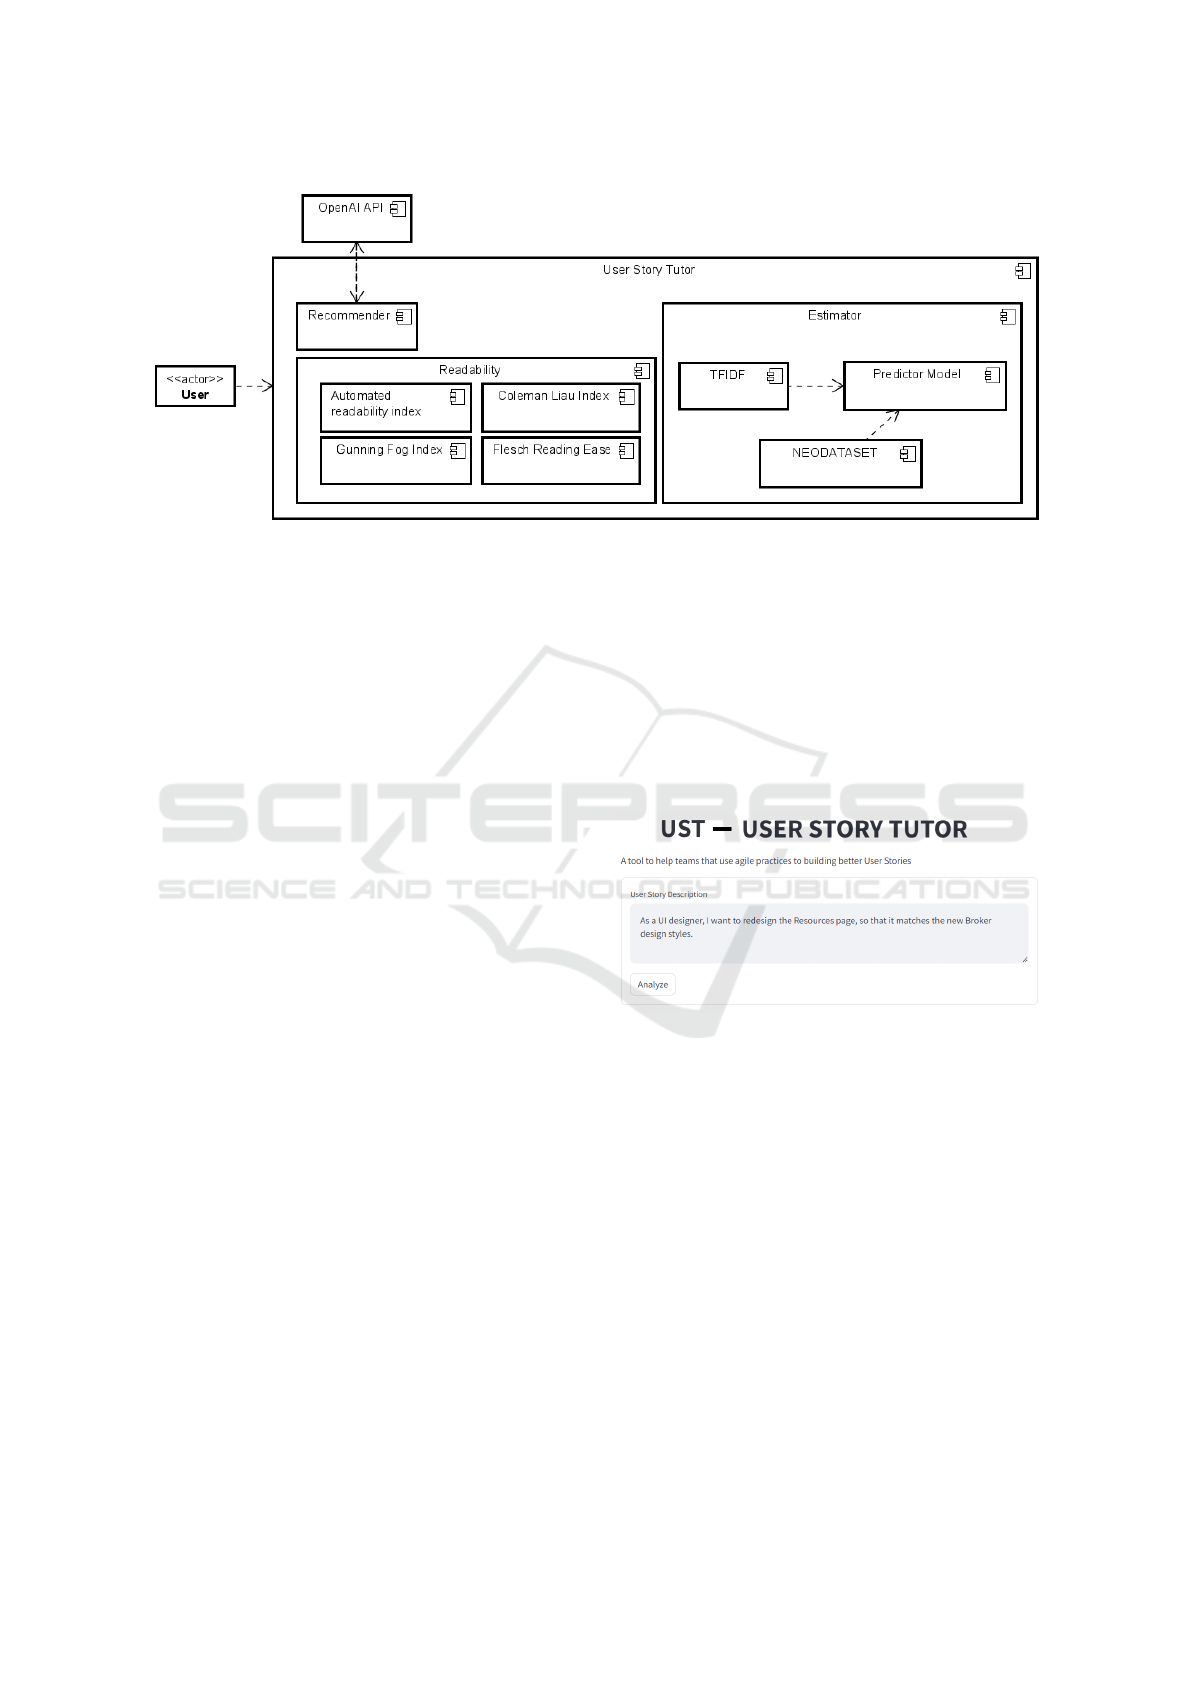
Figure 2: UST Architecture.
Only Tasks with the State attribute equal to Closed
and that have the weight attribute filled in were col-
lected. The weight field is used in GitLab to record
the effort in Story Points. More information about the
projects included in the dataset is also available di-
rectly from GitLab.
The projects in the dataset have different charac-
teristics and cover different programming languages,
different business domains, and different geographic
locations of the team. The main entity of the dataset
is the User Story (or Issue), which contains the main
information. The dataset has more than 70 attributes
and is stored in JSON and CSV format, given the sim-
plicity of dealing with both formats.
The dataset presented here includes projects
which were not used by previous studies. There
are already previous studies that extracted data from
the Jira management tool to build predictive mod-
els (Tawosi et al., 2022a; Choetkiertikul et al., 2019;
Porru et al., 2016; Scott and Pfahl, 2018), but projects
extracted from GitLab are rarer.
Just as (Tawosi et al., 2022a) did, we are sharing
all the data collected. Therefore, the most common
thing is to share only the data from the dataset con-
sidered in the study itself, as done, for example in
(Choetkiertikul et al., 2019), and not all the data col-
lected.
The expected contribution is that this data set can
assist education and research on agile software devel-
opment. Although our dataset was initially designed
for Story Points and User Story estimation training
and research, it also includes information relevant to
other software engineering aspects. In addition to pro-
viding a possibility to reproduce findings from other
studies.
4.2 User Interface
The first screen of the UST (Figure 3) is where a de-
veloper from the agile team informs their User Story.
Any User Story from any real project can be used.
Then, after the developer enters the description of the
User Story in text format, he clicks on the “Analyze”
button. The UST then initializes the necessary threads
that trigger the responses of the existing modules. The
language of the UST interface was English.
Figure 3: Home Screen.
The recommender module is a module that returns
suggestions from the developer Story description text
entered by the user (Figure 4). The model provided
by OpenAI was used, specifically the gpt-3.5-turbo.
The parameters used by the recommender module are
sent via a hidden prompt, and they are presented in
Table 1. They followed a refinement process similar
to creating a search key in a systematic literature re-
view, being revised and adapted until we reached the
final version presented with the support of the pro-
duced data set in Section 4.1.
For the Recommender module, a valid input from
the user would be this imagined User Story: “As a
UI designer, I want to redesign the Resources page,
so that it matches the new Broker design styles.” The
Recommendation text that UST would return to the
user is: “ To improve this user story, you can consider
CSEDU 2024 - 16th International Conference on Computer Supported Education
56
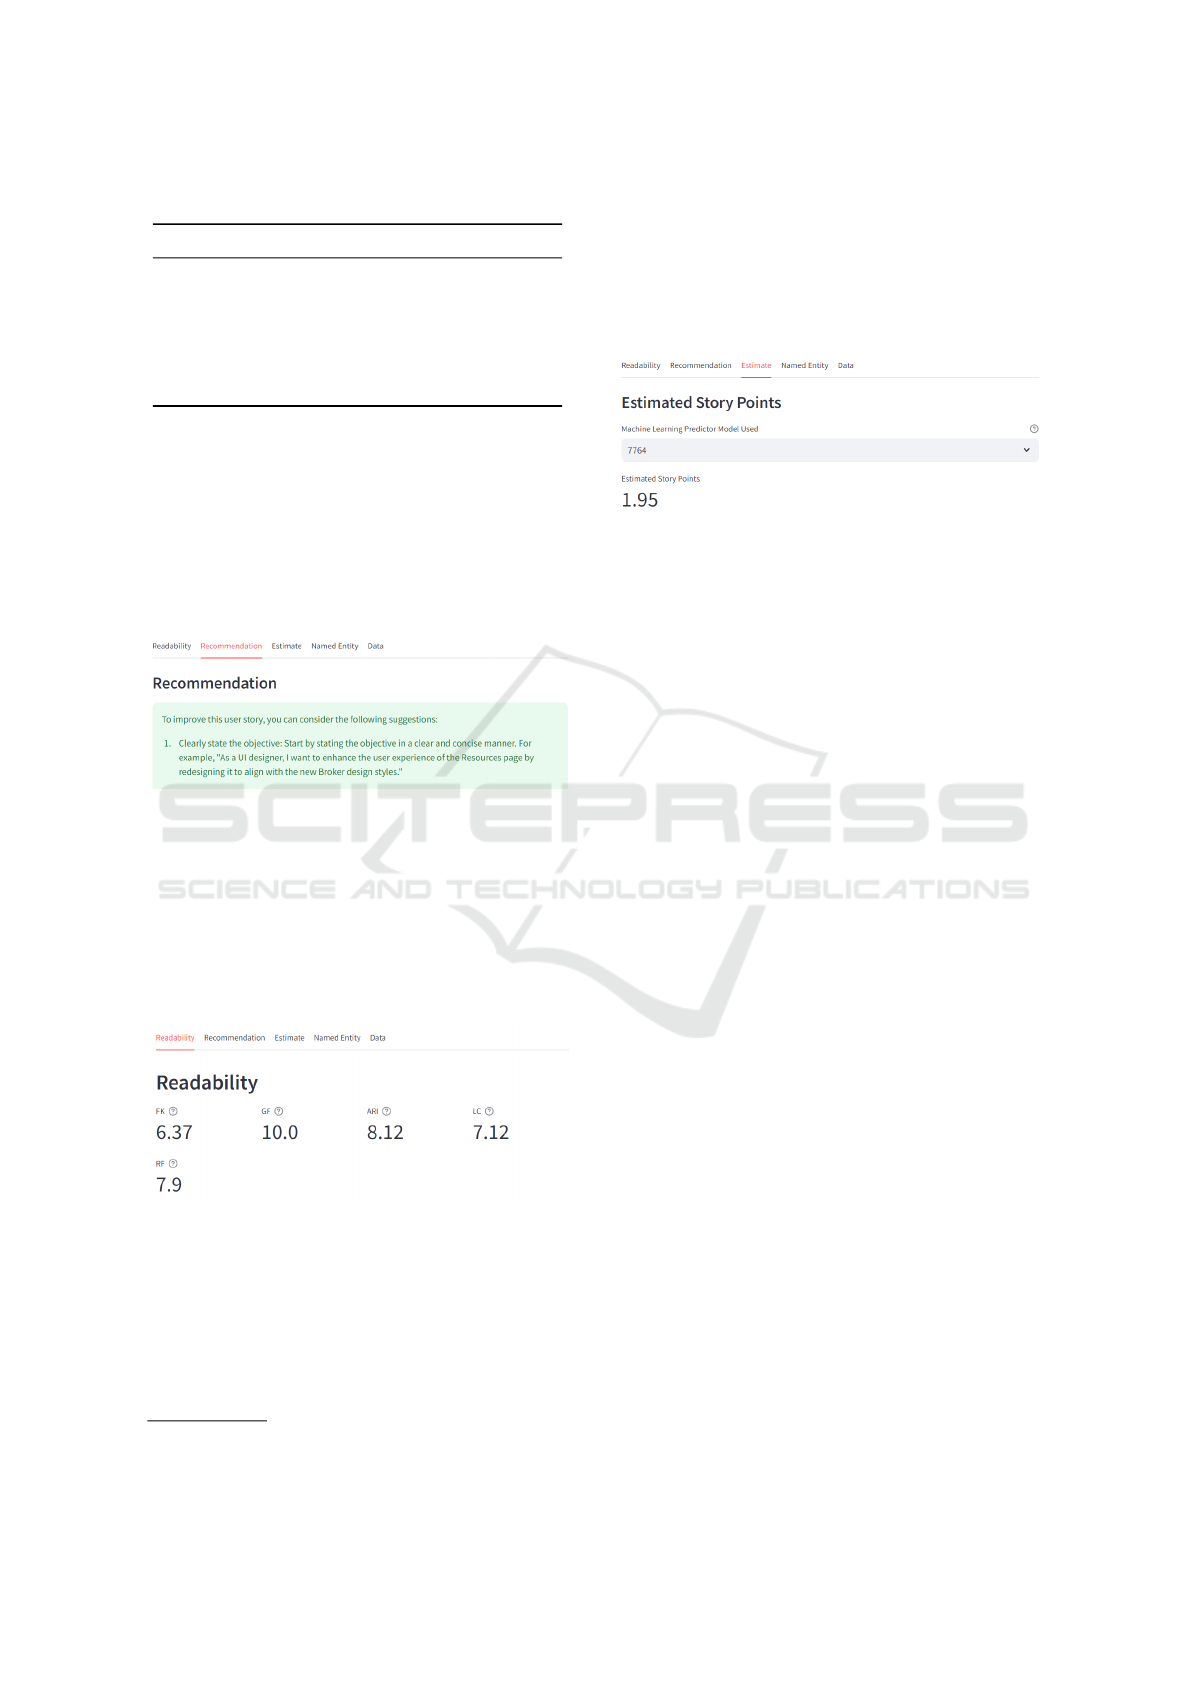
Table 1: OpenAI personalized prompt.
role content
system You are a scrum master, skilled in cre-
ating better User Stories for agile soft-
ware projects
user How can I improve this user story: +
User Story text informed by user in en-
glish
adding more details and making the objective clearer.
Here’s an improved version of the user story: As a
UI designer, I want to redesign the Resources page
to improve the user experience and align it with the
new Broker design styles, enhancing the overall con-
sistency and visual appeal of the application. Addi-
tionally, you can further refine the user story by spec-
ifying the specific changes or improvements you plan
to make to the Resources page”.
Figure 4: Recommendation Module Example.
For the User Story readability module (Figure 5),
the readability indexes of the text are extracted using
the textdescriptive library (available in Python)
7
and
presented on the screen with the “metrics” component
from StreamLit in the first tab. The purpose of the
readability module is to allow the creator of the User
Story to see some quantitative measure of how easy
the text of their User Story is to read.
Figure 5: Readability Indexes Module.
Finally, the Effort Estimation module (Figure 6)
performs an effort estimate in Story Points based on
the User Story description. The predictive model and
vectorizer used are loaded with the Joblib library. The
selected algorithm was SVM. The User Story text
is transformed into a bag-of-words using the TFIDF
7
https://pypi.org/project/textdescriptives
technique. In production, both the vectorizer and the
model are loaded into memory for prediction. After
the User Story text is transformed into a matrix with
the vectorizer, it is passed on to the model predictor,
which returns the estimate in Story Points. The loaded
Model was previously trained with data from NEO-
DATASET.
Figure 6: Estimation Module.
5 EVALUATION
This section presents a qualitative and quantitative
evaluation of the tool with the support of the TAM
framework and AttrakDiff and discusses the results.
The survey was conducted in December 2023 with
an online questionnaire in Google Forms. The ques-
tionnaire was first examined for comprehensiveness,
quality and adequacy to the investigation at hand by a
panel of 6 experts who had amongst them 7 years of
experience in agile development. The questionnaire
used a 5 level Likert scale to gauge the respondent’s
agreement (from none or level 1), passing through lit-
tle (2), neutral (3), somewhat (4) to full (level 5) with
statements made concerning UST. The experts’ com-
ments and suggestions led to the adjustment of the
questionnaire which was then applied to a sample of
respondents.
5.1 Sample Characterization
Our sample of survey respondents is made up of 40
Brazilian participants. 70% of those who responded
to the survey had worked directly with agile method-
ologies. More than half of these (56%) had worked
in a software factory and had already worked as a
member of a software development team. Of these,
20% have been Scrum Masters and 10% have been
Product Owners. The other participants had generally
participated in academic activities related to software
engineering. On average, our sample was made up
of professionals with 3 years of experience in agile
methodology.
User Story Tutor (UST) to Support Agile Software Developers
57

5.2 TAM
Each of the 4 constructs of the Technology Assess-
ment Model is analyzed below: perception of usabil-
ity, perception of ease of use, external variables, and
attitude.
The perception of usability is the level at which
a person believes that using UST improves the per-
formance of their tasks. To analyze the perception
of usability, (Table 2) the mean, median, and standard
deviation of the Likert scale responses were analyzed.
If the Mean or Median is above the threshold which
we chose to be ”3” (neutral) in our experiments, this
possibly indicates that the participants have a positive
attitude towards the perception of using the tool (Dan-
tas et al., 2019).
Evaluating the responses, it is possible to infer that
participants generally have a positive attitude toward
the perceived usability of the tool (Table 2).
Table 2: Perception of usability.
Definition Mean Med SD
V1 Using the tool is useful
to improve my User Stories
4.45 5.00 0.80
V2 I learned how to build
better User Stories after us-
ing the tool
4.07 4.00 1.10
The perception of ease of use is the Level at which
the person presents their perception of the tool in
terms of ease of learning and operation. Table 3 de-
scribes the mean, median, and standard deviation of
the responses related to perceived ease of use. All av-
erages are above the adopted threshold, therefore also
regarding good perception and ease of use of UST. A
standard deviation above one indicates a high disper-
sion in responses.
Table 3: Perceived ease of use.
Definition Mean Med SD
V3 Learning to use the tool
was easy for me
3.70 4.00 1.28
V4 Searching for informa-
tion in this tool was simple
3.72 4.00 1.09
V5 Accessing the tool is
simple
4.07 4.00 1.14
An analysis of external variables, which provides
a better understanding of what influences perceived
utility and ease of use, is presented in Table 4. A
median above 4 is a good indicator that the external
characteristics were well accepted by users.
Table 4: External variables.
Definition Mean Med SD
V6 The application’s nav-
igation attributes - menu,
icons, links, and buttons -
are clear and easy to find
4.02 4.00 1.17
V7 The tool has a good in-
terface
3.9 4.00 1.20
The data characterized as Attitude, which is the
Intention of the individual to use the tool, are pre-
sented in Table 5. In the same way, as with the other
constructs, we have a mean above the threshold.
Table 5: Attitude.
Definition Mean Med SD
V8 I believe it is better to
use the tool to help create the
user story than not to use it.
4.25 4.00 0.88
V9 I intend to use the tool to
create better user stories and
to plan my tasks better
3.85 4.00 1.15
For statistical confirmation, Cronbach’s (Gliem
and Gliem, 2003) test was used for the Likert scale
questionnaire, the same technique used by (Dantas
et al., 2019). Cronbach’s Alpha is a way to mea-
sure the internal consistency of a questionnaire or sur-
vey. Cronbach’s Alpha ranges between 0 and 1, with
higher values indicating that the survey or question-
naire is more reliable. An interpretation of Cron-
bach’s alpha is presented in Table 6.
Table 6: Internal consistency from the Survey. Adapted
from (Zach, 2023).
Cronbach Alpha Internal consistency
0.9 ≤ α Excellent
0.8 ≤ α < 0.9 Good
0.7 ≤ α < 0.8 Acceptable
0.6 ≤ α < 0.7 Questionable
0.5 ≤ α < 0.6 Poor
α < 0.5 Unacceptable
A limit adopted in this research is the Cronbach al-
pha index greater than 0.7 for the variables analyzed
and with confidence in the 95% range. From the re-
ported values, as shown in Table 7, we understand
that almost all constructs analyzed are above the es-
tablished limit. This leads to the conclusion that the
internal consistency of this survey is acceptable.
CSEDU 2024 - 16th International Conference on Computer Supported Education
58
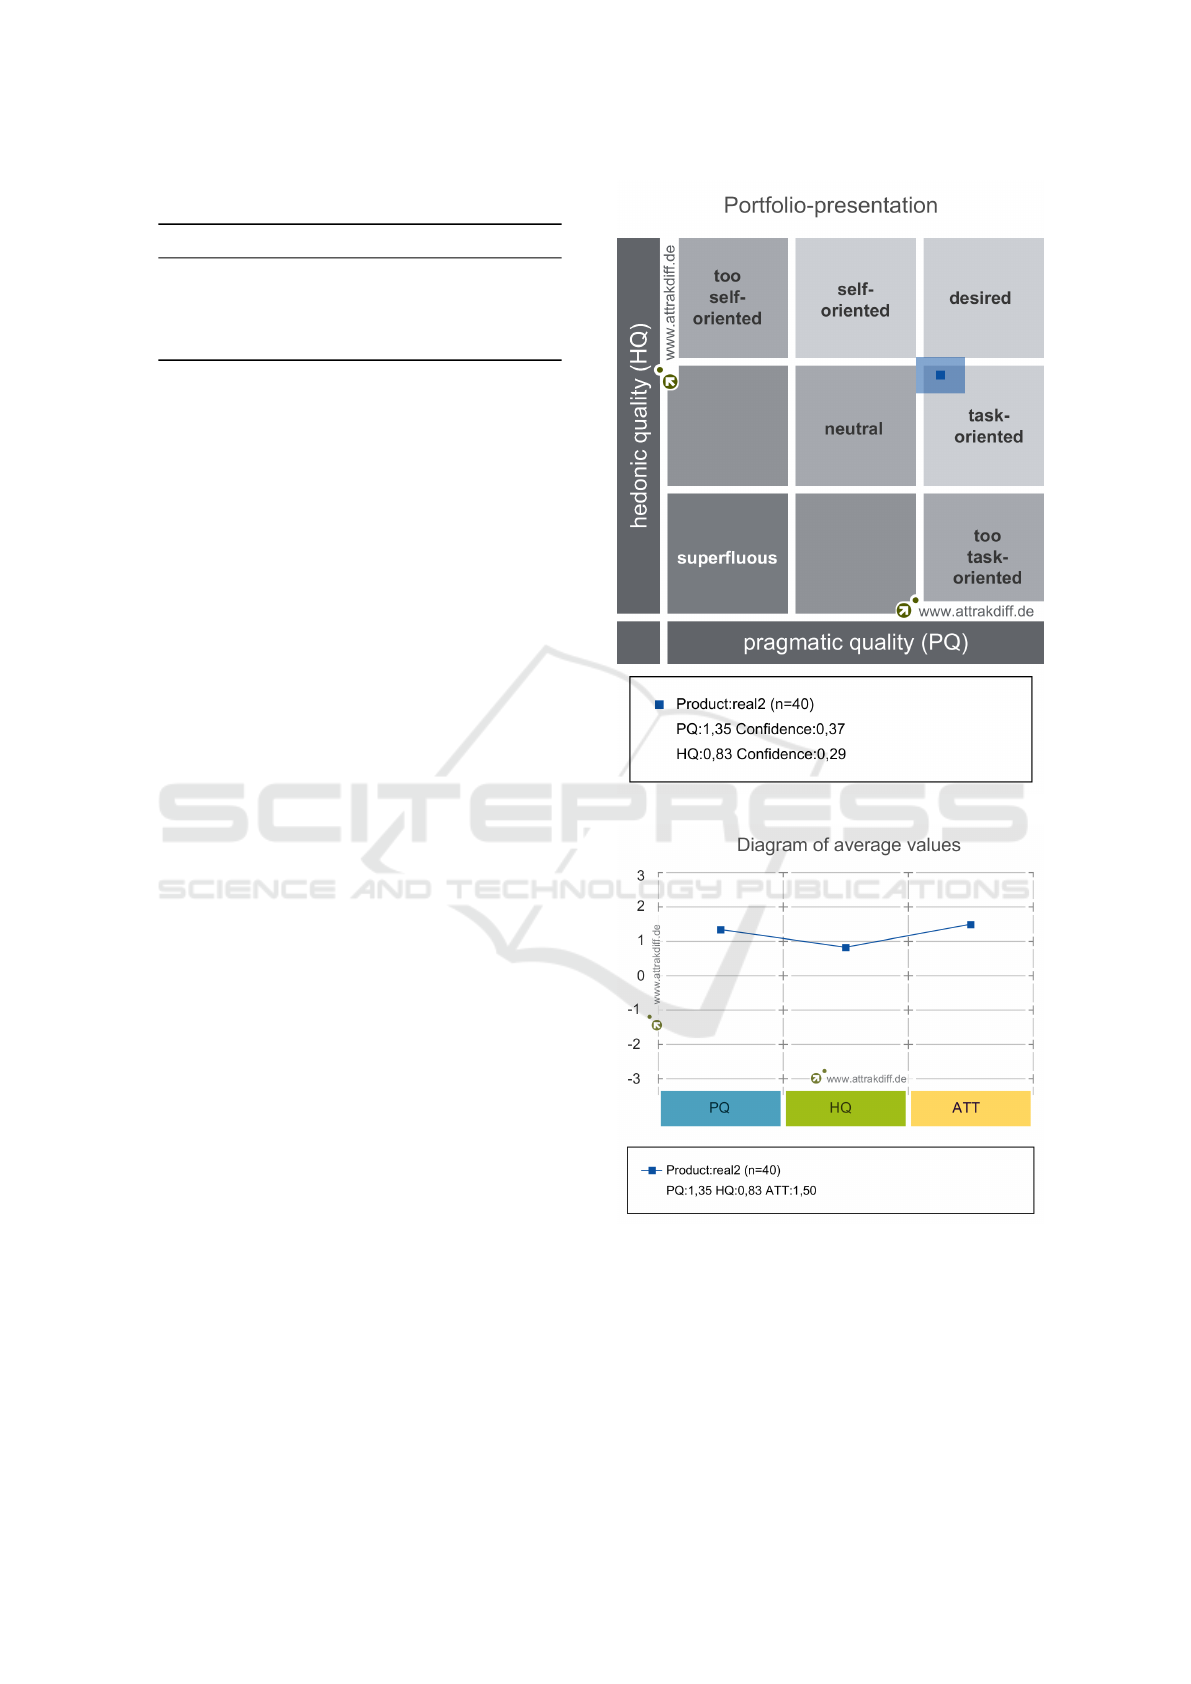
Table 7: Cronbach of TAM constructs.
constructs Cronbach IC
Usability 0.81 [0.64 0.90]
Ease of use 0.92 [0.87 0.95]
External variables 0.87 [0.77 0.93]
Attitude 0.73 [0.49 0.85]
5.3 AttrakDiff
In Figure 7 we present the portfolio of results of
the AttrakDiff test (Hassenzahl et al., 2003). This
test presents factors that can help better evaluate the
proposal, complementing what the TAM framework
presents. The AttrakDiff short test type was used,
which presents 10 questions to users and infers the
metrics reported below.
In Figure 7 the vertical axis of the portfolio view
displays the hedonic quality (bottom = low extent).
The horizontal axis shows the pragmatic quality (left
= low extent). Depending on the dimensions values
the product will lie in one or more character regions.
The bigger the confidence rectangle, the less sure one
can be about which region it belongs. A small con-
fidence rectangle is an advantage because it means
that the investigation results are more reliable and less
coincidental. The confidence rectangle shows if the
users are at one in their evaluation of the product. The
bigger the confidence rectangle, the more variable the
evaluation ratings (Hassenzahl et al., 2003). So, the
answers point to a small trust rectangle in the upper
right quadrant, as a task-oriented tool.
In Figure 8 we present the diagram of average val-
ues. The average values of the AttrakDiff dimensions
for the evaluated product are plotted on the diagram.
In this presentation, hedonic quality distinguishes be-
tween the aspects of stimulation and identity. Further-
more, the rating of attractiveness is presented (Has-
senzahl et al., 2003).
In Figure 9 we present the description of word
pairs. The mean values of the word pairs are pre-
sented here. Of particular interest are the extreme
values. These show which characteristics are particu-
larly critical or particularly well resolved (Hassenzahl
et al., 2003). Better results are placed in the posi-
tive quadrant, which can be inferred from the consol-
idated results in Figure 9. Almost all items evaluated
were in the positive quadrant, except the pair (cheap-
premium).
Figure 7: Portfolio of results.
Figure 8: Diagram of average values.
6 RELATED WORK
Improving the quality of user stories is a line of re-
search that is gaining momentum due to advances in
artificial intelligence. Generally, the most classic ap-
proaches use the transformation to an intermediate
User Story Tutor (UST) to Support Agile Software Developers
59
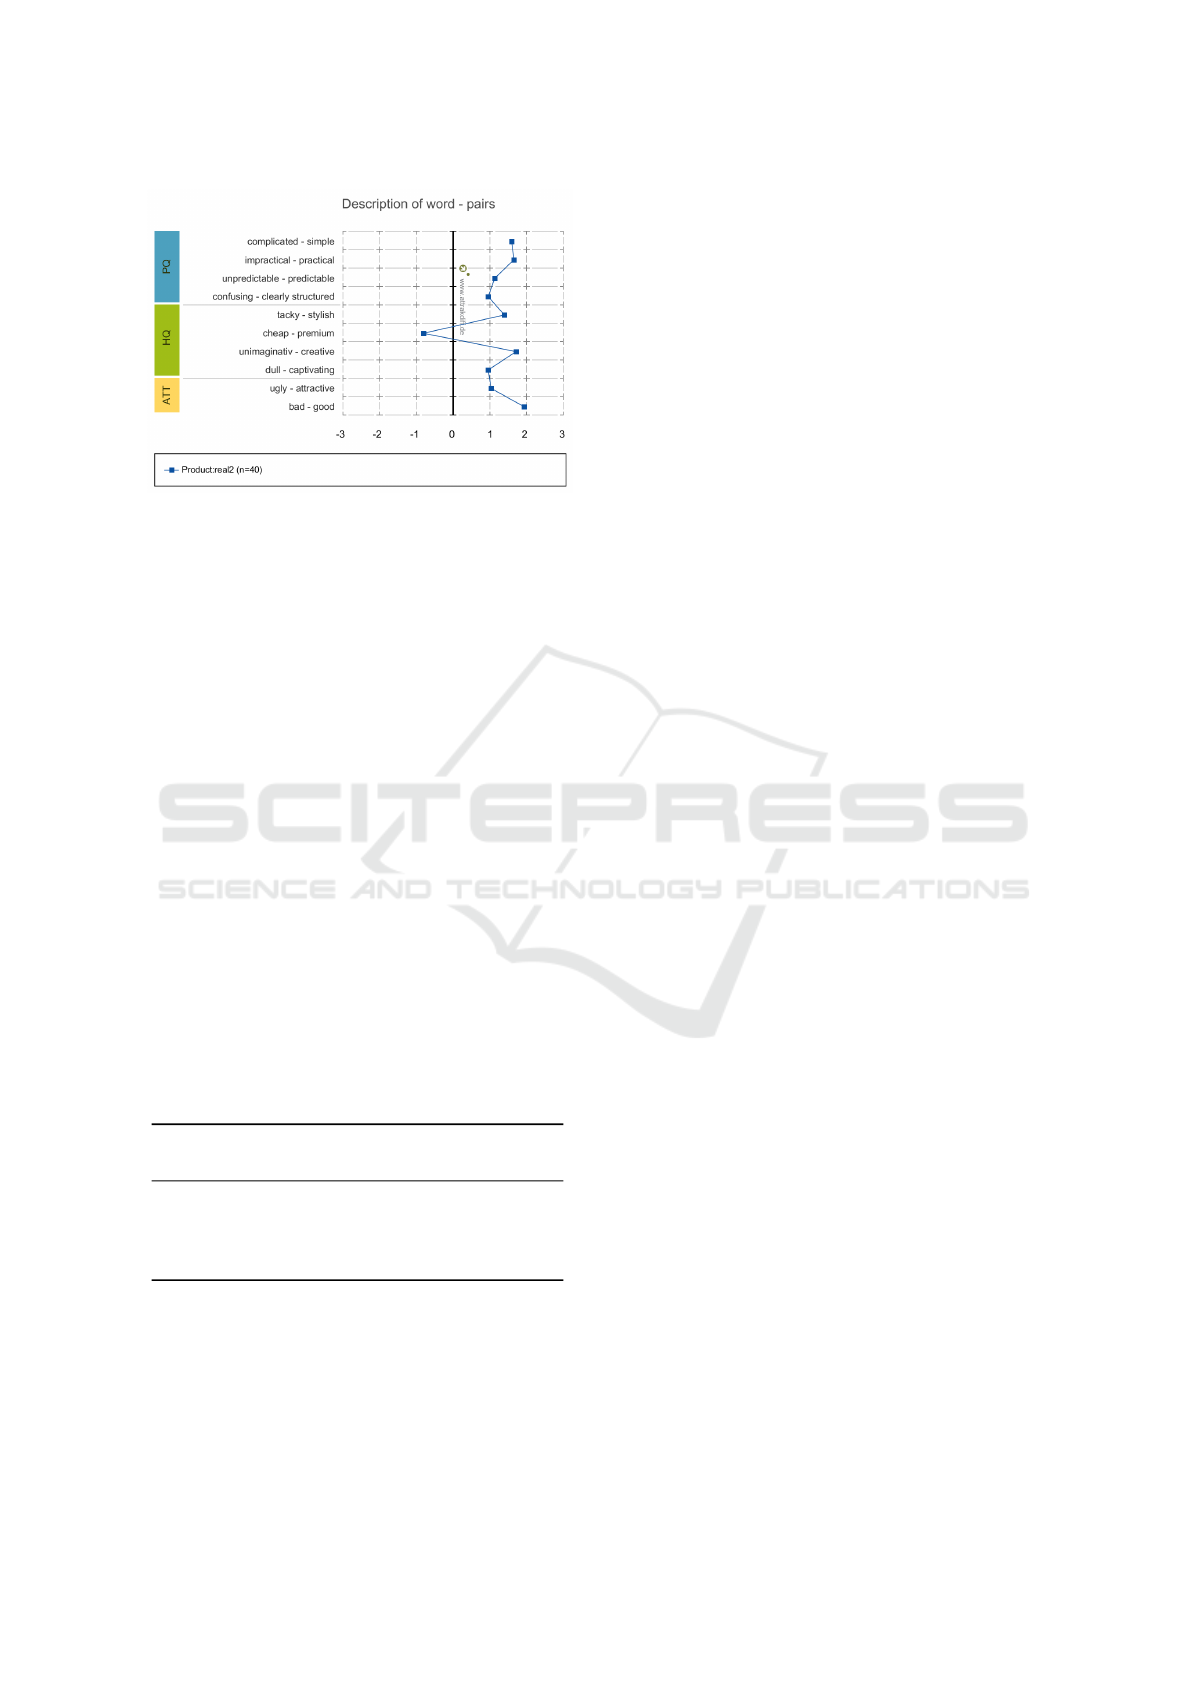
Figure 9: Description of word-pairs.
model, such as a use case (Elallaoui et al., 2018),
or some other natural language processing technique,
with a presentation of reports that can be interpreted
(e.g. AQUSA) (Lucassen et al., 2016).
Using an intermediate model to represent the User
Story adds complexity to the use of the solution,
which can be seen as an unwanted feature. Our ap-
proach does not use an intermediate model. Our ap-
proach makes use of text readability indexes, a tech-
nique already widely used for text analysis in other
areas (e.g. economics, literature), and the use of Ope-
nAI’s LLM with personalized recommendations. In
addition, the estimator module uses machine learning
with natural language processing techniques.
The proposal USQA uses natural language pro-
cessing techniques to analyze usefulness, complete-
ness, and polysemes in the user stories creation
(Jim
´
enez et al., 2023). Our proposal brings additional
techniques, such as recommendation and readability
of the User Story that can help even more. Table 8
compares UST to the AQUSA and USQA proposals
and it illustrates UST’s contribution as compared to
that of existing related work to User Story writing.
Table 8: Comparison with related work.
Tool Intermediate
Model
Recommend
Report
UST No Yes
AQUSA No No
USQA No Yes
7 LIMITATIONS AND THREATS
There is some criticism in the literature regarding the
numerical interpretation of a Likert scale question-
naire (For example, in the calculation of the Likert
scale average or mean) (F
´
avero and Belfiore, 2017).
To minimize this point, we use another framework for
analyzing software quality, the AttrakDiff.
The use of an LLM model made available by com-
panies via API (e.g. OpenAI’s ChatGPT) ties the
UST solution to a corporate company. In future work,
we intend to use and validate an open-source LLM
model.
Readability indexes must be interpreted with cau-
tion, as their formulae use only two variables: com-
plex words and long sentences. Therefore, they are
not able to measure the cohesion and coherence of a
business User Story, which covers semantic, syntac-
tic, and pragmatic factors.
Estimation in Story Points generally follows the
Fibonacci scale. In our proposal, the estimator returns
a real number between 0 and 100. This problem was
treated as a regression problem and not a classifica-
tion one. However, we can obtain probably greater
interpretability if we use the Fibonacci scale instead
of real numbers.
8 CONCLUSIONS AND
ONGOING WORK
This paper presented a proposal and evaluation of a
tool for recommending good practices in writing User
Stories with LLM, in addition to a User Story estima-
tion module with Machine Learning and presentation
of readability indexes for the User Story description.
The proposed tool was evaluated by 40 software engi-
neering practitioners. The evaluation was conducted
with the TAM and AttrakDiff frameworks. Results in-
dicate that UST meets the established objectives, with
good acceptance from its intended users.
From this investigation, one may conclude that
a tool to assist the construction of User Stories is a
viable technique that, at the very least, can be used
to educate teams on writing better User Stories. In
fact, from the evaluation experiment, one may say that
UST could help the User Stories by providing feed-
back to the agile practitioner.
The paper also presented a dataset with data from
projects mined from GitLab that were used to train
the predictive model for Story Points. This dataset
can be used in other research related to agile software
development. Work on named entity recognition to
extract entities from the User Story text is ongoing.
Independent future work could entail additional vali-
dation experiments including integration and evalua-
tion of UST with computer-based education platforms
for agile software development methods.
CSEDU 2024 - 16th International Conference on Computer Supported Education
60

REFERENCES
Alomary, A. and Woolard, J. (2015). How is technology
accepted by users? a review of technology acceptance
models and theories. IRES 17th International Confer-
ence.
Andrade, A. F. M. (2021). Uma Abordagem Baseada Em
Gamificac¸
˜
ao Para Estimativa De Esforc¸o Em Desen-
volvimento
´
Agil De Software. PhD thesis, Universi-
dade Federal de Campina Grande.
Bobadilla, J., Ortega, F., Hernando, A., and Guti
´
errez, A.
(2013). Recommender systems survey. Knowledge-
based systems, 46:109–132.
Bogert, J. (1985). In defense of the fog index. The Bul-
letin of the Association for Business Communication,
48(2):9–12.
Burke, R. (2007). Hybrid web recommender systems. The
adaptive web: methods and strategies of web person-
alization, pages 377–408.
Chaparro, O., Lu, J., Zampetti, F., Moreno, L., Di Penta, M.,
Marcus, A., Bavota, G., and Ng, V. (2017). Detecting
missing information in bug descriptions. Proceedings
of the ACM SIGSOFT Symposium on the Foundations
of Software Engineering, Part F130154:396–407.
Choetkiertikul, M., Dam, H. K., Tran, T., Ghose, A., and
Grundy, J. (2018). Predicting Delivery Capability in
Iterative Software Development. IEEE Transactions
on Software Engineering, 44(6):551–573.
Choetkiertikul, M., Dam, H. K., Tran, T., Pham, T., Ghose,
A., and Menzies, T. (2019). A Deep Learning Model
for Estimating Story Points. IEEE Transactions on
Software Engineering, 45(7):637–656.
Choudhury, P., Crowston, K., Dahlander, L., Minervini,
M. S., and Raghuram, S. (2020). GitLab: work where
you want, when you want. Journal of Organization
Design, 9(1).
Cohn, M. (2004). User stories applied: For agile software
development. Pearson Education.
Cohn, M. (2005). Agile Estimating and Planning. Pearson
Education.
Dantas, E., Costa, A. A. M., Vinicius, M., Perkusich, M. B.,
de Almeida, H. O., and Perkusich, A. (2019). An ef-
fort estimation support tool for agile software devel-
opment: An empirical evaluation. In SEKE, pages
82–116.
Davis, F. D., Bagozzi, R. P., and Warshaw, P. R. (1989).
User acceptance of computer technology: A compar-
ison of two theoretical models. Management science,
35(8):982–1003.
Dimitrijevi
´
c, S., Jovanovi
´
c, J., and Deved
ˇ
zi
´
c, V. (2015).
A comparative study of software tools for user story
management. Information and Software Technology,
57:352–368.
Dragicevic, S., Celar, S., and Turic, M. (2017). Bayesian
network model for task effort estimation in agile soft-
ware development. Journal of Systems and Software,
127:109–119.
DuBay, W. H. (2004). The principles of readability: A brief
introduction to readability research. Impact Informa-
tion, (949):1–72.
Dyb
˚
a, T. and Dingsøyr, T. (2008). Empirical studies of agile
software development: A systematic review. Informa-
tion and Software Technology, 50(9-10):833–859.
Elallaoui, M., Nafil, K., and Touahni, R. (2018). Automatic
transformation of user stories into uml use case dia-
grams using nlp techniques. Procedia computer sci-
ence, 130:42–49.
F
´
avero, L. P. and Belfiore, P. (2017). Manual de an
´
alise
de dados: estat
´
ıstica e modelagem multivariada com
Excel®, SPSS® e Stata®. Elsevier Brasil.
Gavidia-Calderon, C., Sarro, F., Harman, M., and Barr, E. T.
(2021). The Assessor’s Dilemma: Improving Bug Re-
pair via Empirical Game Theory. IEEE Transactions
on Software Engineering, 47(10):2143–2161.
Gliem, J. A. and Gliem, R. R. (2003). Calculating, inter-
preting, and reporting cronbach’s alpha reliability co-
efficient for likert-type scales. Midwest Research-to-
Practice Conference in Adult, Continuing, and Com-
munity Education.
Gross, P. P. and Sadowski, K. (1985). FOGINDEX: A read-
ability formula program for microcomputers. Journal
of Reading, 28(7):614–618.
Hassenzahl, M., Burmester, M., and Koller, F.
(2003). Attrakdiff: Ein fragebogen zur messung
wahrgenommener hedonischer und pragmatischer
qualit
¨
at. Mensch & Computer 2003: Interaktion in
Bewegung, pages 187–196.
Huang, Y., Wang, J., Wang, S., Liu, Z., Wang, D., and
Wang, Q. (2021). Characterizing and predicting good
first issues. International Symposium on Empirical
Software Engineering and Measurement.
Jadhav, D., Kundale, J., Bhagwat, S., and Joshi, J. (2023).
A Systematic Review of the Tools and Techniques in
Distributed Agile Software Development. Agile Soft-
ware Development: Trends, Challenges and Applica-
tions, pages 161–186.
Jim
´
enez, S., Alanis, A., Beltr
´
an, C., Ju
´
arez-Ram
´
ırez, R.,
Ram
´
ırez-Noriega, A., and Tona, C. (2023). Usqa:
A user story quality analyzer prototype for support-
ing software engineering students. Computer Appli-
cations in Engineering Education.
Koenke, K. (1971). Another practical note on readability
formulas. Journal of Reading, 15(3):203–208.
Lucassen, G., Dalpiaz, F., van der Werf, J. M. E., and
Brinkkemper, S. (2016). Improving agile require-
ments: the quality user story framework and tool. Re-
quirements engineering, 21:383–403.
Mani, S., Sankaran, A., and Aralikatte, R. (2019). Deep-
triage: Exploring the effectiveness of deep learning
for bug triaging. ACM International Conference Pro-
ceeding Series, pages 171–179.
Mergel, I. (2016). Agile innovation management in govern-
ment: A research agenda. Government Information
Quarterly, 33(3):516–523.
Odilinye, L. and Popowich, F. (2020). Personalized rec-
ommender system using learners’ metacognitive read-
ing activities. In Methodologies and Intelligent Sys-
tems for Technology Enhanced Learning, 10th Inter-
national Conference, pages 195–205. Springer.
OpenAI (2023). GPT-4 Technical Report. 4:1–100.
User Story Tutor (UST) to Support Agile Software Developers
61

Ortu, M., Destefanis, G., Adams, B., Murgia, A., March-
esi, M., and Tonelli, R. (2015). The JIRA repository
dataset: Understanding social aspects of software de-
velopment. ACM International Conference Proceed-
ing Series, 2015-October.
Ortu, M., Murgia, A., Destefanis, G., Tourani, P., Tonelli,
R., Marchesi, M., and Adams, B. (2016). The emo-
tional side of software developers in JIRA. Proceed-
ings - 13th Working Conference on Mining Software
Repositories, MSR 2016, pages 480–483.
PMI (2017). Success Rates Rise - 2017 9th Global Project
Management Survey. Technical report, PMI.
Porru, S., Murgia, A., Demeyer, S., Marchesi, M., and
Tonelli, R. (2016). Estimating story points from issue
reports. ACM International Conference Proceeding
Series.
Ricci, F., Rokach, L., and Shapira, B. (2010). Introduction
to recommender systems handbook. In Recommender
systems handbook, pages 1–35. Springer.
Rigby, D. K., Sutherland, J., and Noble, A. (2018). Agile
Scale: How to go from teams to hundreds. Havard
Business Review, May-June(June):1–3.
Scott, E. and Pfahl, D. (2018). Using developers’ features to
estimate story points. ACM International Conference
Proceeding Series, (106):106–110.
Soares, R. G. F. R. R. G. F. R. R. G. (2018). Effort Esti-
mation via Text Classification And Autoencoders. In
2018 International Joint Conference on Neural Net-
works (IJCNN), volume 2018-July, pages 1–8. IEEE.
Sommerville, I. (2011). Software engineering. 9th edition.
StandishGroup (2015). The chaos report.
http://www.standishgroup.com. Acessed 2023.
Sutherland, J. (2014). Scrum: the Art of Doing Twice the
Work in Half the Time. Random House.
Tawosi, V., Al-Subaihin, A., Moussa, R., and Sarro, F.
(2022a). A Versatile Dataset of Agile Open Source
Software Projects, volume 1. Association for Com-
puting Machinery.
Tawosi, V., Moussa, R., and Sarro, F. (2022b). Deep Learn-
ing for Agile Effort Estimation Have We Solved the
Problem Yet? pages 1–17.
Textstat (2023). textstat/textstat: python package to calcu-
late readability statistics of a text object - paragraphs,
sentences, articles. Acessed 2023.
Torrent, T. T., Hoffmann, T., Almeida, A. L., and Turner,
M. (2023). Copilots for linguists: Ai, constructions,
and frames. Elements in Construction Grammar.
Trimble, J., Shirley, M. H., and Hobart, S. G. (2016). Agile:
From software to mission system. 14th International
Conference on Space Operations, 2016, pages 1–8.
Umer, Q., Liu, H., and Illahi, I. (2020). CNN-Based Au-
tomatic Prioritization of Bug Reports. IEEE Transac-
tions on Reliability, 69(4):1341–1354.
Valdez, A., Oktaba, H., Gomez, H., and Vizcaino, A.
(2020). Sentiment analysis in jira software reposito-
ries. Proceedings - 2020 8th Edition of the Interna-
tional Conference in Software Engineering Research
and Innovation, CONISOFT 2020, pages 254–259.
Wieringa, R. J. (2014). Design science methodology
for information systems and software engineering.
Springer.
Zach, A. (2023). Statology.
https://www.statology.org/internal-consistency/.
Accessed on 01.01.2023.
CSEDU 2024 - 16th International Conference on Computer Supported Education
62
