
How Is Starlink Manoeuvring? An Analysis of Patterns in the
Manoeuvres of Starlink Satellites
David P. Shorten
1
, Wathsala Karunarathne
1,2
and Matthew Roughan
1,2
1
Department of Computer and Mathematical Sciences, The University of Adelaide, Australia
2
Teletraffic Research Centre, The University of Adelaide, Australia
Keywords:
Starlink, Two-Line-Element, Satellite, Manoeuvre, Space Debris, Space Situational Awareness, Particle Filter.
Abstract:
The rapid increase in the number of active satellites orbiting earth along with the simultaneous increase in
the amount of space debris is causing earth’s exosphere to become ever more crowded. This crowding forces
satellites to perform a rising number of collision-avoidance manoeuvres. At the time of publication, of the
roughly 7700 active satellites orbiting earth, over 5000 belonged to the Starlink constellation. These satellites
not only substantially contribute to the crowding of space, but are required to perform tens of thousands of
collision-avoidance manoeuvres per year. As Starlink does not publish information on the timing of these
manoeuvres, little is known about them beyond their total number. This work uses a recently-proposed algo-
rithm for detecting satellite manoeuvres from the publicly-available 18
th
Space Defence Squadron TLE data
to study the patterns in the manoeuvres of this constellation. Rich structure was found in the patterns of these
manoeuvres, including regular synchronous bursts of station-keeping manouevres within launch groups (the
groups of satellites launched on a single day) and a cyclical pattern of station keeping amoung the launch
groups.
1 INTRODUCTION
Starlink is a constellation of over 5,000 satellites that
provides high-speed internet access to users with an
appropriate antenna (Michel et al., 2022). It has the
unique advantage of being able to provide this service
to users at sea or in remote regions.
The number of satellites orbiting the earth is in-
creasing at a rapid rate. As of 1 January 2023, the list
of satellites maintained by the Union of Concerned
Scientists (Union of Concerned Scientists, 2023b),
contained 6,718 operational satellites, an increase of
nearly 2,000 satellites over the previous year (Union
of Concerned Scientists, 2023a). This rate of increase
is likely to accelerate. Starlink alone, which currently
operates over 5000 satellites, has filed for permis-
sion to launch an additional 30,000 satellites with the
Federal Communication Commission (FCC) (Boley
and Byers, 2021). Other companies, including Ama-
zon, OneWeb, Telesat and GW have announced sim-
ilar plans (Boley and Byers, 2021). A total of over
100,000 satellites in orbit by 2030 is considered plau-
sible (Venkatesan et al., 2020). This situation is fur-
ther exacerbated by the large amount of space de-
bris in orbit, which includes over 22,000 tracked ob-
jects (Pelton, 2015). The crowding of space increases
the need for satellite operators to be aware of space
traffic and take evasive manoeuvres when collisions
are predicted. Techniques for monitoring the orbits
and activities of satellites fall under the field of Space
Situational Awareness (SSA) (Lal et al., 2018).
SpaceX (the operators of Starlink) are already re-
quired to perform a large number of evasive manoeu-
vres. According to filings with the FCC (Goldman,
2023), between the 1
st
of December 2022 and the 31
st
of May 2023, Starlink satellites performed 25,299
propulsive manoeuvres. This equates to an average
of around 12 manoeuvres per satellite per year. Given
that the Starlink constellation currently forms the ma-
jority of satellites in orbit, an analysis of the patterns
of these manoeuvres will provide insight into the fu-
ture of space traffic management.
Although Starlink is comparatively generous in
their sharing of data (Goldman, 2023), they do not
publish the timestamps of satellite manoeuvres. How-
ever, the 18
th
Space Defence Squadron provides daily
updates on the orbits of all starlink satellites via
Space-Track (Space-Track, 2023). This paper utilises
a recently-proposed algorithm (Shorten et al., 2023a)
for satellite orbit anomaly detection from this public
174
Shorten, D., Karunarathne, W. and Roughan, M.
How Is Starlink Manoeuvring? An Analysis of Patterns in the Manoeuvres of Starlink Satellites.
DOI: 10.5220/0012619900003705
Paper published under CC license (CC BY-NC-ND 4.0)
In Proceedings of the 9th International Conference on Internet of Things, Big Data and Security (IoTBDS 2024), pages 174-184
ISBN: 978-989-758-699-6; ISSN: 2184-4976
Proceedings Copyright © 2024 by SCITEPRESS – Science and Technology Publications, Lda.

data in order to infer the timestamps of these manoeu-
vres. This approach has been thoroughly validated on
a benchmark dataset (Shorten et al., 2023b) contain-
ing ground-truth manoeuvre timestamps.
We apply this anomaly detection algorithm to the
historic publicly-available data of all Starlink satel-
lites active on the 27
th
of November 2023. We find
that the pattern of manoeuvres within the Starlink
constellation exhibits rich structure. Section 3.2 ex-
plores some of the global properties of this struc-
ture, including the high rate of manoeuvres of satel-
lites post launch. The pattern of manoeuvres across
the constellation is strongly associated with the con-
stellation’s structure. The Starlink constellation is
formed of seven orbital shells, where all satellites
within each shell share a common orbital altitude and
inclination (see table 3 for a list). These shells can
be further divided into their launch groups, consist-
ing of the satellites launched on a single day. Sec-
tion 3.3 examines the manoeuvres of a representa-
tive launch group, finding regularly-spaced stereo-
typed bursts of station-keeping manoeuvring where
all the satellites within the launch group manoeu-
vre near-simultaneously. Moreover, the relative order
of manoeuvring within these groups is mostly main-
tained over time. Section 3.4 subsequently shows
how these patterns degrade over time in older satel-
lites. This analysis is extended to the relationship in
station-keeping manoeuvring between launch groups
in section 3.5, where it is shown that SpaceX performs
station-keeping manoeuvres on the satellites in a shell
in a cyclical fashion, iteratively moving through its
launch groups. Finally, section 3.6 presents an anal-
ysis of the rate of collision-avoidance manoeuvres
across the constellation.
2 METHODS
A list of the SATCAT numbers (Kelso, 1998) of the
5044 Starlink satellites active on the 27
th
of Novem-
ber 2023 was obtained from N2YO (N2YO, 2023).
The TLE data for all of these satellites was then down-
loaded from Space-Track (Space-Track, 2023). ta-
ble 1 contains a summary of the data used in this
work. TLE data consists of the mean Keplerian orbital
elements of satellites, along with metadata such as a
ballistic drag coefficient, recorded roughly daily (Val-
lado and Cefola, 2012). The timestamp associated
with each record is usually referred to as the epoch.
The orbital elements are ‘mean’ in the sense that they
exclude high-frequency non-Keplerian components.
That is, they specify the elliptical orbit which most
closely approximates the true (non-elliptical) orbit of
Table 1: Summary statistics of Starlink satellite data.
Feature Value
Number of Starlink satellites anal-
ysed
4,998
Total number of TLE data points 7,363,925
Total number of detected manoeu-
vres
129,860
Median number of manoeuvres per
satellite
17
First launch date included 11/11/2019
Last launch date included 29/10/2023
Table 2: Parameters for optimal proposal filter.
See (Shorten et al., 2023a) for an explanation of each
parameter.
Parameter Description Value
N Number of particles 250
α Variance inflation
factor
3
τ
r
Threshold on
N
effective
for reg-
ularisation
0.2
τ
shift
Threshold on neg-
ative log predictive
density for ensemble
shift
20
τ
anom
Threshold on neg-
ative log predictive
density for anomaly
detection
100
the satellite.
The 46 satellites from the two most recent
launches (on the 22
nd
and 27
th
of November 2023
(SpaceX, 2023)) were discarded as there was insuf-
ficient data for the operation of the anomaly detection
algorithm.
A recently-proposed (Shorten et al., 2023a) satel-
lite orbit anomaly detection algorithm was then ap-
plied to the TLE data of the remaining 4998 satel-
lites. This approach operates by applying an optimal-
proposal particle filter (Snyder, 2011) to the mean Ke-
plerian orbital elements present in the TLE data. The
idea of filtering, in this context, is to assume that the
mean elements present in each TLE line pair are noisy
How Is Starlink Manoeuvring? An Analysis of Patterns in the Manoeuvres of Starlink Satellites
175

measurements of the true underlying values of these
elements. Filtering then seeks to infer the true val-
ues of these elements at each epoch, along with an
uncertainty. Particle filters are well-suited to the non-
linear nature of satellite orbit evolution and allow us
to compute a non-Gaussian uncertainty. The filtering
setup makes use of the SGP4 (Vallado et al., 2006)
model for orbit evolution. However, it only makes
use of the initial part of this model which propagates
the mean Keplerian elements before incorporating the
high-frequency non-Keplerian components. More-
over, a non-standard implementation of SGP4 is used.
Standard implementations first convert the mean mo-
tion from the Kozai to the Brouwer formulations be-
fore propagation (Vallado et al., 2006). Instead, we
perform this as an initial pre-processing step, and per-
form no such conversions during propagation.
Once the filter has arrived at an estimate (with un-
certainty) for the mean elements at a given epoch, the
estimated mean elements and associated uncertainty
can be propagated to the subsequent epoch. They can
then be compared with the observed mean elements
(in the TLE) at the subsequent epoch. If the observed
elements are deemed sufficiently unlikely given our
propagation and uncertainty, then the epoch is desig-
nated as anomalous. More specifically, we compute
the negative logarithm of the predictive density of the
observation at the subsequent epoch. This figure is
taken to be our anomaly statistic. After a threshold is
chosen, epochs with an anomaly statistic greater than
this threshold are designated as anomalous. We ex-
pect that the majority of detected anomalies will be
the result of manoeuvres, although they could also be
the result of changes in the processing of TLEs by the
18
th
Space Defence Squadron, among other reasons
(see section 4 for further discussion).
Table 2 contains the specification of all parameters
used for filtering. τ
anom
(the threshold for anomaly de-
tection) was hand-tuned to produce roughly the same
rate of anomalies as manoeuvres reported by SpaceX.
All other parameters are the same as those used in
(Shorten et al., 2023a), apart from the number of par-
ticles N. This was halved for reasons of computa-
tional feasibility, given the large number of satellites
in the constellation.
This filtering approach was evaluated (Shorten
et al., 2023a) on a benchmark dataset con-
taining the TLEs of 15 satellites along with
independently-obtained ground-truth manoeuvre
timestamps (Shorten et al., 2023b) as well as sim-
ulated data. It was demonstrated to be superior to
a baseline approach, similar to many previously-
proposed approaches for manoeuvre detection from
TLE data (Li et al., 2018; Li et al., 2019; Decoto
and Loerch, 2015; Mukundan and Wang, 2021; Zhao
et al., 2014).
3 RESULTS
3.1 Stucture of the Starlink
Constellation
Much of the following presentation of the results will
concern how the timing of manoeuvres is related to
the structure of the constellation. As such, we begin
with a brief description of this structure.
The Starlink constellation consists of seven orbital
shells (see table 3 for a list). The orbits of all satel-
lites in each shell share the same altitude and inclina-
tion. The satellites in each shell can be sub-divided
into launch groups. These are the 15 to 60 satellites
contained in the payload of a single SpaceX rocket
launch (Boley et al., 2022; Wikipedia, 2023; Mc-
Dowell, 2020). All satellites in a given launch group
are deployed to the same shell. However, in larger
launches, they are split into different sub-groups con-
sisting of around 20 satellites which are deployed to
different planes, distinguished by their longitude of
the ascending node (Cakaj, 2021; McDowell, 2020).
The orbital shells can themselves be grouped into
two constellation generations. The first generation
consists of the satellites in the orbits licenced by the
FCC on the 28
th
of March 2018. These are the satel-
lites in shells 1, 2, 3, 4, and 6. The second generation
consists of the satellites in orbits licenced by the FCC
on the 1
st
of December 2022, namely, the satellites in
shells 5 and 7 (Federal Communications Commission,
2022; Wikipedia, 2023; McDowell, 2023).
Preliminary analysis indicated that the manoeu-
vres of the satellites in a given launch group tended
to occur close together in time. Much of our analysis,
therefore, is performed by grouping the satellites into
their launch groups. These groups were determined
by using the launch dates included in the list of Star-
link satellites obtained from N2YO (N2YO, 2023).
3.2 Global Patterns in Manoeuvre
Frequency
We first analyse global patterns across the entire con-
stellation of satellites. In order to make this analy-
sis feasible, we investigate the rate of manoeuvres de-
tected within each launch group of satellites. figure 1
plots a heatmap showing the rate of detected manoeu-
vres (in manoeuvres per satellite per day) within each
launch group.
IoTBDS 2024 - 9th International Conference on Internet of Things, Big Data and Security
176
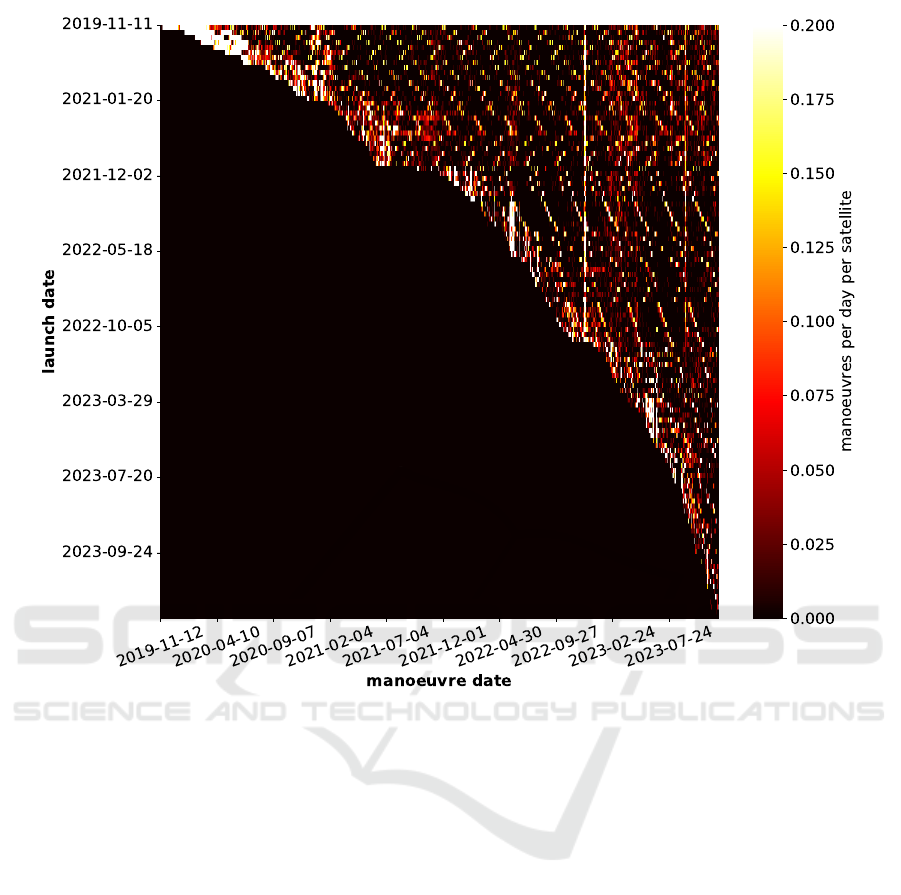
Figure 1: The rate of manoeuvres for the different Starlink satellite launch groups. The rate is estimated using a Gaussian
kernel with σ = 0.5 days. Note that although the y axis is ordered by the launch dates, these are not equally spaced, and so it
does not have a consistent scale. The rate of manoeuvres is particularly high shortly after the launch of each satellite group.
There are also pronounced spikes in manoeuvre activity around December 2022 and August 2023.
This plot shows that there is a high incidence of
detected manoeuvres near the beginning of each satel-
lite’s time in orbit. After launch, Starlink satellites
perform extensive manoeuvring in order to reach their
final orbit (Ashurov, 2022). However, in the authors’
experience, TLEs often contain artifacts in the earli-
est published epochs. It is, therefore, possible that
the large number of detected anomalies shortly after
launch is partially due to such artifacts.
The top right of the plot shows a marked increase
in the number of detected manoeuvres for older satel-
lites. This could be being driven by deorbiting ma-
noeuvres or be due to increased incidence of malfunc-
tion in these older satellties. There are also two sharp
increases in the number of detected manoeuvres that
affect most satellites in the constellation. The first,
more pronounced, spike occurs on around the 10
th
of
December 2022 and the second on around the 2
nd
of
September 2023. These spikes could be due to the
simultaneous manoeuvring of all or most satellites in
the constellation. However, the authors have encoun-
tered instances where the TLE data of multiple unre-
lated satellites undergo a simultaneous change, likely
due to changes in how they are processed by the 18
th
Space Defence Squadron. These spikes could be the
result of such an artifact. If they are not the result
of an artifact, then it is plausible that the spike on
around the 10
th
of December 2022 is the result of
an adjustment to the constellation in preparation for
the first launch of the 2
nd
generation shell of Starlink
satellites, which occurred on the 28
th
of December
2022 (Wikipedia, 2023). See section 3.1 for a descrip-
tion of the two generations of the constellation.
figure 1 also contains multiple lines of higher ma-
noeuvre intensity, at an angle from top left to bottom
right. These are likely the result of SpaceX perform-
ing sequential station-keeping or maintenance ma-
noeuvres across multiple launch groups. This is fur-
ther investigate in section 3.5.
How Is Starlink Manoeuvring? An Analysis of Patterns in the Manoeuvres of Starlink Satellites
177
(a) Individual manoeuvres and manoeuvre intensity.
(b) Fourier power spectrum of manoeuvre intensity.
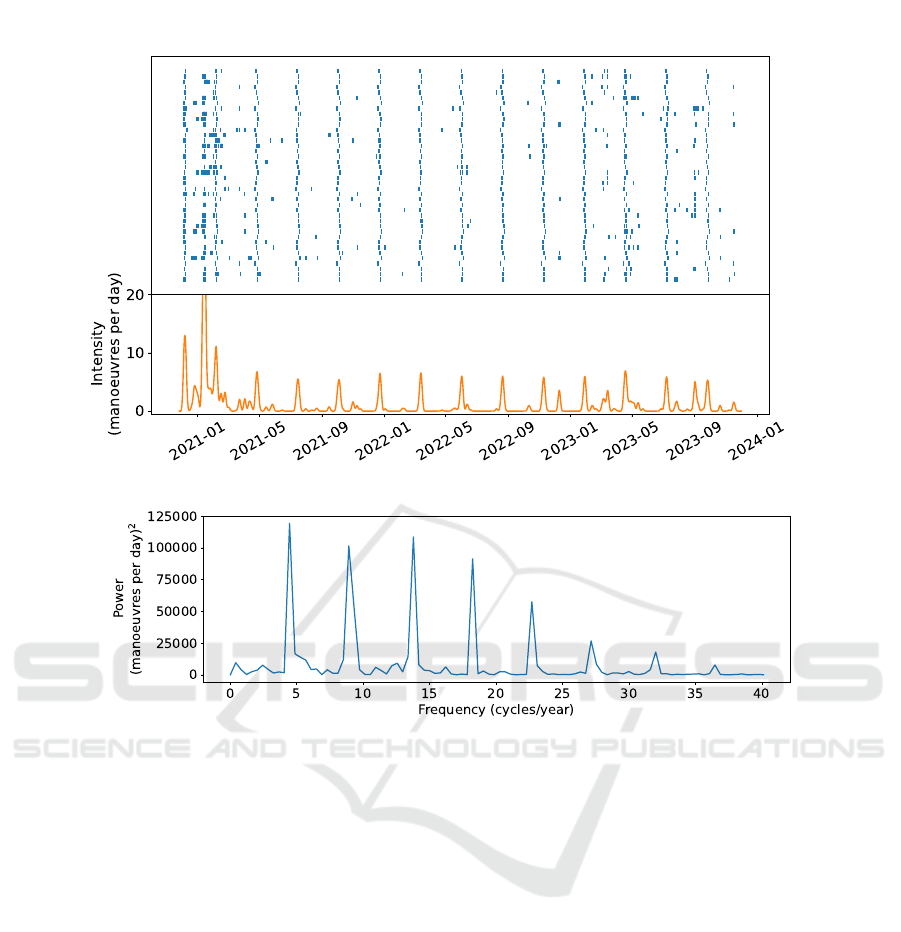
Figure 2: A detailed analysis of the manoeuvres of satellite launch group fifteen of shell one. The upper panel of (a) shows
the individual inferred manoeuvres for each satellite in the group. Each blue line is the timestamp of a detected manoeuvre
and each row contains the manoeuvres of a single satellite in the group. The satellites are ordered by their SATCAT num-
bers (Kelso, 1998), from top to bottom along the y axis. The lower panel shows an estimate of the intensity of manoeuvre
activity, estimated using a Gaussian kernel with a bandwidth of 2 days. (b) shows the Fourier power spectrum of the manoeu-
vre intensity. The fundamental frequency is at around 4.5 manoeuvres per year, representing an interval of around 80 days
between station-keeping manoeuvres.
3.3 Regular Station-Keeping
Manoeuvring
We now zoom in on a particular launch in order to get
a more precise idea of the exact timing of manoeu-
vres. By selecting a single, representative, launch
group we can inspect precise manoeuvre times, as op-
posed to only examining rates of manoeuvre detec-
tions.
The upper panel of figure 2a plots the precise
times of detected manoeuvres for each individual
satellite in the 15th launch group of shell one. These
satellites were launched on the 25
th
of November
2020. After an initial flurry of manoeuvres post
launch, regularly-spaced near-synchronous manoeu-
vring begins — at regular intervals nearly every satel-
lite manoeuvres within a brief one to two day pe-
riod. Each such burst of manoeuvring is separated by
a gap of over 2 months. This regular pattern within
the launch group is highly indicative of the detected
anomalies being caused by manoeuvres as opposed
to artifacts in the TLE data. Moreover, their regu-
larity and synchronicity is indicative of them being
station-keeping manoeuvres. The orbits of satellites
in low earth orbit, such as the Starlink constellation,
degrade over time due to atmostpheric drag, solar ra-
diation pressure and the non-spherical nature of the
earth (Vallado, 2001). Regular station-keeping ma-
noeuvres are required to maintain the satellites in a
roughly constant orbit.
To highlight the periodic nature of these station-
keeping manoeuvres, the lower panel of figure 2a
IoTBDS 2024 - 9th International Conference on Internet of Things, Big Data and Security
178
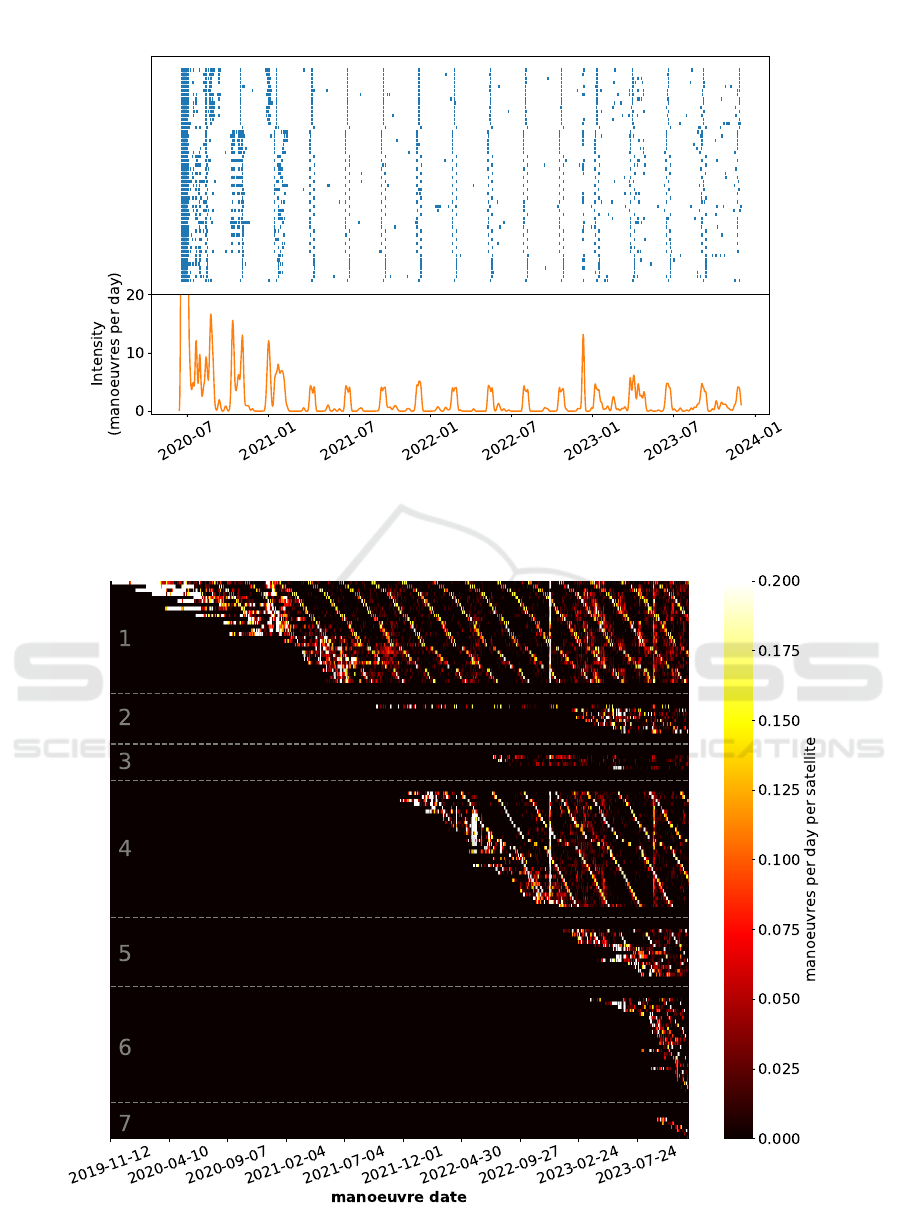
Figure 3: The same plot as in figure 2a, but showing the inferred manoeuvres of launch group eight of shell one. In this older
launch group, the stereotyped nature of the station-keeping manoeuvres degrades over time. During the course of 2023, the
relative timing of the manoeuvres of the satellites in this group becomes less consistent and some satellites cease manoeuvring
during the station-keeping period.
Figure 4: The same plot as figure 1, however, the satellites are reordered along the y axis so that they are grouped into their
orbital shells. These shells are separated by the grey dashed lines and their number is given in grey text. The launch groups
within each shell have also been reordered so as to emphasize the sequential nature of the regular station-keeping manoeuvres.
How Is Starlink Manoeuvring? An Analysis of Patterns in the Manoeuvres of Starlink Satellites
179

Table 3: Various summary statistics and features of the orbital shells. The last column lists the order in which the launch
groups of each shell are plotted in figure 4. The numbers in this ordering correspond to the order that the satellites were
launched in. The assignment of launch groups to shells is made according to (McDowell, 2023).
Orbit Number of First Last Altitude Median number Order of launch
shell active launch launch date (km) of manoeuvres groups in
number satellites date included per satellite figure 4
1 1445 11/11/2019 26/5/2021 550 36 1, 3, 2, 4, 7, 6, 9,
5, 12, 8, 13, 10, 15, 14,
11, 18, 16, 19, 23, 17, 20,
21, 22, 25, 24, 28, 26, 27
2 403 14/9/2021 31/5/2023 570 10 1, 4, 5, 6, 7, 8, 9, 10
3 233 11/7/2022 27/4/2023 560 8 1, 2, 3, 5
4 1566 13/11/2021 17/12/2022 540 17 3, 5, 1, 4, 7, 6, 8, 11, 9, 10,
12, 14, 13, 16, 15, 19, 17,
27, 21, 26, 18, 22, 25, 29,
23, 20, 2, 34, 35, 36, 31, 37
5 692 28/12/2022 6/7/2023 530 7 1, 2, 3, 4, 5, 6, 7, 9,
10, 11, 12, 13, 15
6 539 27/2/2023 8/11/2023 559 3 1, 2, 3, 4, 5, 6, 7, 8,
9, 10, 11, 12, 13, 14, 15,
16, 17, 18, 19, 20, 21, 22,
23, 24, 25, 26, 27
7 127 22/8/2023 29/10/2023 525 2 1, 2, 3, 4, 5, 6
plots an estimate of the intensity of manoeuvring in
this satellite group. This estimate was performed us-
ing a Gaussian kernel with a bandwidth of 2 days.
Outside of the increase in manoeuvre activity shortly
post launch, the majority of spikes in this intensity
correspond to the regularly-spaced bursts in manoeu-
vres, likely due to station-keeping activity.
figure 2b plots the Fourier power spectrum of the
manoeuvre intensity plotted in the lower panel of fig-
ure 2a. The fundamental frequency occurs at around
4.5 cycles per year. This corresponds to a period of
around 80 days between station-keeping manoeuvres.
Both shells one and four had well-defined station-
keeping bursts over significant periods of time (see
figure 4). All inspected launch groups in these two
shells had a similar fundamental frequency and cor-
responding interval between station-keeping manoeu-
vres.
Manoeuvres are also detected outside of the
station-keeping bursts, likely the result of collision-
avoidance manoeuvring (Uriot et al., 2022).
3.4 Degradation of Station-Keeping
Manoeuvres
We investigate the long-term stability of the station-
keeping manoeuvre patterns by plotting the manoeu-
vre times of the eighth launch group of shell one in
figure 3. These satellites were launched on the 13
th
of June 2020 and their behaviour is representative of
satellites launched both at a similar time and earlier.
In the earlier parts of these satellites’ lifespans,
they exhibited a highly-stereotyped pattern of regu-
lar manoeuvre bursts. Moreover, the relative ordering
of the satellites within each manoeuvre burst was con-
sistent across time.
However, this stereotyped pattern begins to break
down, particularly after around February 2023. Each
burst of manoeuvres occurs over a broader time in-
terval and the relative time ordering of the satellites
is less consistent. Moreover, in the last burst of ma-
noeuvres, no manoeuvres were detected for a number
of satellites.
This degradation is likely due to this launch group
approaching the end of its lifespan.
IoTBDS 2024 - 9th International Conference on Internet of Things, Big Data and Security
180
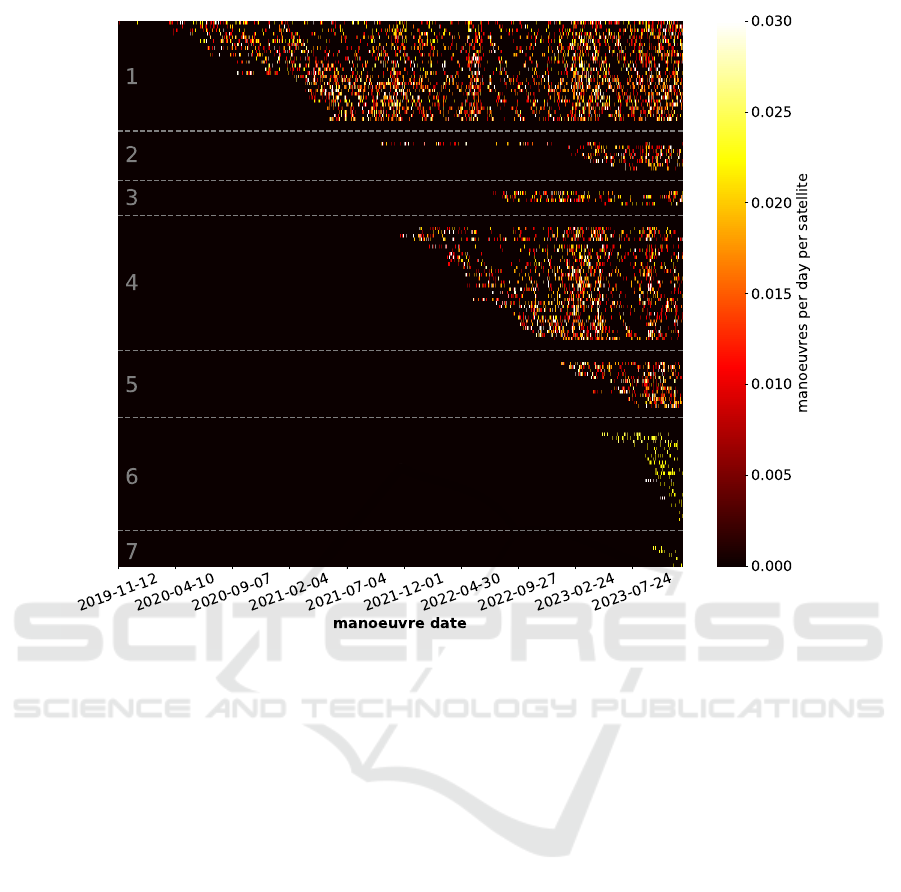
Figure 5: The same plot as figure 1, however, the station keeping and initial positioning manoeuvres have been removed. This
was achieved by removing all manoeuvres where the launch group’s manoeuvre intensity was greater than 0.04 manoeuvres
per satellite per day. The manoeuvre intensity was subsequently re-estimated after these periods of high intensity were
removed. Note that the colours are rescaled from previous figures due to the lower rate of manoeuvres. The majority of
remaining manoeuvres should reflect collision-avoidance actions. There are distinct periods of higher or lower incidence of
these manoeuvres. For instance, there is a noticeable increase in collision-avoidance manoeuvres in early 2022 for shell one
followed by a period of lower activity for the remainder of this year.
3.5 Ordering of Station-Keeping
Manoeuvres
After establishing that the satellite groups per-
form periodic group-wide station-keeping manoeu-
vres, our subsequent analysis concerns the coordina-
tion of these station-keeping manoeuvres between the
groups. There is a number of ways that SpaceX could
coordinate these manoeuvres. For instance, all the
satellites in a given shell could manoeuvre simultane-
ously, or certain supergroups of launch groups could
manoeuvre together.
As shown in figure 4, it appears that SpaceX cy-
cles through each launch group within each orbital
shell, performing station-keeping manoeuvres in a se-
quential fashion. This figure plots the manoeuvre in-
tensity of each launch group, similar to figure 1. How-
ever, the launch groups have been reordered so that
they are grouped into their orbital shells. Moreover,
within shells one and four, the launch groups have
been ordered so as to emphasize the sequential nature
of the station-keeping manoeuvres, although this was
also done so as to maintain the launch order as far as
possible. This reordering was not done for the other
shells as there were either too few launch groups, or
most launch groups had not been active long enough
to make such an ordering sensible. Note that, as mul-
tiple launch groups within each shell do manoeuvre
simultaneously, this ordering is not unique — other
orderings of the launch groups will yield a similar pat-
tern to that shown in figure 1.
Within shells one and four, at most three launch
groups are undergoing station-keeping manoeuvring
at any one point in time. The launch groups are cy-
cled through in an iterative fashion so that all satellites
within the shell undergo station-keeping manoeuvres
within the roughly 80 day period discussed in sec-
tion 3.3.
How Is Starlink Manoeuvring? An Analysis of Patterns in the Manoeuvres of Starlink Satellites
181

This behaviour makes sense within the context of
the management of the constellation. Presumably,
manoeuvring might interrupt the transmission of the
satellites and SpaceX would therefore want as even
a distribution of manoeuvring activity across time as
possible.
3.6 Trends in Collision Avoidance
Manoeuvres
The analysis performed so far has focussed on the
constellation’s station-keeping activity. However, we
know from SpaceX’s own filings with the FCC (Gold-
man, 2023) that the satellites in the Starlink con-
stellation perform a substantial number of collision-
avoidance manoeuvres.
We analysed trends in the rate of these manoeu-
vres over time by removing all station-keeping ma-
noeuvres, before re-analysing the intensity of ma-
noeuvring within each launch group. This was done
by first estimating the intensity of manoeuvres within
each launch group using a Gaussian kernel with a
bandwidth of two days. All manoeuvres that occurred
within periods with an estimated intensity above 0.04
manoeuvres per satellite per day were removed. This
threshold was chosen through hand-tuning, with the
goal being to find the highest threshold for which the
pattern of periodic station-keeping manoeuvring dis-
appeared. Note that this process also removes the
intense manoeuvre activity that occurs shortly after
launch.
After the station-keeping manoeuvres were re-
moved, the manoeuvre rate of each satellite was re-
estimated. The resulting manoeuvre rates are plot-
ted in figure 5. This figure reveals that the rate of
incidence of collision-avoidance manoeuvres is vari-
able across time. For instance, orbital shell one has a
particularly elevated rate of these manoeuvres around
April 2022 and February 2023. However, this rate is
substantially lower between May 2022 and January
2023. Similar to shell one, shell four has a raised rate
of manoeuvres in February 2023, but this is followed
by a period of particularly sparse manoeuvring in the
middle of 2023.
4 DISCUSSION
We applied a recently-developed anomaly detection
algorithm for TLE data (Shorten et al., 2023a), to the
TLE data of all currently-active Starlink satellites.
A question of primary concern is whether these
detected anomalies correspond to the manoeuvres of
the Starlink satellites. These anomalies could be
caused by a number of other potential factors, such as
artifacts in the TLE data or satellite malfunction. The
paper proposing the deployed filtering technique for
anomaly detection (Shorten et al., 2023a) performed
a thorough evaluation of its accuracy. This was per-
formed on a benchmark dataset (Shorten et al., 2023b)
which contained the TLEs of 15 satellites and associ-
ated independently-obtained ground-truth manoeuvre
timestamps. This dataset contained a mixture of satel-
lites in geosynchronous and low-earth orbits, which
is where the Starlink constellation is situated. It was
demonstrated that this approach was able to achieve
fairly high performance on most satellites, achieving
F1 scores over 0.8 in many cases. However, these
scores are not perfect. Moreover, no validation of this
approach has been performed on Starlink satellites,
which make use of electric propulsion (Holste et al.,
2020) compared with the chemical propulsion of the
satellites in the benchmark dataset. It is therefore al-
most certain that some of the anomalies detected in
the Starlink TLE data are false positives. It is also
highly likely that some manoeuvres went undetected.
That being said, there are features of the pat-
terns of detected anomalies which should increase
our confidence in the results. As discussed in sec-
tion 3.3, there are regular bursts of manoeuvres where
an anomaly is detected for all satellites in one launch
group within a narrow period (around a day). More-
over, as shown in figure 4, different satellite groups
rarely exhibit such bursts of anomalies simultane-
ously. This behaviour is easy to explain if the detected
anomalies are station-keeping manoeuvres being per-
formed across all satellites on the same or similar or-
bital plane. However, it is difficult to see why arti-
facts in TLEs would line up so precisely based on the
satellite’s launch date or orbital plane. The consis-
tent relative timing of the manoeuvres of each satellite
in a launch group during the station-keeping manoeu-
vres, as discussed in section 3.3, is similarly better
explained by patterns in how SpaceX is choosing to
manoeuvre its satellites than by patterns in the distri-
bution of artifacts in TLE data.
The Starlink constellation exhibits a rich pattern
of detected manoeuvres across time and the different
satellite launch groups. figure 1 provides a global
summary of the detected manoeuvres by plotting a
heatmap of the rate of detected manoeuvres within
each satellite group. The rate of manoeuvres was
generally higher shortly after launch and in the lat-
ter parts of older satellites’ lifespans. There are also
some noticeable spikes in manoeuvring activity, such
as around the 10
th
of December 2022.
More detailed analysis of the precise manoeuvre
times of individual satellites reveals further structure.
IoTBDS 2024 - 9th International Conference on Internet of Things, Big Data and Security
182

figure 2 plots the precise manoeuvre times for all
satellites in a representative launch group. The group
undergoes regularly-spaced bursts in manoeuvring ac-
tivity, where all satellites in the group manoeuvre
near-simultaneously. Moreover, the relative ordering
of the manoeuvres within the bursts remains consis-
tent over time. The frequency of these bursts in both
the representative launch group as well as in other
launch groups studied was around 4.5 bursts per year,
giving a corresponding period of around 80 days be-
tween bursts. These bursts are likely the result of reg-
ular station-keeping manoeuvres being performed by
SpaceX. Anomalies unique to individual satellites are
also detected outside of these bursts. It is likely that a
significant proportion of such anomalies are the result
of collision-avoidance manoeuvres by SpaceX.
The regularity of the station-keeping manoeuvres
was shown to break down over time in certain satel-
lites. figure 3 plots the precise manoeuvre times of an
early launch group. In the earlier parts of their lifes-
pan, the satellites exhibit a highly stereotyped pattern
of manoeuvres, with the relative ordering of the satel-
lites within each burst remaining highly consistent.
This consistency breaks down close to the present day.
Moreover, some satellites no longer manoeuvre in the
bursts.
Section 3.5 studied the relationship in the tim-
ing of the station-keeping manoeuvre bursts between
the launch groups of each shell. The launch groups
rarely performed their station-keeping manoeuvres si-
multaneously. Instead, it appears that SpaceX moves
through the different launch groups in an iterative
fashion so as to minimize the number of satellites ma-
noeuvring simultaneously.
Finally, 3.6 studied the incidence of collision
avoidance manoeuvres in the constellation by remov-
ing the station-keeping manoeuvres from the anal-
ysis and examining the remaining manoeuvres. It
was found that the different shells of the constellation
go through distinct periods of increased or decreased
collision-avoidance manoeuvring activity.
5 CONCLUSION
Due to the anticipated rapid increase in their size,
large satellite constellations such as Starlink will in-
crease the difficulty of space traffic management.
However, little is currenlty known about how SpaceX
manages this constellation and, in particular, how it
manoeuvres the satellites within it. This work ad-
dressed this lack of insight by applying a recently-
developed anomaly detection algorithm to the TLE
data of all satellites currently active in the Starlink
constellation. It was found that satellites undergo
an initial period of rapid manoeuvring before settling
into a state dominated by regular bursts in the ma-
noeuvring of all satellites within a particular launch
group to perform station keeping. These bursts are in-
terspersed with isolated collision-avoidance manoeu-
vres. This pattern of regular bursting degrades over
time in the earliest launches.
ACKNOWLEDGEMENT
We thank Will Heyne of BAE Systems for help-
ful insights throughout the course of this research.
This work has been supported by the SmartSat CRC,
whose activities are funded by the Australian Govern-
ment’s CRC Program.
REFERENCES
Ashurov, A. E. (2022). An effective method for detecting
satellite orbital maneuvers and its application to LEO
satellites. Advances in Aircraft and Spacecraft Sci-
ence, 9(4):279.
Boley, A. C. and Byers, M. (2021). Satellite mega-
constellations create risks in low earth orbit, the atmo-
sphere and on earth. Scientific Reports, 11(1):10642.
Boley, A. C., Wright, E., Lawler, S., Hickson, P., and
Balam, D. (2022). Plaskett 1.8 m observations of Star-
link satellites. The Astronomical Journal, 163(5):199.
Cakaj, S. (2021). The parameters comparison of the Star-
link LEO satellites constellation for different orbital
shells. Frontiers in Communications and Networks,
2:643095.
Decoto, J. and Loerch, P. (2015). Technique for GEO RSO
station keeping characterization and maneuver detec-
tion. In Advanced Maui Optical and Space Surveil-
lance Technologies Conference, page 42.
Federal Communications Commission (2022). FCC 22-91.
Goldman, D. (2023). SpaceX constellation status report,
December 1, 2022 to May 31, 2023. Technical report,
Space Exploration Technologies Corp.
Holste, K., Dietz, P., Scharmann, S., Keil, K., Henning,
T., Zsch
¨
atzsch, D., Reitemeyer, M., Nausch
¨
utt, B.,
Kiefer, F., Kunze, F., et al. (2020). Ion thrusters
for electric propulsion: Scientific issues developing a
niche technology into a game changer. Review of Sci-
entific Instruments, 91(6).
Kelso, T. (1998). Frequently asked questions: Two-line el-
ement set format. celestrak.org/columns/v04n03/.
Accessed: 2022-10-26.
Lal, B., Balakrishnan, A., Caldwell, B. M., Buenconsejo,
R. S., and Carioscia, S. A. (2018). Global trends in
Space Situational Awareness (SSA) and Space Traffic
Management (STM). Science and Technology Policy
Institute, 10.
How Is Starlink Manoeuvring? An Analysis of Patterns in the Manoeuvres of Starlink Satellites
183

Li, T., Li, K., and Chen, L. (2018). New manoeuvre detec-
tion method based on historical orbital data for low
earth orbit satellites. Advances in Space Research,
62(3):554–567.
Li, T., Li, K., and Chen, L. (2019). Maneuver detection
method based on probability distribution fitting of the
prediction error. Journal of Spacecraft and Rockets,
56(4):1114–1120.
McDowell, J. (2020). The low earth orbit satellite popula-
tion and impacts of the SpaceX Starlink constellation.
The Astrophysical Journal Letters, 892(2):L36.
McDowell, J. (2023). Jonathan’s space pages - Starlink
statistics. planet4589.org/space/con/star/stats.html.
Accessed: 2023-12-10.
Michel, F., Trevisan, M., Giordano, D., and Bonaventure,
O. (2022). A first look at starlink performance. In
Proceedings of the 22nd ACM Internet Measurement
Conference, pages 130–136.
Mukundan, A. and Wang, H.-C. (2021). Simplified ap-
proach to detect satellite maneuvers using TLE data
and simplified perturbation model utilizing orbital el-
ement variation. Applied Sciences, 11(21):10181.
N2YO (2023). Starlink satellites. www.n2yo.com/satellite
s/?c=52. Accessed: 2023-11-30.
Pelton, J. N. (2015). New solutions for the space debris
problem. Springer.
Shorten, D. P., Maclean, J., Humphries, M., Yang, Y., and
Roughan, M. (2023a). Optimal proposal particle fil-
ters for detecting anomalies and manoeuvres from two
line element data. arXiv preprint arXiv:2312.02460.
Shorten, D. P., Yang, Y., Maclean, J., and Roughan, M.
(2023b). Wide-scale monitoring of satellite lifetimes:
Pitfalls and a benchmark dataset. Journal of Space-
craft and Rockets, pages 1–5.
Snyder, C. (2011). Particle filters, the “optimal” proposal
and high-dimensional systems. ECMWF Seminar on
Data assimilation for atmosphere and ocean, page 10.
Space-Track (2023). SPACE-TRACK.ORG. space-track.o
rg. Accessed: 2023-12-05.
SpaceX (2023). Launches. www.spacex.com/launches/.
Accessed: 2023-12-05.
Union of Concerned Scientists (2023a). How many satel-
lites are in space? the spike in numbers continues.
blog.ucsusa.org/syoung/how-many-satellites-are-i
n-space-the-spike-in-numbers-continues/. Accessed:
2023-12-04.
Union of Concerned Scientists (2023b). UCS satellite
database. www.ucsusa.org/resources/satellite-dat
abase. Accessed: 2023-12-04.
Uriot, T., Izzo, D., Sim
˜
oes, L. F., Abay, R., Einecke, N.,
Rebhan, S., Martinez-Heras, J., Letizia, F., Siminski,
J., and Merz, K. (2022). Spacecraft collision avoid-
ance challenge: Design and results of a machine learn-
ing competition. Astrodynamics, 6(2):121–140.
Vallado, D., Crawford, P., Hujsak, R., and Kelso, T. (2006).
Revisiting spacetrack report #3. In AIAA/AAS As-
trodynamics Specialist Conference and Exhibit, page
6753.
Vallado, D. A. (2001). Fundamentals of astrodynamics and
applications, volume 12. Springer Science & Busi-
ness Media.
Vallado, D. A. and Cefola, P. J. (2012). Two-line element
sets - practice and use. In 63rd International Astro-
nautical Congress, Naples, Italy, pages 1–14.
Venkatesan, A., Lowenthal, J., Prem, P., and Vidaurri, M.
(2020). The impact of satellite constellations on space
as an ancestral global commons. Nature Astronomy,
4(11):1043–1048.
Wikipedia (2023). List of Starlink and Starshield Launches.
en.wikipedia.org/wiki/List
of Starlink and Starshiel
d launches. Accessed: 2023-12-10.
Zhao, Y., Zhang, K., Bennett, J., Sang, J., and Wu,
S. (2014). A method for improving two-line ele-
ment outlier detection based on a consistency check.
In Proceedings of the Advanced Maui Optical and
Space Surveilllance (AMOS) Technologies Confer-
ence, Maui, Hawaii.
IoTBDS 2024 - 9th International Conference on Internet of Things, Big Data and Security
184
