
Traffic State Estimation on Urban Roads
Using Perception-Enriched Floating Car Data
Moritz Schweppenh
¨
auser
1 a
, Karl Schrab
2 b
, Robert Protzmann
1 c
and Ilja Radusch
2
1
Fraunhofer Institute FOKUS, Kaiserin Augusta Allee 31, 10589 Berlin, Germany
2
TU Berlin / Daimler Center for Automotive IT Innovations, Ernst-Reuter-Platz 7, 10587 Berlin, Germany
Keywords:
Traffic State Estimation, Simulation, Vehicle Perception, Eclipse MOSAIC.
Abstract:
Modern-day navigation systems by developers like Google© and TomTom© require user participation primar-
ily in the form of Floating Car Data (FCD) for accurate Traffic State Estimation (TSE). However, to provide
reliable information, systems rely on large road user participation of at least 5 %, which is only truly available
to the big players. We propose a method to soften the participation requirement by utilizing modern perception
sensors (e.g., radar, lidar, camera) of connected vehicles (CVs) to enrich the FCD set, compensating reduced
data quantity with increased data quality. By using position and speed estimates of surrounding vehicles we
increase the sample size and can additionally collect estimates of segments that are not traversed by CVs. To
validate and assess the proposed system, we utilize Eclipse MOSAIC and conduct a simulation-based test se-
ries on the calibrated large-scale BeST scenario. Initial findings indicate improved estimation performance on
selected road segments, especially at lower rates of market penetrations. In a network-wide investigation, we
show that travel time estimates of the proposed method are often more accurate than conventional approaches,
while also requiring smaller penetration rates.
1 INTRODUCTION
In a world highly dependent on personal mobility,
traffic congestion is a daily issue, leading to wasted
time, increased emissions, and fuel consumption.
Navigation system developers try to alleviate the traf-
fic strain by providing real-time Traffic State Estima-
tion (TSE) for users, giving them the ability to avoid
traffic build-ups and congested areas. To provide ac-
curate estimations, current-day systems typically rely
on large amounts of data provided by users. This data
is referred to as Floating Car Data (FCD) and is usu-
ally made up of a vehicle’s position, its heading, and
speed. This technology has been established over the
last three decades and nowadays is an essential part of
most navigation applications.
At the same time, automotive sensor technolo-
gies evolved to add richer perception sensors, such
as radar, lidar, and cameras. This trend has been
driven by advanced driver assistance systems and au-
tonomous driving technology, reaching a state where
a
https://orcid.org/0009-0001-9252-2425
b
https://orcid.org/0000-0002-5083-595X
c
https://orcid.org/0000-0002-5531-1936
many new car models are equipped with such sensors.
In related work, Delooz et al.(Delooz et al., 2020)
utilize V2X (vehicle-to-everything) communication
to share the advanced sensor data between vehicles
or servers to enable innovative use cases. This field of
research is mainly driven by safety use cases such as
collective perception.
Inspired by these use cases, we want to investigate
the shared sensor output as an input for traffic effi-
ciency applications. Specifically, we propose a TSE
system that extends FCD packages with information
about surrounding vehicles, including the respective
position, heading, and speed. With this approach, we
aim to further reduce market penetration thresholds of
conventional FCD-based systems, potentially allow-
ing smaller competitors to enter the market.
Similarly, Messelodi et al.(Messelodi et al., 2009)
propose to enrich FCD with data from sensors on the
equipped vehicles. Their approach includes warning
sign recognition as well as a local traffic level esti-
mator, relying on onboard preprocessing. Ruppe et
al.(Ruppe et al., 2012) further propose to augment
FCD with data from surrounding Bluetooth/Wi-Fi en-
abled devices, increasing the amount of collected data
without the use of perception sensors.
Schweppenhäuser, M., Schrab, K., Protzmann, R. and Radusch, I.
Traffic State Estimation on Urban Roads Using Perception-Enriched Floating Car Data.
DOI: 10.5220/0012620500003702
Paper published under CC license (CC BY-NC-ND 4.0)
In Proceedings of the 10th International Conference on Vehicle Technology and Intelligent Transport Systems (VEHITS 2024), pages 99-111
ISBN: 978-989-758-703-0; ISSN: 2184-495X
Proceedings Copyright © 2024 by SCITEPRESS – Science and Technology Publications, Lda.
99
The work presented in this paper is built on pre-
viously published research, which gave an initial re-
view on sensor modalities and aggregation methods
for mean speed estimation(Schweppenh
¨
auser et al.,
2023). We extend the established system and test
the novel solution using the co-simulation framework
Eclipse MOSAIC(Schrab et al., 2023).
This paper is structured into four main sections.
First, in Section 2 we reiterate fundamental require-
ments in terms of TSE relevant to this paper and ex-
plain how one could include potentially lossy data
from surrounding vehicles. Secondly, we explain how
we approach the implementation and deployment of
the system in a simulated environment in Section 3.
Conducted experiments and compiled results are de-
scribed in Section 4. Finally, with Section 5 we lay
out closing remarks and future research directions.
2 MEAN SPEED ESTIMATION
Estimating traffic flows, speeds, and densities has
long been an important topic in traffic research. In
real-world applications, this task quickly becomes
difficult as only limited measurement options exist,
each coming with different coverage, reliability, and
costs. Historically, static observers such as induc-
tion loop sensors and traffic cameras have been de-
ployed on major road arteries to investigate their traf-
fic state with good accuracy. However, these static
installations are costly which inherently limits their
network coverage. Contrarily, the idea of using mo-
bile sensors in the form of connected vehicles (CV),
has been proposed as early as the 1950s(Wardrop
and Charlesworth, 1954) using the “Moving Observer
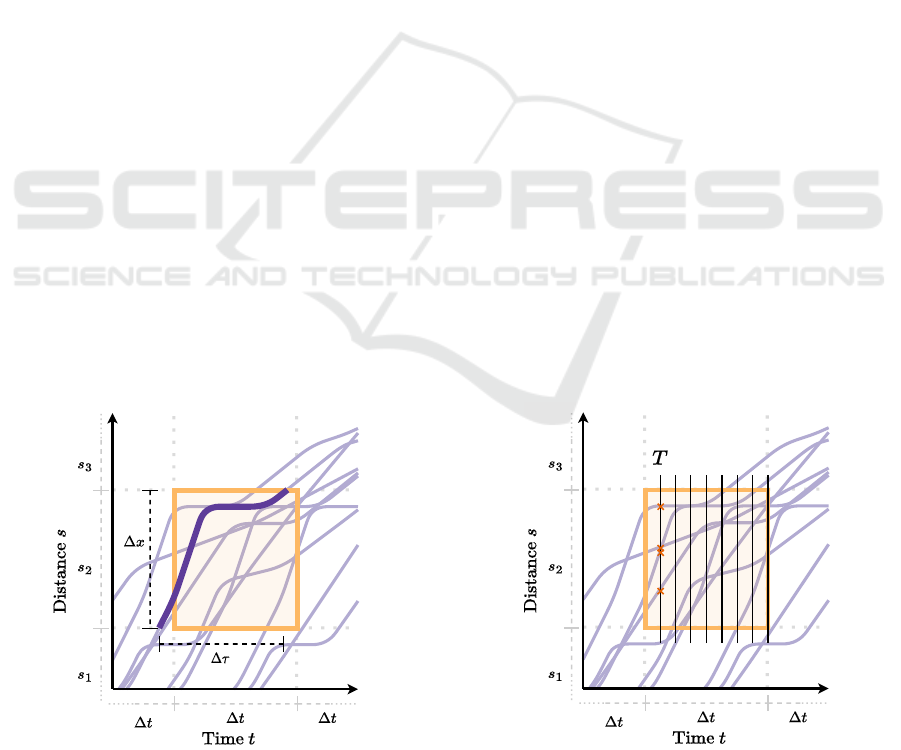
Figure 1: Exemplary space-time diagram in an urban sce-
nario, highlighting large deviations in vehicle trajectories.
The dark purple line indicates the calculation of the tempo-
ral mean speed for the marked spatio-temporal interval.
Method”. This method relies on vehicles being able
to perceive vehicles in the opposing lanes, which is
why it was never widely deployed, as required sensors
were not available in the past. Later on, with the larger
availability of mobile connectivity and the universal
adoption of smartphones, the “Floating Car Observer
Method”, i.e., using Floating Car Data, gained popu-
larity as this enabled the possibility for almost every
end user to act as a mobile sensor.
Navigation application developers such as
Google© and TomTom© rely on FCD for Traffic
State Estimation. However, for aspiring competitors,
the FCD method is hardly applicable as large amounts
of data are required, ranging to 5 % to 10 % market
penetration(Ferman et al., 2005) even for estimations
on highways. On urban roads, this matter is further
complicated due to much higher variability in driver
behavior and a more complex road layout.
Independent of the applied sensor technology, the
task of traffic state estimation describes the recon-
struction of different traffic indexes such as flows,
densities, mean speeds, and other metrics built on
the former based on potentially sparse sensor data.
Blokpoel et al.(Blokpoel et al., 2010) describe an un-
ambiguous list of such traffic metrics used for classi-
fying the traffic state. Building on our previous work
we continue focusing on mean speed estimates, as the
speed is one of the core indexes and can be directly
used in fastest-path routing algorithms.
To better understand the role of speeds in the traf-
fic state so-called Space-Time-Diagrams can help (see
Figure 1). We, conventionally, plot the time on the ab-
scissa and the space on the ordinate. Trajectories of
individual vehicles are displayed as purple lines and
the slope of a trajectory indicates a vehicle’s speed.
Figure 2: Depiction of how the sample-based mean speed is
calculated for a given time interval ∆t, where T indicates the
set of all time steps within ∆t. Each of the orange crosses
indicates a sample recorded at the first time step.
VEHITS 2024 - 10th International Conference on Vehicle Technology and Intelligent Transport Systems
100

Usually, one examines separate spatial and temporal
intervals. Since the traffic state is a highly fluctuat-
ing measure precise estimations can only be made on
a local scale, i.e., for certain time intervals (typically
5 min to 30 min) and on given streets or street seg-
ments. These intervals can be referred to as aggrega-
tion intervals and are indicated by the orange boxes.
Of course, if one has access to complete trajecto-
ries, the estimation of the average speed for a spatio-
temporal interval would be as easy as calculating the
arithmetic mean of all respective average speeds as
shown in Equation (1).
V =
1
n
n
∑
i=0
¯v
i
=
1
n
n
∑
i=0
∆s
i
∆t
i
(1)
In reality, however, one deals with incomplete, po-
tentially erroneous data and has to apply measures
to fill in gaps and correct data. For position mea-
surements, the most prominent fix is to apply Map-
Matching(Brakatsoulas et al., 2005), which will fix
Global Navigation Satellite System (GNSS) positions
to the closest position on a digital map.
2.1 Interpolated Approaches
A conventional approach to mitigate the effect of in-
complete FCD is to apply spline-based interpolation
on the trajectory of the CVs. Yoon et al. (Yoon et al.,
2007) establish the Temporal Mean Speed which is
also visualized in Figure 1. The described method
applies polynomial spline interpolation to reconstruct
vehicle traversals. Based on the resulting splines the
average velocity is calculated for each vehicle accord-
ing to Equation (2).
v
temporal
= ¯v =
∆x
∆τ
(2)
Even though this method delivers good results when
using a large percentage of CVs and less frequent
transmission of FCD, it quickly suffers in perfor-
mance when decreasing market penetration, due to
unsampled road segments.
2.2 Sample-Based Approaches
Opposing interpolated methods, it is also possible to
treat received samples individually and calculate an
averaged speed estimation that way. One such ap-
proach is displayed in Figure 2 which we label as the
Sample-based Mean Speed. Here, we slice the spatio-
temporal aggregation interval into equally sized time
chunks called T . First, we average all speed values
received for each time chunk T . Afterward, the arith-
metic mean for the entire aggregation interval ∆t is
calculated following Equation (3).
v
sample
=
1
T
T
∑
t=1
(
1
N
N
∑
α=1
v
α
(t)) (3)
While some information may be lost due to not in-
specting trajectories, this approach offers the flexibil-
ity of integrating samples measured using other vehi-
cles’ perception sensors. Using this approach allows
the integration of information from non-connected ve-
hicles into the TSE, which otherwise would have only
passively affected measurements. Figure 3 exemplar-
ily highlights where the inclusion of perceived vehi-
cles can be useful. These cases can roughly be cate-
gorized as follows:
1. Flowing traffic: Depending on the direction the
perception sensors are facing, it is possible to add
samples from vehicles moving in the same direc-
tion ( ˆ= flowing) as the ego vehicle on all lanes of
the driving direction. This information is less rel-
evant for speed estimates, as other vehicles likely
drive at similar speeds.
2. Oncoming Traffic: Front-facing perception sen-
sors allow the integration of all vehicles on op-
posing lanes if there are no obstructions in the
way. This information is highly valuable because
it gives insights into the traffic state on opposing
lanes correlates only minimally.
3. Intersecting Traffic: The speed information gath-
ered at intersections has to be treated carefully as
it rarely reflects the traffic state in its “flowing”
state but more likely vehicles accelerating after
waiting at a red light. Also, intersecting vehicles
can easily be occluded.
1)
2)
3)
3)
Figure 3: Illustration of additional samples acquired
through the use of perception sensors. The black vehicle
is a CV, while the orange vehicles can only be considered in
the TSE due to the additional sensors.
Traffic State Estimation on Urban Roads Using Perception-Enriched Floating Car Data
101
3 SIMULATION APPROACH
As required sensor technologies are not broadly
adapted yet and field tests are costly, we conduct our
examinations in a simulated environment. Thus al-
lowing us to implement and emulate all requirements
for a complete system test in a cheap and fast man-
ner. To ensure a degree of accountability and transfer-
ability we base the tests on domain-leading simulators
that have independently stood the test of time.
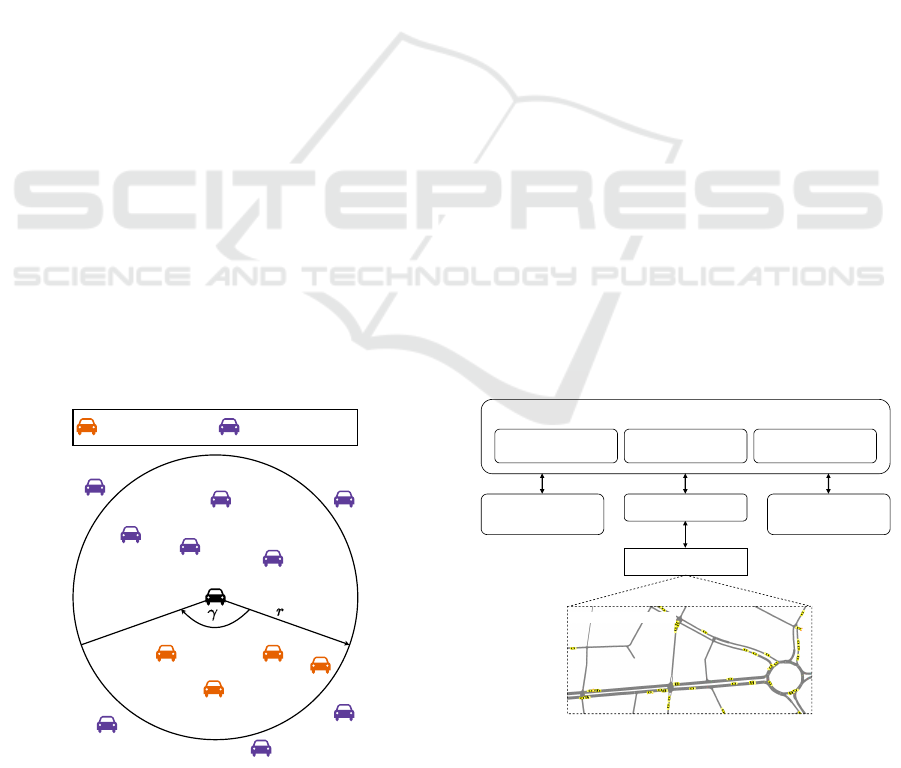
3.1 Holistic Simulated Vehicle
Perception and Data Fusion
For this paper, we do not aim toward mimicking a spe-
cific sensor technology and hardware requirements
for our vehicle perception. Instead, we utilize the co-
simulation framework Eclipse MOSAIC and its holis-
tic perception model presented in (Protzmann et al.,
2022). The perception model evaluates vehicle detec-
tions based on a circle sector defined by a radius r and
an angle γ (see Figure 4).
While the applied model is a simplification of
the perception task, it enables efficient simulation
even of large-scale urban scenarios like the BeST-
scenario(Schrab et al., 2022) and allows for assessing
the general potential of the proposed TSE approach.
Coordinating data from many error-prone sources
poses a challenge in real-world applications. Noisy
measurements, timing offsets, and network obstruc-
tions (delay, jitter, package loss) hurt the fusion of
samples. We deploy a server-side fusion of data that
fuses samples by using the unique identifiers, which
are sent as part of the FCD. Furthermore, we disre-
gard timing and network effects entirely.
- detected - not detected
Figure 4: A simple depiction of the perception model ap-
plied in this paper using a field-of-view filter. Orange vehi-
cles are detected while purple vehicles are not.
Realizing the system with these simplifications
means we can only make limited prognoses on the
performance of a real-world implementation. How-
ever, since we aim to evaluate the potential of a
perception-enriched FCD, we will disregard these ob-
structions in this initial study. We furthermore, disre-
gard privacy critical considerations but acknowledge
the importance of secure obfuscation of user data.
3.2 Extended MOSAIC Applications
Simulation-based testing requires a strong foundation
of realistic models to yield reliable results. There-
fore, we utilize the well-established simulation frame-
work Eclipse MOSAIC(Schrab et al., 2023) (see Fig-
ure 5), which is loosely based on the IEEE standard
for High-Level Architecture (HLA)(Dahmann et al.,
1997). MOSAIC couples many state-of-the-art FOSS
simulators (Free and Open-Source Software) from
different domains and also comes bundled with its
own. One of the strong suits of MOSAIC is its power-
ful application simulator which enables fast testing of
smart mobility applications, including V2X Commu-
nication via ITS-G5 and LTE/5G, autonomous vehicle
perception, and e-mobility.
The applications utilized for this work are built on
the application simulator and extend an openly avail-
able application suite (github.com/mosaic-addons/
traffic-state-estimation), previously developed and
published. These applications have been built to be
easily extensible and allow for the integration of dif-
ferent sensor technologies on the vehicle side as well
as extensibility in terms of TSE metrics on the server
side.
Interaction
Management
Eclipse MOSAIC Runtime Infrastructure
Time
Management
Federation
Management
Eclipse SUMO
TraCI
Sumo Ambassador
Eclipse MOSAIC Cell
Eclipse MOSAIC
Application
(b)
(a)
BeST-Scenario (Segment)
Figure 5: A rundown on Eclipse MOSAIC’s architecture.
(a) Runtime Infrastructure with the core tasks of federation,
and time and interaction management, enabling a synchro-
nized simulation. (b) Insight into the coupling of traffic sim-
ulator Eclipse SUMO including the BeST-scenario.
VEHITS 2024 - 10th International Conference on Vehicle Technology and Intelligent Transport Systems
102
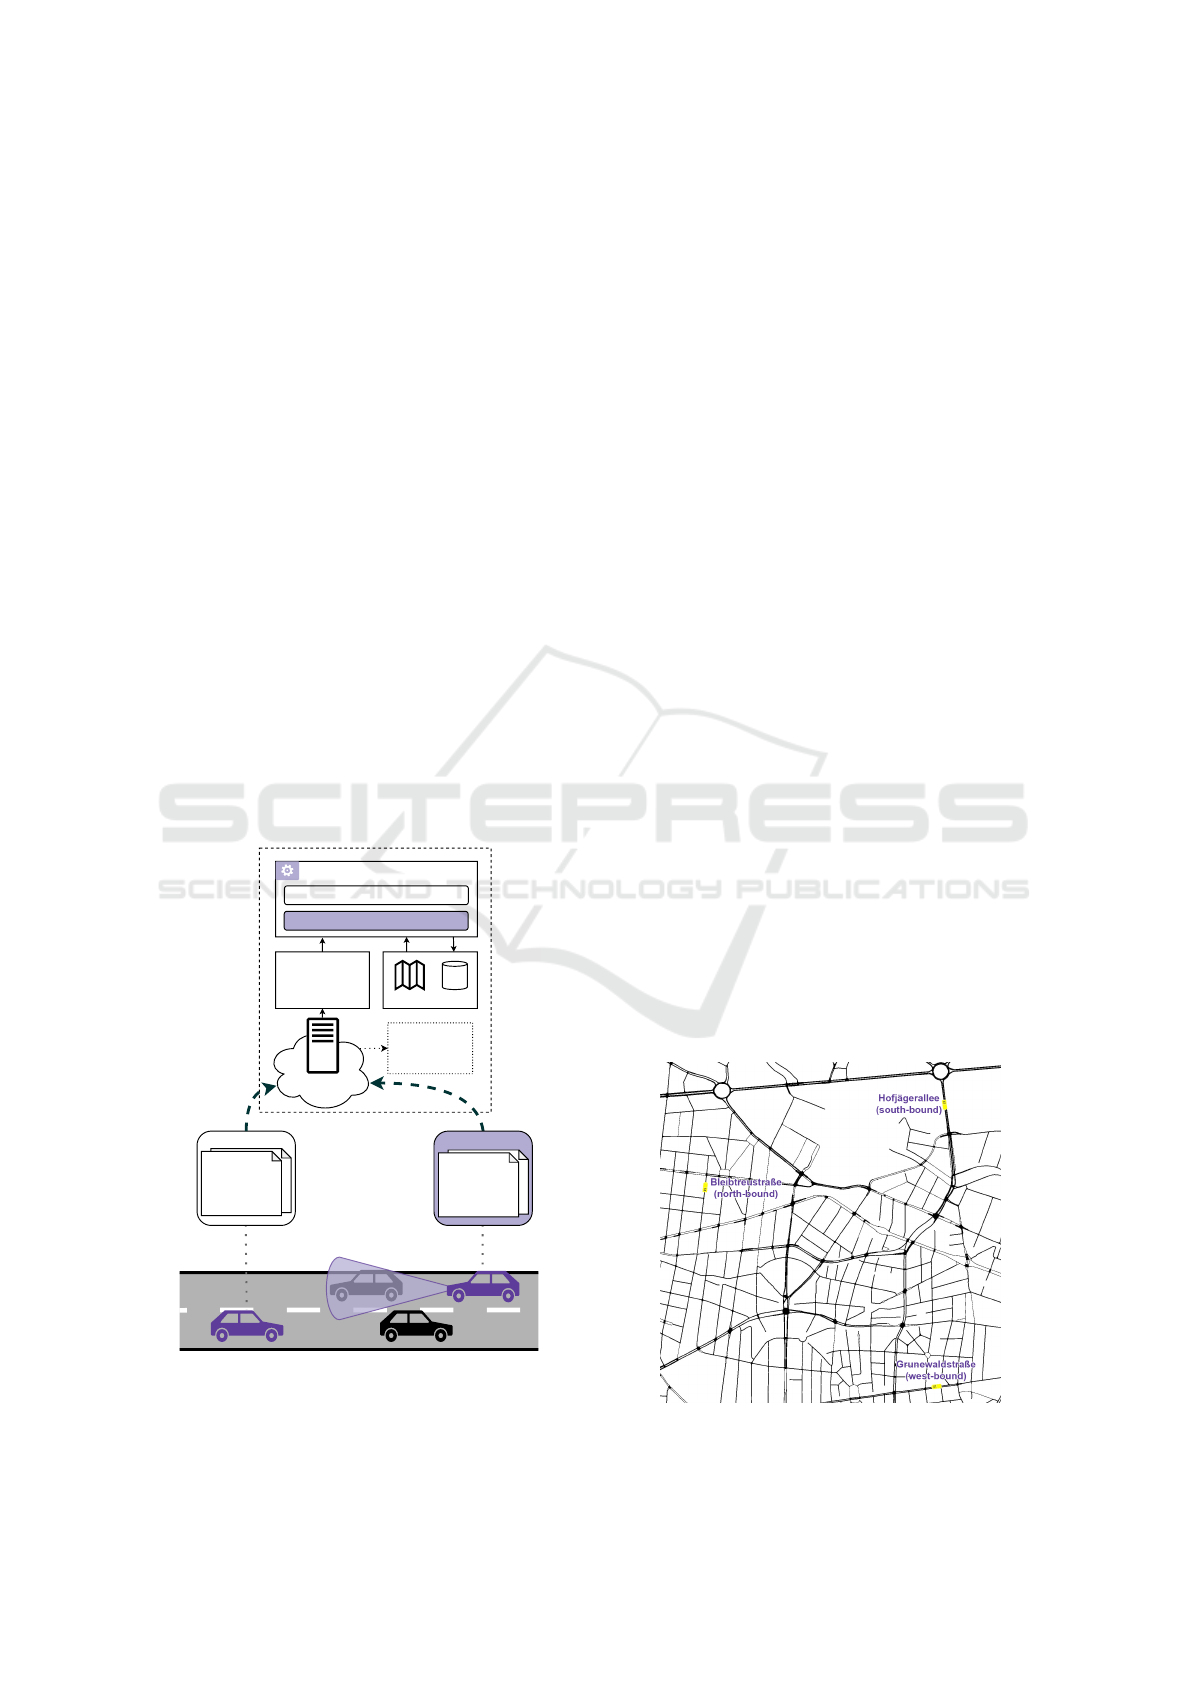
A basic schematic of the system design is depicted
in Figure 6. The system is made up of two appli-
cations, one running on all CVs and one running on
a centralized server. On the vehicle side, the FCD
Transmitter Application will periodically collect FCD
samples and transmit them in a collection called FCD
Update to the TSE Server using MOSAIC’s bundled
Cell simulator. In addition to conventional solutions,
we extend the FCD with a list of all surrounding ve-
hicles without any pre-processing for each connected
vehicle (CV) using MOSAIC’s aforementioned per-
ception model. The vehicle application can be config-
ured with variable sample collection and update trans-
mission times as well as perception ranges and angles.
At the heart of the server lies the TSE Kernel,
which is responsible for receiving the FCD, extract-
ing traversals, and supervising configured FCD Pro-
cessors. Previously, the Spatio-Temporal Traffic Met-
rics Processor has been established which calculates
the temporal and spatial mean speed as well as the
Relative Traffic Status Metric(Yoon et al., 2007) from
conventional FCD. The results from this processor
are later used as a baseline. In a new development, we
implemented the Perception Metrics Processor which
additionally considers the added data from perception
sensors. This processor aggregates the extended FCD
in a two-stage approach. First, all retrieved samples
are buffered using the time of collection as an index.
FCD-Update
FCD-Record
- position
- speed
- heading
TSE Server
Spatio-Temporal Traffic Metrics Processor
Perception Metrics Processor
- process FCD-Updates
- manage Processors
TSE Kernel
FCD Processors
Map
Database
Traffic
Information
Services
FCD-Update
FCD-Record
- position
- speed
- heading
- perception data
Figure 6: A simplified system overview of the applications.
The top part depicts the structure of the server application
and the bottom part shows how vehicles record FCD sam-
ples. The major new developments are marked in purple.
After a configurable delay, samples collected for the
same vehicle at the same time will be averaged (i.e.,
being perceived by multiple other vehicles). We con-
sider all samples as sharing the same truth regardless
of their origin. After the configured delay, the ag-
gregated samples for each vehicle will be moved to a
secondary buffer that aggregates the samples per net-
work edge, thus generating a mean speed estimate for
each edge and time stamp. The results from this ag-
gregation are then periodically persisted in a database
for further post-processing and evaluation.
In a real-world deployment, the metrics would be
relayed to Traffic Information Services to be accessi-
ble by end users. However, the evaluation of the data
is conducted entirely offline, after simulation.
4 EVALUATION
In previous work, we presented a calibrated large-
scale urban scenario for the city of Berlin(Schrab
et al., 2022) for the traffic simulator Eclipse
SUMO(Lopez et al., 2018) pre-configured to be used
in-hand with MOSAIC. The scenario comprises an
800 km
2
road network, 24 hours of vehicular road
traffic, and 2.25 million individual trips. For the eval-
uation of this paper, we opted to use the bundled sub-
section demand in the Charlottenburg area (see Fig-
ure 7), containing 200,000 trips, reducing simulation
time immensely.
Utilizing MOSAIC’s Mapping Ambassador, we
can equip variable percentages of the BeST traffic
with our applications (Section 3.2). We assume per-
fect perception capabilities and configured vehicles
with a 100 m viewing range and an angle of 360
◦
, and
also presume perfect communication capabilities ig-
noring effects of delay, packet loss, and jitter.
Figure 7: A map of Charlottenburg indicating the three
street segments under examination.
Traffic State Estimation on Urban Roads Using Perception-Enriched Floating Car Data
103

Table 1: Key markers of the inspected road segments.
street segment length #lanes speed limit signalized
Hofj
¨
agerallee 399.96 m 3 50
km
h
no
Grunewaldstraße 185.37 m 2 50
km
h
yes
Bleibtreustraße 182.34 m 1 30
km
h
yes
As we are trying to improve on conventional TSE sys-
tems, which rely on 5 % to 10 % market penetration,
we will further investigate rates below this threshold
range. Additionally, we only look at the times from
6 am to 10 pm as the traffic volume outside this time
window is insignificant, and a TSE becomes obsolete.
In all following plots, we resample results into 15 min
intervals using the arithmetic mean for mean speeds
and summing up collected sample numbers.
4.1 Comparative Examination
In this first evaluation, we focus on the street seg-
ments on the Hofj
¨
agerallee, the Grunewaldstraße, and
the Bleibtreustraße, highlighted in Figure 7. These
street segments were also chosen in our previous
work, due to exhibiting different characteristics that
potentially impact the resulting mean speed estimates
(see Table 1). The segment on the Hofj
¨
agerallee
is a long segment with 3 lanes and no traffic light
at the end resulting in a highway-like layout. The
Grunewaldstraße can be classified as a larger urban
street, with 2 lanes and a signalized end at the in-
spected segment. Lastly, the Bleibtreustraße is a
lowly frequented, almost residential one-lane road
that is also signalized.
Initially, we compare how the novel sample-based
mean speed performs against conventional FCD-
based approaches such as the temporal mean speed.
For this, we create time-series plots for the penetra-
tion rates of 1 %, 2 %, 3 %, 5 %, 10 %, and 100 %
as a baseline. Subsequently, we acquire plots in Fig-
ures 8, 10 and 12. In addition to the sample-based
mean speed (orange) and the temporal mean speed
(purple), we also plot the ground truth (GT) provided
by SUMO as a baseline (gray). Furthermore, we cre-
ate bar charts for the received samples on the server
side in Figures 9, 11 and 13, to compare the received
data based on applied market penetration for each the
extended FCD (left-hand side) and the conventional
FCD (right-hand side).
First, by comparing the temporal mean speed with
the captured ground truth we can revalidate results
from previous research. At 10 % and even 5 % market
penetration, FCD-based TSE still delivers usable re-
sults on the larger Hofj
¨
agerallee and Grunewaldstraße
but fails on the smaller Bleibtreustraße. Interestingly,
on the Hofj
¨
agerallee (Figure 8), the temporal mean
speed still manages to deliver usable results when de-
ploying only 1 % of CVs and only a few intervals go
completely unsampled. This is mainly due to two rea-
sons, (a) the Hofj
¨
agerallee is highly frequented and
thereby likelihood of at least one CV-traversal every
15 min is fairly high, and (b) the variance of the real-
izable mean speed is low throughout the day and be-
tween different vehicles, which means that even one
traversal can capture the mean speed accurately. The
results for the Grunewaldstraße (Figure 10) start to
degrade at higher market penetrations with many un-
sampled intervals at even 3 % and more outliers. We
see increased over- and underestimations of the mean
speed due to red traffic light phases either being cap-
tured or missed when fewer traversals are being ag-
gregated in each interval. Lastly, the temporal mean
speed fails to capture the mean speed at penetration
rates of 5 % and lower for the Bleibtreustraße (Fig-
ure 12), as too few traversals are captured.
Next, looking at the resulting time series for
the sample-based mean speed, some advantages but
also some downfalls can be established. For the
Hofj
¨
agerallee (Figure 8), a clear improvement is ap-
parent compared to the temporal mean speed. Not
only are we able to sample every interval even at 1 %
penetration rate, but we also improve general consis-
tency, capturing virtually zero outliers. The reasoning
for this is similar to the reasons given for the good
performance of the temporal mean speed. Capturing
only a few additional samples of steady-flow traffic
on a large, highly frequented road segment, allows for
an improved TSE because most of the collected sam-
ples can be assumed to reflect the mean speed of the
entire segment decently well. This effect cannot be
observed in the same magnitude for the Grunewald-
straße and Bleibtreustraße. On the Grunewaldstraße
(Figure 10), it is apparent that we can capture more
and less fluctuating speed estimates using the sample-
based mean speed even with penetration rates of about
2 %, meaning that the additional data from percep-
tion sensors do improve the overall quality of the es-
timates. Nonetheless, especially at lower penetration
rates, the deviations from the ground truth are larger
compared to the results on the Hofj
¨
agerallee.
VEHITS 2024 - 10th International Conference on Vehicle Technology and Intelligent Transport Systems
104
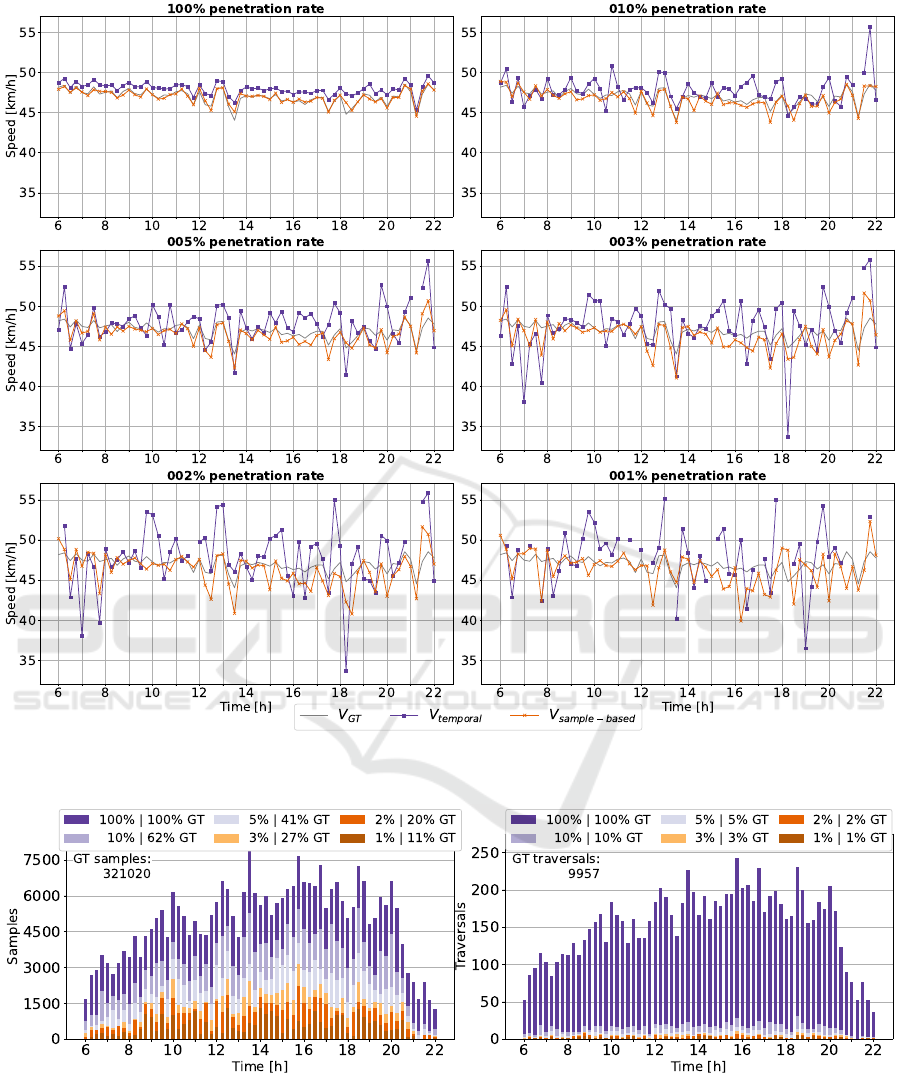
Figure 8: A comparison of the aggregated sample-based mean speed against the temporal mean speed on the Hofj
¨
agerallee.
The values are measured for different penetration rates and averaged for 15 min intervals.
Figure 9: Comparison of received data amount depending on the rate of connected vehicles on the Hof
¨
agerallee summed-up
within 15 min intervals. Left: The number of individual samples (i.e., the sum of vehicles per road segment each time step)
used for the sample-based mean speed using conventional FCD plus perception. Right: The number of extracted traversals
used for the temporal mean speed, relying solely on conventional FCD.
Traffic State Estimation on Urban Roads Using Perception-Enriched Floating Car Data
105
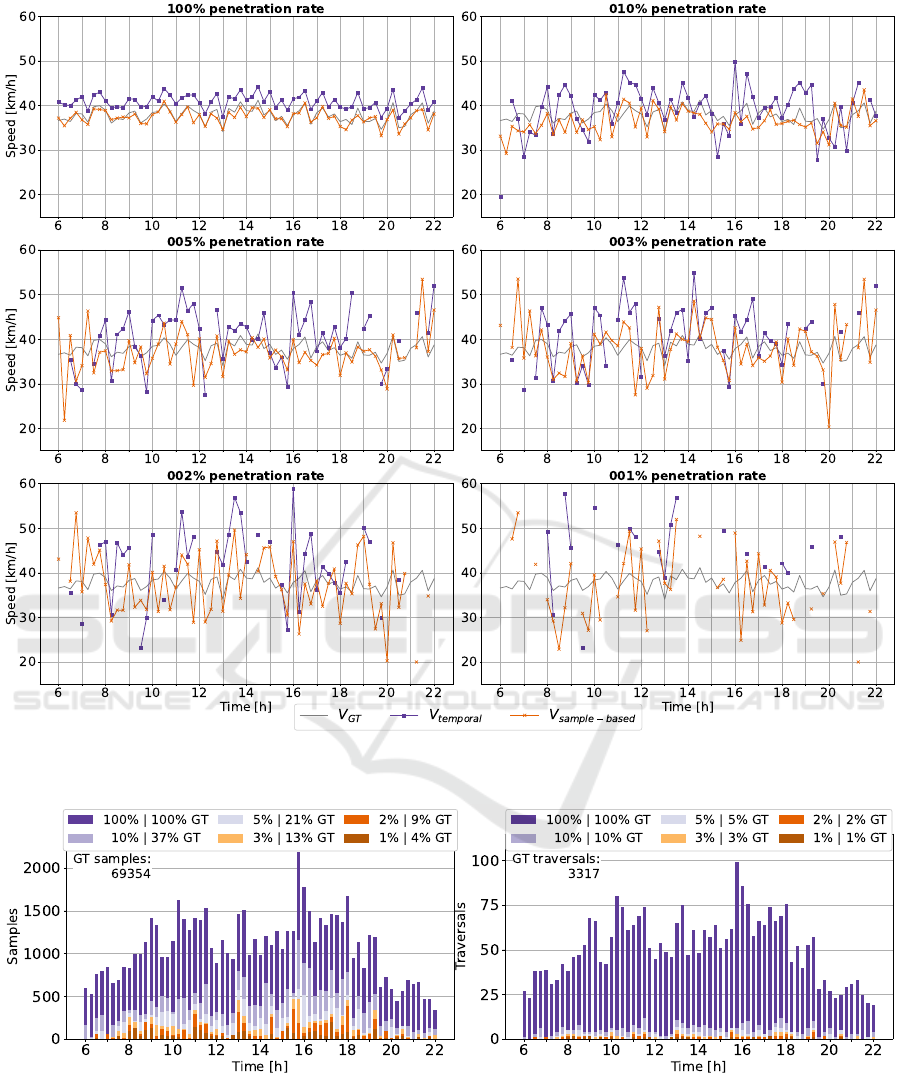
Figure 10: A comparison of the aggregated sample-based mean speed against the temporal mean speed on the Grunewald-
straße. The values are measured for different penetration rates and averaged for 15 min intervals.
Figure 11: Comparison of received data amount depending on the rate of connected vehicles on the Grunewaldstraße summed-
up within 15 min intervals. Left: The number of individual samples (i.e., the sum of vehicles per road segment each time step)
used for the sample-based mean speed using conventional FCD plus perception. Right: The number of extracted traversals
used for the temporal mean speed, relying solely on conventional FCD.
VEHITS 2024 - 10th International Conference on Vehicle Technology and Intelligent Transport Systems
106
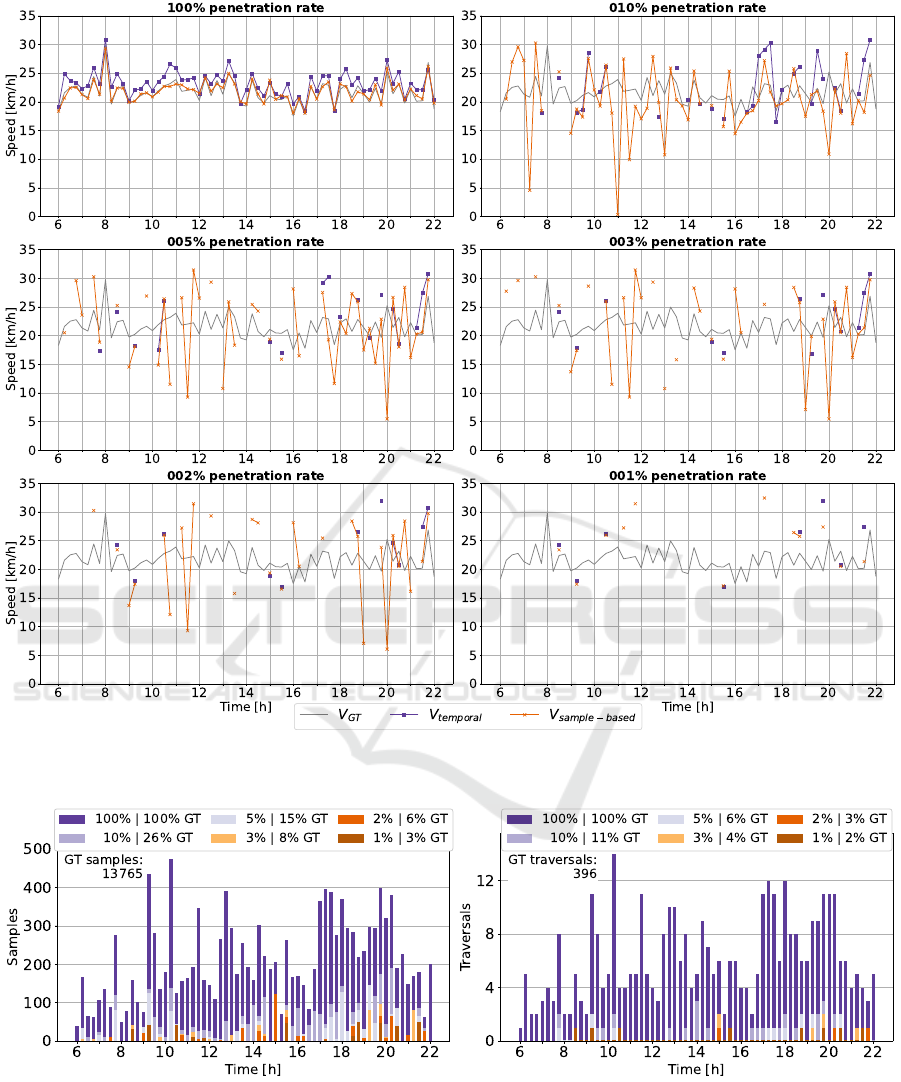
Figure 12: A comparison of the aggregated sample-based mean speed against the temporal mean speed on the Bleibtreustraße.
The values are measured for different penetration rates and averaged for 15 min intervals.
Figure 13: Comparison of received data amount depending on the rate of connected vehicles on the Bleibtreustraße summed-
up within 15 min intervals. Left: The number of individual samples (i.e., the sum of vehicles per road segment each time step)
used for the sample-based mean speed using conventional FCD plus perception. Right: The number of extracted traversals
used for the temporal mean speed, relying solely on conventional FCD.
Traffic State Estimation on Urban Roads Using Perception-Enriched Floating Car Data
107
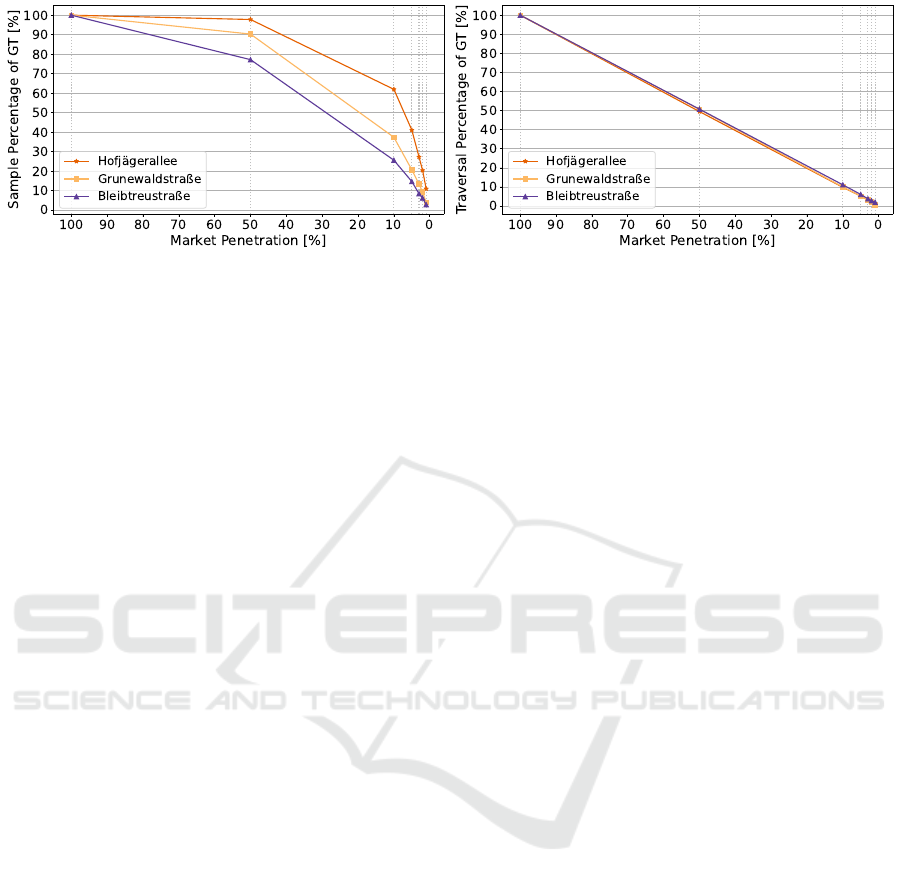
Figure 14: Relation between market penetration and received data points plotted relatively to the GT (i.e., 100 % penetration
rate) indicated for penetration rates of 1 %, 2 %, 3 %, 5 %, 10 %, 50 %, and 100 %. Left: Plot for the extended FCD. Right:
Plot for the conventional FCD. Note, the connecting lines are only added for visualization purposes.
With estimates gathered at 1 % only providing
marginally better results compared to the temporal
mean speed. Looking at the smallest of the three
streets, the Bleibtreustraße (Figure 12), some inter-
esting observations can be made. At 10 % market
penetration, but also at 5 %, 3 %, and 2 %, some out-
liers close to 0 km/h are measured. Going back to
Figure 3 in Section 2, we can assume that an inter-
secting CV perceives one or more vehicles waiting at
a traffic light with low speeds; thus misrepresenting
the estimates for the given time intervals with small
speeds. Multiple measures can be taken to get rid of
these misinterpretations, a simple approach would be
to implement a sample threshold for time intervals,
requiring at least n samples before any aggregation
happens. Still, when disregarding these outliers, we
notice an overall improvement in sample density, de-
creasing the number of unsampled intervals.
After inspecting the resulting time-series dia-
grams, we can shift the focus to the underlying data
by looking at Figures 9, 11 and 13. Preceding any
further evaluation, the difference in significance be-
tween Samples for the sample-based mean speed and
Traversals for the temporal mean speed has to be clar-
ified. While a sample is the combined view of a
vehicle’s position and speed at one point in time, a
traversal captures the entire passing of a given road
segment, meaning a traversal encodes much more in-
formation than a single sample. As a consequence,
the magnitude of these values cannot be compared
one-to-one, but rather the percentage of data cap-
tured compared to the ground truth (here meaning the
100 % penetration rate) is important and therefore ad-
ditionally displayed in Figure 14. Without the use
of perception, the traversal amount is directly pro-
portional to the market penetration on all three road
segments, leading to issues on less frequented roads
such as the Bleibtreustraße, especially at smaller pen-
etration rates. Looking at the effect of perception, we
can see that there no longer is a linear relation be-
tween market penetration and the amount of received
data. In fact, on all three roads, the percentages in-
crease over the conventional FCD at all penetration
rates. However, a dependence on the road type is ap-
parent once again; the larger the road, the larger the
number of additional samples received. This is also
very intuitive because the larger a street and its traffic
density are, the more likely it is for additional samples
to be captured by surrounding vehicle perception, sig-
naling increased samples from Flowing Traffic.
In summary, we can see a clear improvement
in estimation quality at lower penetration rates due
to additional samples being captured by the vehicle
perception. Nonetheless, some inconsistencies were
identified; when too little of a road segment is be-
ing sampled, a misinterpretation of the mean speed
may occur. However, this is more likely to happen
on smaller, less densely traversed roads, for which a
TSE becomes less relevant as these road types rarely
experience congestion or other disruptions. Still, be-
ing able to accurately measure mean speeds on major
road arteries like the Hofj
¨
agerallee with small rates of
CVs (1 % and smaller) is of great value.
4.2 Travel Time Analysis
After having established that the sample-based mean
speed can outperform conventional FCD-based meth-
ods in Section 4.1, especially on high-density streets,
we aimed at an evaluation proxy for the entire road
network. As mentioned previously, mean speed es-
timates can be used as direct input for routing algo-
rithms, but in addition to choosing better routes, more
accurate estimates also enable better calculation of re-
quired travel times. In consequence, if we can pro-
duce overall more accurate travel time estimates com-
pared to the conventional methods, we can globally
assume a better quality of the TSE.
VEHITS 2024 - 10th International Conference on Vehicle Technology and Intelligent Transport Systems
108
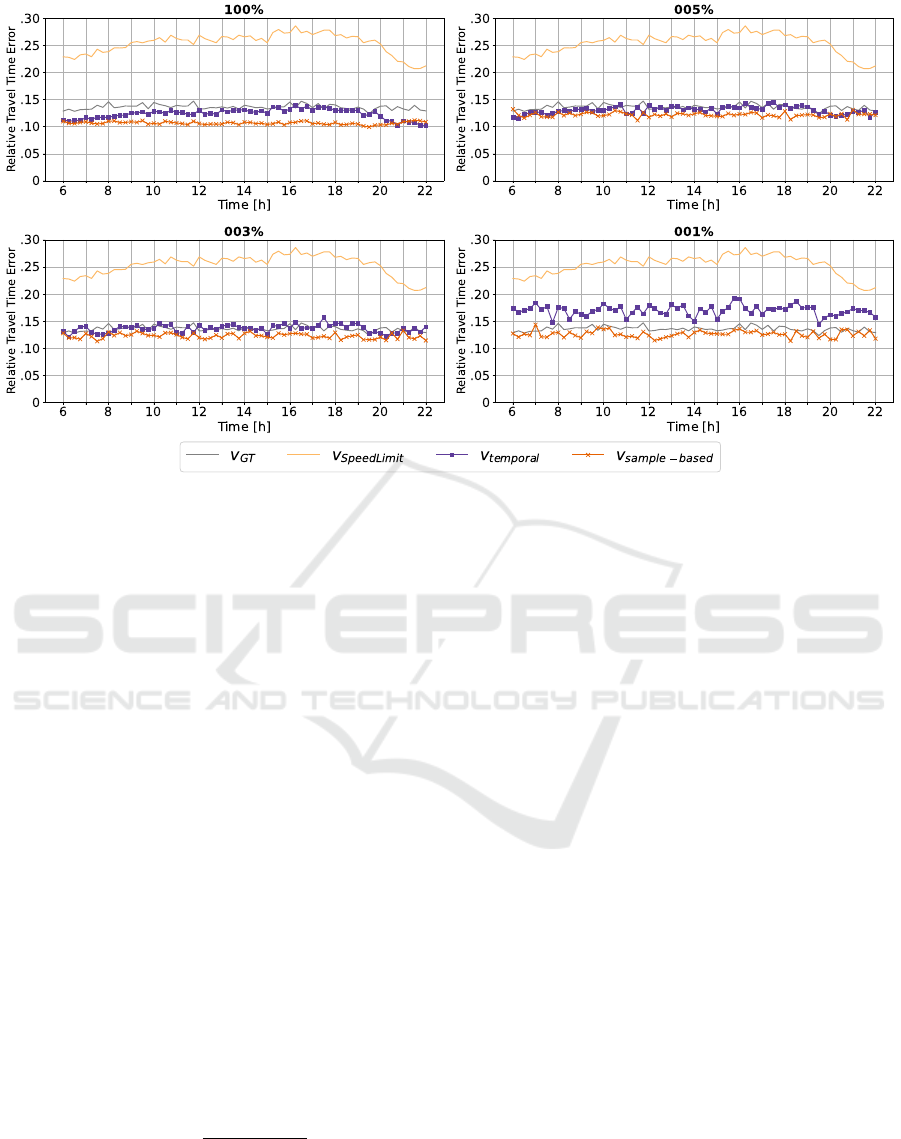
Figure 15: A comparison of the average relative errors between estimated and actual travel times using different mean speed
estimates as input for the routing cost.
To test this, we run the same simulation with the
same demand twice. The first iteration was used to
gather speed estimates, following the methods de-
scribed in the prior sections. In addition to the tem-
poral and sample-based mean speed, we included the
ground truth as well as the speed limit for every road
segment. For the second simulation, we developed
simple applications that estimate the travel time for
their given route by summing up the time it would
take to traverse each edge of the route using the de-
scribed speeds. As the realizable speed also has a
temporal dependence, we used the closest available
speed estimates not older than one hour before a ve-
hicle started its tour. If no estimate is available the
speed limit was used as a default. Also note that no
turn costs were considered in the travel time estima-
tion, so a certain bias is to be expected. Results of the
estimations as well as the actual recorded travel times
are written to a file for later processing, where errors
for all vehicles starting their tours within an interval
are averaged. We calculate the unsigned mean rela-
tive error RME
+
for each of the travel time estimates
following Equation (4), where t
travel
is the measured
travel time and t
x,est
signifies the applied estimate.
RME
+
=
|
t
travel
−t
x,est
|
t
travel
(4)
The outcome is plotted in Figure 15 at penetration
rates of 100 %, 5 %, 3 %, and 1 % for 15 min intervals.
In these plots, an error of 0.1 signifies that on average
the travel time estimations are wrong by 10 %. We
can see that even when using the measured ground
truth speeds we have an average error of about 15 %,
possibly due to the bias caused by ignoring turn costs.
Furthermore, the largest error can be observed for the
speed limit, which underestimates travel times, es-
pecially with increased traffic density throughout the
midday. For estimates generated using the temporal
and sample-based mean speed, it can be observed that
for all measured penetration rates they both outper-
form the conventional method of using the speed limit
as routing cost. Interestingly, they also outperform
estimates generated using the ground truth; however,
this phenomenon likely occurs due to the inherent bias
introduced by the simplified cost calculation.
More important is the comparison of the two
estimates with the utilized equipment rate of CVs.
While for both estimations the average error increases
at lower penetration rates, the perception-induced
sample-based mean speed can better compensate for
missing samples and provides better travel time esti-
mates at lower penetration rates. This becomes es-
pecially apparent when looking at the 1 % case where
the temporal mean speed estimates more often default
to using the speed limit thereby increasing the overall
error, while the sample-based mean speed estimates
still provide consistent results. Following these re-
sults an examination of equipment rates of less than
1 % appears to be of interest, unfortunately, these ex-
periments could not be conducted within the scope of
this paper.
Traffic State Estimation on Urban Roads Using Perception-Enriched Floating Car Data
109

It is important to not lift these results out of pro-
portion, particularly because we used simplified and
over-realistic models for communication and percep-
tion. Nonetheless, the potential upsides of enrich-
ing FCD with data from perception sensors have been
proven and should further be examined.
5 CONCLUSION & OUTLOOK
In this paper, we investigated the research question
of whether a good level of Traffic State Estimation
(TSE) based on Floating Car Data (FCD) can be real-
ized with sufficient precision, even at low equipment
rates, yet with high data quality from perception sen-
sors.
In previous work(Schweppenh
¨
auser et al., 2023),
we offered an introduction to established speed met-
rics for TSE and respective sensor modalities as well
as their upsides and shortcomings. The main aspects
of this work have been reiterated in the first part of
this paper. Floating Car Data approaches have been
identified to be the most common source for current-
day navigation applications. The Temporal Mean
Speed(Yoon et al., 2007) was found to be one of the
core measures to be estimated from FCD traces us-
ing curve-fitted traversals. In contrast to conventional
methods, we inspected how perception sensors could
be used to improve the data quality for the sake of
mean speed estimation. We differentiated three traffic
scenarios, Flowing, Oncoming, and Intersecting Traf-
fic that show different levels of potential gain. Based
on this, we utilized Eclipse MOSAIC’s(Schrab et al.,
2023) perception module and showed how data gath-
ered from surrounding vehicles can be used as addi-
tional input for mean speed estimation in the form of
the Sample-Based Mean Speed.
To evaluate the established measures, we set up
a simulation-based test, leveraging the strengths of
MOSAIC. Building on top of previously published
applications
1
, we developed a new processor for cal-
culating the sample-based mean speed. By coupling
state-of-the-art simulators and utilizing the calibrated
large-scale BeST scenario(Schrab et al., 2022), we
can generate sensible and transferable results.
Focusing on the area of Charlottenburg, we
first conducted a study comparing the temporal and
sample-based mean speed with the ground truth gen-
erated by the traffic simulator Eclipse SUMO. We
furthermore identified that estimation quality strongly
depends on the road type for both the conventional
1
https://github.com/mosaic-addons/traffic-state-
estimation
and the perception-enriched FCD as well as the mar-
ket penetration of connected vehicles. Consequently,
we looked at time-series plots for the speed estima-
tions and the amount of data received for three ex-
emplary road segments in dependence on penetration
rates. We were able to validate the proposed ap-
proach of the Sample-Based Mean Speed as a sensible
method to estimate the mean speed. This analysis fur-
ther showed that regardless of the targeted road type
the perception increases the amount of received data,
and thereby improves estimation quality. As a conse-
quence, this indicates that penetration rates of 1 % and
lower can be sufficient to provide reliable mean speed
estimates for larger road segments. Nonetheless, we
also identified shortcomings and less promising re-
sults for smaller road segments, which we intend to
further investigate in future work.
Evaluating the estimation quality on a global scale
is a non-trivial task. Therefore, we defined the result-
ing travel time estimations as a proxy for the overall
TSE quality. Our results indicated that using percep-
tion data from surrounding vehicles improves average
travel time estimates over conventional FCD, partic-
ularly at lower penetration rates, thereby indicating a
globally improved estimation quality.
Concerning a real-world deployment of the pro-
posed system, some challenges arise. For one, we
heavily simplified the vehicle perception and sen-
sor fusion. Real sensors suffer from occlusion and
noise, which reduce sample size and quality. Sec-
ondly, we disregarded the constraints of the cellular
network. Cell coverage, timing issues, losses, and
package sizes are not realistically modeled. Nonethe-
less, this study still holds meaning as the listed limita-
tions can either be overcome by improved technology
or only have a minor impact on final results.
In conclusion, our results indicate that data from
vehicular perception sensors can be a valuable addi-
tion to the input of Intelligent Transportation Systems
such as TSE and should be further researched. In the
future, we aim to make our results more quantifiable
by improving the realism of the applied perception
model, including occlusion and noise. We further aim
to investigate how the deployed estimation techniques
react to more disruptive traffic patterns like conges-
tion, construction sides, and second-row parking.
ACKNOWLEDGEMENTS
This work was supported by the KIS’M project
through the German Federal Ministry for Economic
Affairs and Climate Action under grant 45AVF3001E.
VEHITS 2024 - 10th International Conference on Vehicle Technology and Intelligent Transport Systems
110

REFERENCES
Blokpoel, R. J., Krajzewicz, D., and Nippold, R. (2010).
Unambiguous metrics for evaluation of traffic net-
works. In 13th International IEEE Conference on
Intelligent Transportation Systems, pages 1277–1282.
IEEE.
Brakatsoulas, S., Pfoser, D., Salas, R., and Wenk, C. (2005).
On Map-Matching Vehicle Tracking Data. In Pro-
ceedings of the 31st International Conference on Very
large Data Bases, pages 853–864.
Dahmann, J. S., Fujimoto, R. M., and Weatherly, R. M.
(1997). The Department of Defense High Level Ar-
chitecture. In Proceedings of the 29th Conference on
Winter Simulation, pages 142–149.
Delooz, Q., Riebl, R., Festag, A., and Vinel, A. (2020). De-
sign and Performance of Congestion-Aware Collec-
tive Perception. In 2020 IEEE Vehicular Networking
Conference (VNC), pages 1–8. IEEE.
Ferman, M. A., Blumenfeld, D. E., and Dai, X. (2005). An
Analytical Evaluation of a Real-Time Traffic Informa-
tion System Using Probe Vehicles. In Journal of In-
telligent Transportation Systems, volume 9, pages 23–
34. Taylor & Francis.
Lopez, P. A., Behrisch, M., Bieker-Walz, L., Erdmann, J.,
Fl
¨
otter
¨
od, Y.-P., Hilbrich, R., L
¨
ucken, L., Rummel,
J., Wagner, P., and Wießner, E. (2018). Microscopic
Traffic Simulation using SUMO. In 2018 21st In-
ternational Conference on Intelligent Transportation
Systems (ITSC), pages 2575–2582. IEEE.
Messelodi, S., Modena, C. M., Zanin, M., De Natale, F. G.,
Granelli, F., Betterle, E., and Guarise, A. (2009). In-
telligent extended floating car data collection. Expert
Systems with Applications, 36(3, Part 1):4213–4227.
Protzmann, R., Schrab, K., Schweppenh
¨
auser, M., and
Radusch, I. (2022). Implementation of a Perception
Module for Smart Mobility Applications in Eclipse
MOSAIC. In SUMO Conference Proceedings, vol-
ume 3, pages 199–214.
Ruppe, S., Junghans, M., Haberjahn, M., and Troppenz, C.
(2012). Augmenting the Floating Car Data Approach
by Dynamic Indirect Traffic Detection. Procedia - So-
cial and Behavioral Sciences, 48:1525–1534. Trans-
port Research Arena 2012.
Schrab, K., Neubauer, M., Protzmann, R., Radusch, I.,
Manganiaris, S., Lytrivis, P., and Amditis, A. J.
(2023). Modeling an ITS Management Solution for
Mixed Highway Traffic With Eclipse MOSAIC. IEEE
Transactions on Intelligent Transportation Systems,
24(6):6575–6585.
Schrab, K., Protzmann, R., and Radusch, I. (2022). A
Large-Scale Traffic Scenario of Berlin for Evaluating
Smart Mobility Applications. In Conference on Sus-
tainable Urban Mobility, pages 276–287. Springer.
Schweppenh
¨
auser, M., Schrab, K., Protzmann, R., and
Radusch, I. (2023). Spatio-Temporal Speed Metrics
for Traffic State Estimation on Complex Urban Roads.
In International Conference on Simulation Tools and
Techniques. Springer.
Wardrop, J. G. and Charlesworth, G. (1954). A Method of
Estimating Speed and Flow of Traffic from a Moving
Vehicle. Proceedings of the Institution of Civil Engi-
neers, 3(1):158–171.
Yoon, J., Noble, B., and Liu, M. (2007). Surface Street
Traffic Estimation. In Proceedings of the 5th Inter-
national Conference on Mobile systems, applications
and services, pages 220–232.
Traffic State Estimation on Urban Roads Using Perception-Enriched Floating Car Data
111
