
Enhancing Interaction with Data Lakes Using Digital Twins and
Semantic Blueprints
Spyros Loizou
a
, Michalis Pingos
b
and Andreas S. Andreou
c
Department of Computer Engineering and Informatics, Cyprus University of Technology, Limassol, Cyprus
Keywords: Digital Twins, Data Lakes, Data Blueprints, Graphical Dashboard, Smart Data Processing, Big Data
Characteristics.
Abstract: Advanced analytical techniques and sophisticated decision-making strategies are imperative for handling
extensive volumes of data. As the quantity, diversity, and speed of data increase, there is a growing lack of
confidence in the analytics process and resulting decisions. Despite recent advancements, such as metadata
mechanisms in Big Data Processing and Systems of Deep Insight, effectively managing the vast and varied
data from diverse sources remains a complex and unresolved challenge. Aiming to enhance interaction with
Data Lakes, this paper introduces a framework based on a specialized semantic enrichment mechanism
centred around data blueprints. The proposed framework takes into account unique characteristics of the data,
guiding the process of locating sources and retrieving data from Data Lakes. More importantly, it facilitates
end-user interaction without the need for programming skills or database management techniques. This is
performed using Digital Twin functionality which offers model-based simulations and data-driven decision
support.
1 INTRODUCTION
Nowadays, in the era of Big Data, a substantial
volume and variety of data generated from various
sources necessitate storage in new Big Data
architectures. Data visualization represents data in a
systematic form, including attributes and variables for
the unit of information. Visualization data allows
users and businesses mash up data sources to create
custom analytical views (Gupta et al., 2022). A
Digital Twin (DT) is a virtual representation of an
object or system that spans its lifecycle, is updated
from real-time data, and uses simulation, machine
learning and reasoning to support decision-making. In
addition, a DT can also facilitate predictions about
how an asset or process will evolve or behave in the
future (Rasheed et al., 2020).
The analysis of massive amounts of data requires
advanced analytical techniques for processing and
advanced decision-making strategies. As the amount,
variety, and speed of data increases, lack of
confidence in the resulting analytics process and
a
https://orcid.org/0009-0009-3433-3245
b
https://orcid.org/0000-0001-6293-6478
c
https://orcid.org/0000-0001-7104-2097
decisions grows. In comparison to traditional data
techniques and platforms, artificial intelligence
techniques such as machine learning, natural
language processing, and computational intelligence,
provide more accurate, faster, and scalable results in
big data analytics (Hariri et al., 2019).
Despite the substantial and transformative
solutions suggested in recent years, such as metadata
mechanisms within the realm of Big Data Processing
and Systems of Deep Insight, effectively handling the
extensive data generated by diverse and varied
sources remains a complex and unresolved issue. This
paper addresses this challenge and focuses on visual
representation and interactive techniques to transform
primary, raw data residing in Data Lakes (DLs) to
meaningful data, which may be utilized by end users.
The contribution of this paper lies with the
proposition of a framework and a dedicated semantic
enrichment mechanism structured around data
blueprints to facilitate interaction with DLs. A
suggested technique to improve metadata in a DL
environment is called "data blueprint," which uses
Loizou, S., Pingos, M. and Andreou, A.
Enhancing Interaction with Data Lakes Using Digital Twins and Semantic Blueprints.
DOI: 10.5220/0012620600003687
Paper published under CC license (CC BY-NC-ND 4.0)
In Proceedings of the 19th International Conference on Evaluation of Novel Approaches to Software Engineering (ENASE 2024), pages 353-361
ISBN: 978-989-758-696-5; ISSN: 2184-4895
Proceedings Copyright © 2024 by SCITEPRESS – Science and Technology Publications, Lda.
353

semantics as a framework for describing data sources
before they are included in a DL. The framework
includes data specific characteristics and guides the
process of locating the sources and retrieving data
residing in DLs with the functionality and benefits of
a DT environment.
The rest of the paper is structured as follows:
Section 2 discusses related work and provides the
technical background in the areas of data processing
and visualization, DTs and DLs. Section 3 presents
the proposed framework and describes how
blueprints and their extended data characteristics are
integrated in processing and analysis steps to
facilitate decision support. Section 4 demonstrates the
proposed approach using a real-world case-study
performed in a smart manufacturing environment and
more specifically using real-world data collected at a
local poultry meat factory Paradisiotis Group Ltd
(PARG). Finally, Section 5 concludes the paper and
highlights future work steps.
2 TECHNICAL BACKGROUND/
RELATED WORK
This section briefly describes the technical
foundations of data processing, DTs and DLs, as well
as visualization platforms that use blueprints to
process data. To the best of our knowledge, no
research has been documented as to how to combine
extended features and data blueprints for customized
smart analytics using graphical environments for
interactive, visual, smart data processing in the
literature. In the world of Big Data, data visualization
tools and technologies are the challenges tackled in
different papers focusing on how to analyse massive
amounts of information and make data-driven
decisions. By introducing traditional visualization
techniques and extending some of them for handling
large data, talking about the difficulties associated
with big data visualization, and examining
technological advancements in big data visualization,
Gupta et al., (2022) present new techniques and
advancements in the field.
2.1 Digital Twins
Generally, DT is a physical product or process that
exists in the real world and is used for operations as
its practically identical digital counterpart. A DT
controls the lifecycle of the IoT, minimizes defects,
and optimizes errors to save money and time. Because
a DT can stream, optimize, and analyze data in both
the virtual and real worlds, it is a powerful
technological tool. This work applies the concept of
DTs using them to graphically represent data in real
time and provide models for interaction and
simulations.
Several papers address the problem of monitoring
real-time data and optimization of graphical
environments for interactive, visual smart data
processing with characteristics based on blueprints.
Automated analytics, semantics-based information
fusion and process automation are among the targets
for improving the performance of systems for real-
time business intelligence (RTBI). Technologies like
intelligent data analysis, soft computing and
ontologies will play a major role in the development
of RTBI (Azvine et al., 2006).
Pang et al. (2015) present an innovative Data-
Source Interoperability Service (DSIS) that serves as
a middleware for providing a querying and
information integration service for heterogeneous
data sources. The DSIS applies software agent
technology that is capable of accomplishing tasks in
an autonomous way without human intervention.
Fuller et al. (2020) present the challenges,
applications, and enabling technologies for Artificial
Intelligence, IoT and DTs.
Kritzinger et al., (2018) aim to provide a
categorical literature review of the DT in
manufacturing and to classify existing publication
according to their level of integration of the DT.
2.2 Data Lakes
Large volumes of organized and unstructured data at
any scale can be stored centrally in a DL. A DL
enables the storing of raw data in its original format,
in contrast to typical databases or data warehouses,
which demand that data be formatted before storing.
DLs provide storage flexibility by enabling data to be
stored without first defining a schema. This feature
makes it possible to accommodate different formats
and types of data from different sources.
Although DLs are very flexible, they must be
managed carefully to avoid turning into "data
swamps," which are places where data is
disorganized, hard to locate and retrieve, and thus
difficult to analyse in general. Data cataloguing,
metadata management, and data governance policy
establishment are essential procedures to handle this
issue.
The authors in (Pingos and Andreou, 2022)
propose a novel standardization framework that
combines blueprint ontologies, DL architecture, and
the 5Vs Big Data characteristics to address the
ENASE 2024 - 19th International Conference on Evaluation of Novel Approaches to Software Engineering
354
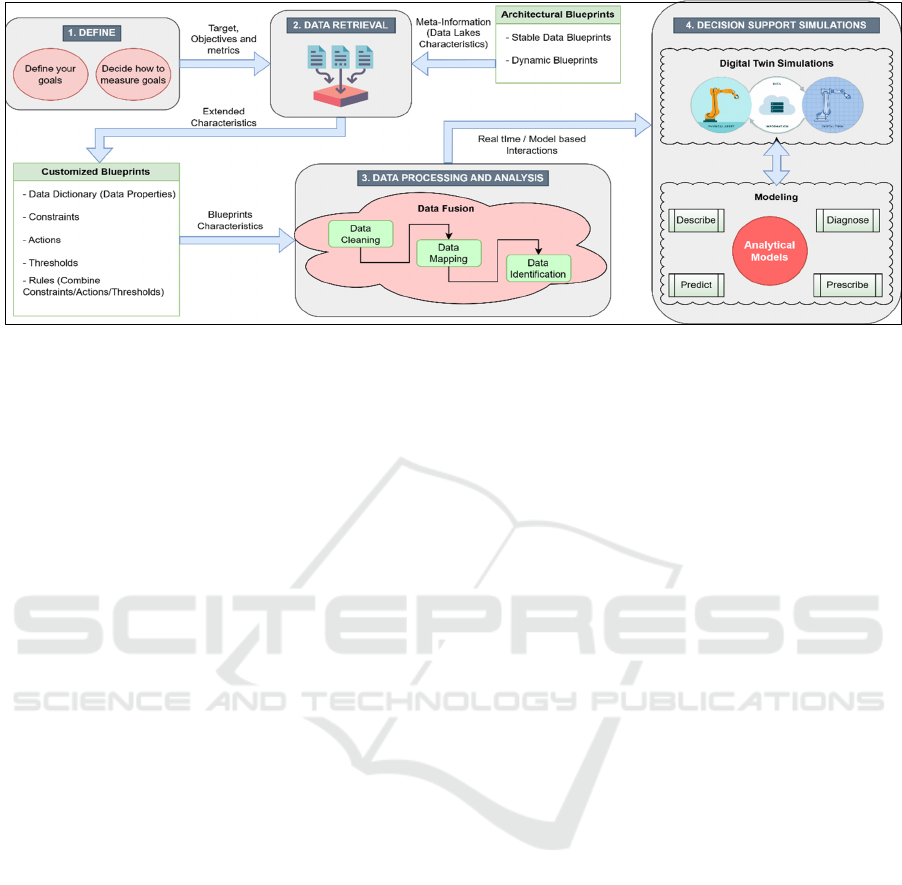
Figure 1: General architectural structure.
complex problem of dealing with heterogeneous data
sources. Data blueprint is a proposed method to
enhance the metadata within a DL environment,
leveraging semantic as a guiding framework of
describing data sources before they become part of a
DL. The mechanism introduced in that work involves
semantic structures and utilizes both the theory of
Triples (subject-predicate-object) and the Resource
Description Framework (RDF) to improve the
organization, mapping, and retrieval of data stored in
the DL. The semantic blueprints can be utilized with
the combination of 5Vs characteristics of Big Data to
improve the effectiveness and metadata quality
within DLs, addressing challenges associated with
managing and extracting meaningful information
from large and diverse datasets.
The authors in Pingos et al., (2022) introduce
DLMetaChain, an expanded DL metadata framework
that combines IoT data with heterogeneous data
sources. Blockchain technology has emerged recently
as a potentially useful tool for resolving security and
privacy issues, as well as for fostering trust between
entities where it has either never been established or
is non-existent. The expanded mechanism places a
strong emphasis on creating an architecture that
guarantees the integrity of the data in the DL.
The establishment of a metadata framework based
on DL architecture as demonstrated in PARG factory
is a noteworthy addition to the fields of data
management and process mining. This novel structure,
as put out (Pingos and Andreou, 2022) makes use of
the idea of blueprints to methodically describe the data
sources: Structure Blueprint (SB), Semi-Structured
Blueprint (SEB) Unstructured Blueprint (UB) and
manufacturing processes: Machine Blueprint (MB),
Event Blueprint (EB) and Process Blueprint (PB). SB
includes a metadata description of the correspondence
pond which contains structured data. In addition to the
SEB, there is also the UB, designed to capture and
organize sources in the DL that lack a predefined data
model. UB accommodates diverse and unstructured
data types, enabling the system to handle information
that may not conform to a specific format. Moreover,
manufacturing processes are represented by the MB,
EB and PB. These blueprints collectively provide a
comprehensive framework for understanding and
managing diverse aspects of the system's structure and
processes. contributes to the construction of a
comprehensive DL metadata history, presented in RDF
(Resource Description Framework), offering a detailed
and interconnected view of the system’s evolving data
landscape. This study, which focuses on a factory that
breeds chicken and produces various forms of poultry
meat, offers insightful information about business
workflow analysis and operational assistance.
None of the studies on coupling DTs with DLs
thus far has been concentrated on defining, linking,
and analyzing data used for process and data
modelling or computational enhancement through
approaches that alleviate the need for expert
knowledge. This paper addresses this challenge and
provides the means for a totally different user
experience based on visual querying and simulations,
which is characterized by simplicity, self-
explainability, ease of use and graphical ergonomics
by extending data and process blueprints.
3 METHODOLOGY
The basic idea for using visual analysis is to present
the data in a graphical and meaningful visual format
so that the end-user can interact with it, learn from it,
and make better decisions.
Enhancing Interaction with Data Lakes Using Digital Twins and Semantic Blueprints
355
As previously mentioned, the main target of this
paper is to utilize a DT in the form of a unified
graphical and interactive dashboard to retrieve data
from DLs based on their semantic annotation. This is
performed by: (1) extending the applicability of data
blueprints (SB, SEB, UB) and process blueprints
(MB, EB, PB) (see previous section) and executing
visual queries to deliver a graphical representation of
structured, semi-structured and unstructured data
retrieved from the DL based on their blueprint
metadata history; (2) introducing a new semantic part,
namely the Business Blueprint (BB), to describe the
business processes associated with the data and which
will guide more effectively the application of DT.
Figure 1 depicts the general architectural structure
upon which this approach builds, which involves four
distinct steps: (1) the definition of goals and how to
measure them, (2) the mechanism for data retrieval,
(3) the data processing procedures, and finally, (4) the
interactive dashboard, which offers decision support
simulations based on DTs using real-time data and
four analytical models. A description of each of the
steps follows:
Step 1: targets at enabling organizations to clearly
define their goals and determine how to measure their
progress towards those goals. This step essentially
provides a structured approach to help organizations
define their specific objectives and identify the
metrics that will be used to evaluate success.
Step 2: essentially offers the means for data
retrieval using latest advances on DLs that utilize
architectural patterns, or as we call it, data blueprints.
These blueprints provide the means for describing
and characterizing data sources and the data they
produce. The present paper, as mentioned earlier,
extends these characteristics by suggesting a new,
specialized form of a blueprint (BB) to support the
interaction with a DT. The BB blueprint describes
data properties revolving around manufacturing
processes, rules, constraints, thresholds (for
actuators) and actions (see Figure 2). To this end, we
introduce also a Data Dictionary, which includes data
properties, such as types, formats, units etc., and
describes attributes and characteristics of the current
data thus contributing to better understanding it and
enabling efficient retrieval and processing. Rules
combine constraints, actions and thresholds to
provide guidelines for data handling and decision-
making.
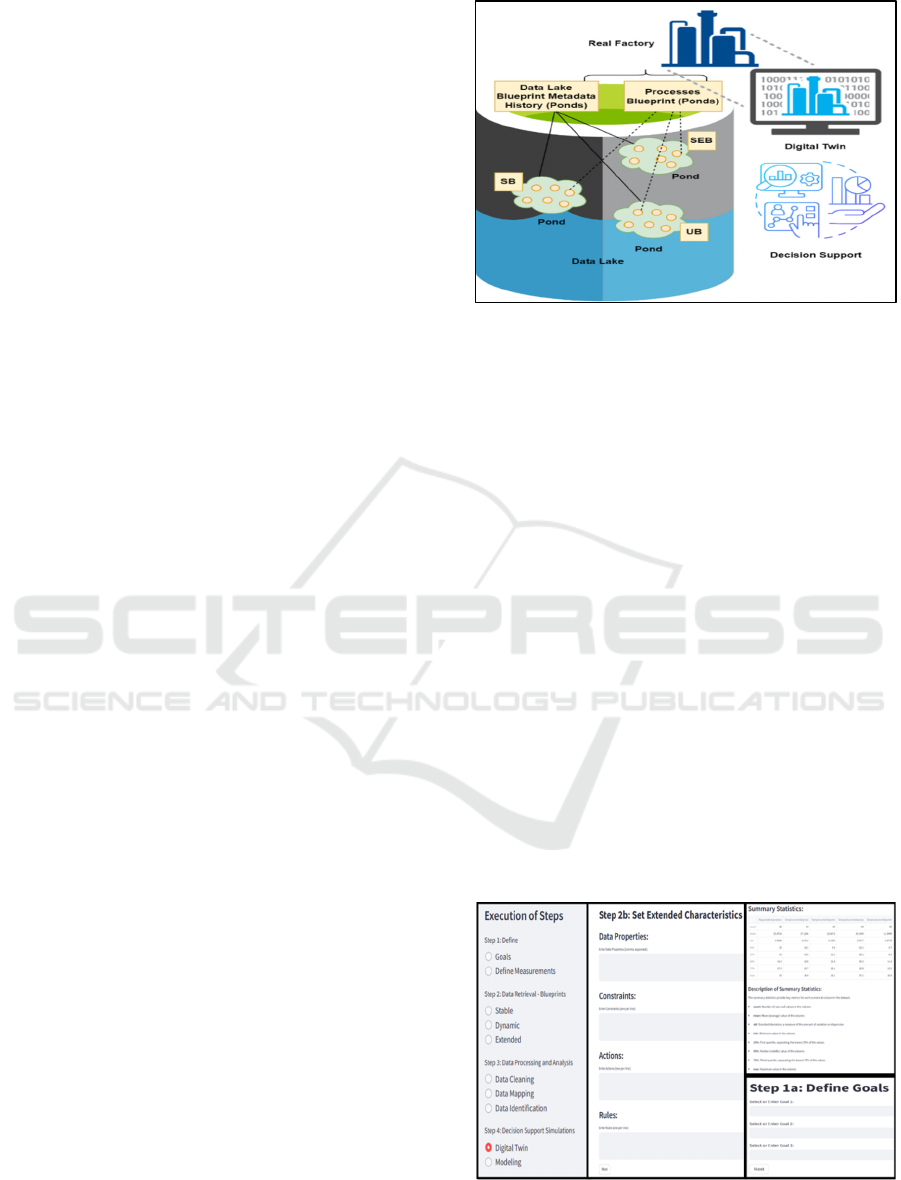
The DL architecture utilized in this paper is
structured with ponds and puddles as described in
(Pingos and Andreou, 2022). A dedicated data
blueprint is used to describe every source that stores
data in this DL, which is divided into two
Figure 2: DT with the utilization of BB.
interconnected parts, the “Stable Data Blueprint” and
the “Dynamic Data Blueprint”. The static one is
stable over the time and records the name and type of
the source, the type of data it produces, the value,
velocity, variety, and veracity of data source. The
dynamic characterizes the volume of data, the last
source update, and the keywords of the source which
are metadata characteristics may vary over time. A
manufacturing production cycle consists of
processes. Every process involves actions and events
which are executed by a machine. All this information
is described in a specific blueprint (Pingos and
Andreou, 2022).
The blueprint descriptions produce an RDF
ontology for the data sources written in XML format.
RDF stands for Resource Description Framework and
is used for describing resources usually found on the
Web. RDF is designed to be read and understood by
computer. The experiments that were conducted and
will be presented later on code implemented in
Python, while library rdflib was used for RDF
manipulation. RDF triples were created to extend the
data with additional characteristics.
Figure 3: Graphical Dashboard available tools.
ENASE 2024 - 19th International Conference on Evaluation of Novel Approaches to Software Engineering
356

Step 3: supports Data Fusion using three
techniques: (a) Data cleaning, (b) Data mapping, and
(c) Data identification.
Data Cleaning aims at identifying and addressing
errors, inconsistencies, and missing values in the
underlying dataset. By applying data cleaning
techniques, such as removing duplicate records and
filling missing values, the quality and accuracy of the
data is improved, ensuring also that the fused dataset
is consistent.
Data Mapping is the process of integrating data
from multiple sources based on common attributes.
This activity establishes relationships and
connections between datasets and confirms that the
combined dataset includes an accurate representation
of the topic, integrating relevant information from
various sources (e.g. function merge in Python).
Data Identification finds and extracts major
patterns, trends, and features from a dataset.
Therefore, useful information and insights may be
extracted from the fused data.
Overall, organizations can achieve efficient data
fusion by utilizing techniques such as data cleaning,
data mapping, and data identification. These
techniques guarantee the useful value, consistency,
and accuracy of the integrated dataset. The merged
data offers a solid base for additional investigation,
allowing organizations to collect perceptive
knowledge and make decisions (see next step).
Step 4 conducts simulations for data-driven
decision support. The DT concept, which offers a
virtual representation of the data, facilitates the
execution of such simulations and the interpretation
of their results. Four analytical models may then be
constructed, namely Describe, Diagnose, Prescribe,
and Predict, to interact with the fused data produced
in Step 3 during simulations. These models make use
of the underlying dataset to identify problems, predict
results, offer analytical insights and provide
recommendations. More specifically, each model
works as follows:
Describe Model: Aims to provide description of
the system and the fused data to represent the
elements, actions, and structure of the system.
Diagnose Model: Emphasizes on discovering and
investigating problems, anomalies, or special patterns
in the dataset. This model allows the identification of
the basic reasons behind observed actions or results.
Prescribe Model: Generates prescriptive
recommendations or actions based on meaningful
insights. It offers practical recommendations to guide
decision-making procedures.
4
https://paradisiotis.com/ (in Greek)
Predict Model: Forecasts or predicts future
behavior by using historical data and patterns. This
model uses predictive analytics methods, like
regression and time-series analyses, and machine
learning algorithms, using the fused data and thus
enables businesses to predict new developments.
Summing up, the proposed framework combines
retrieval and processing of large volumes of
structured, semi-structured, and unstructured data
residing in DLs with a graphical interactive
dashboard that offers DT-oriented simulations.
Employing RDF, Python, and data fusion methods,
the approach provides actions, constraints, thresholds
and rules, described in the form of a dedicated
blueprint architecture. Real-time analysis and
decision-making are then facilitated with the creation
of the Describe, Diagnose, Prescribe, and Predict
models, which provide the means for efficient and
accurate decision support.
4 DEMONSTRATION AND
EXPERIMENTATION
This section presents the practical application of the
proposed framework using real-world data collected
in the poultry meat factory of PARG
4
. The factory
breeds chicken in large capacity farms (20,000-
30,000 chicks per farm) with automated ventilation
and temperature systems, and a technologically
advanced mill for mixing ingredients and producing
chicken food. After a breeding cycle is concluded,
slaughtering takes place at the factory and the meat
produced is packaged with different ingredients
according to orders placed, which are then sent to
local supermarkets.
Figure 3 shows a collage of figures depicting
different screens of the graphical interactive
dashboard that was developed especially for the
purpose of demonstrating the proposed approach. The
dashboard essentially supports all steps of Figure 1
and offers DT capabilities. To this end, three real-
world scenarios were constructed in close
collaboration with engineers of the PARG factory to
show how the framework may be employed so as to
facilitate data-driven decision-making, enabling
PARG to extract valuable insights, optimize
processes, and enhance operational performance. The
scenarios correspond to decisions regarding the
ventilation process taking place within the breeding
farms with different approaches as regards efficient
control of inside temperature and energy
Enhancing Interaction with Data Lakes Using Digital Twins and Semantic Blueprints
357
consumption. More specifically, the three scenarios
investigated the optimal decision for lowering
temperature in a breeding site by increasing the
frequency of opening shutters, increasing the duration
shutters stay open, and using a hybrid form
combining the two. All scenarios were evaluated
against successfully achieving the goal (lowering
temperature), but at the same time energy
consumption and, hence cost, was taken into
consideration.
Step 1: Define
Options for predefined goals were available at this
step including “Reduce Cost”, “Improve Efficiency”
“Improve Quality”, “Reduce Waste”, “Optimize
Resource Usage”, “Lower/increase temperature”, etc.
The users selected control the temperature control
goal and set a specific (standard) breeding value for
the farm environment (33ºC). Then, the
measurements and sensors that correspond to these
goals were defined.
Step 2: Data Retrieval - Blueprints
Users stored relevant information in the DL based on
the scenario needs, such as sensor readings for grow
day 1… n (hourly for 24 hours), inside and outside
temperature (2 sensors), humidity, CO
2
, and static
pressure. Sources and data were semantically
annotated via the blueprints before being stored in the
DL. Furthermore, users entered data properties,
actions, constraints, and rules related to temperature
control using the above parameter readings (further
detailed information on related rules may not be
disclosed to secure business processes privacy).
Step 3: Data Processing and Analysis
Users were able here to choose various data analysis
tasks to execute using the uploaded data mainly
through tabular formats.
Step 4: Decision Support Simulations
This step provided users with an extensive set of tools
to profile, visualize, and actively manipulate
temperature-related data to support decision-making
related simulations. The system’s user-focused design
supports the main goal of utilizing a DT environment
for data-driven decision-making in farming
environments and enabled stakeholder1s to continually
refine their temperature control strategies based on
simulated scenarios and real-time insights. More
specifically, the following sub-steps were taken:
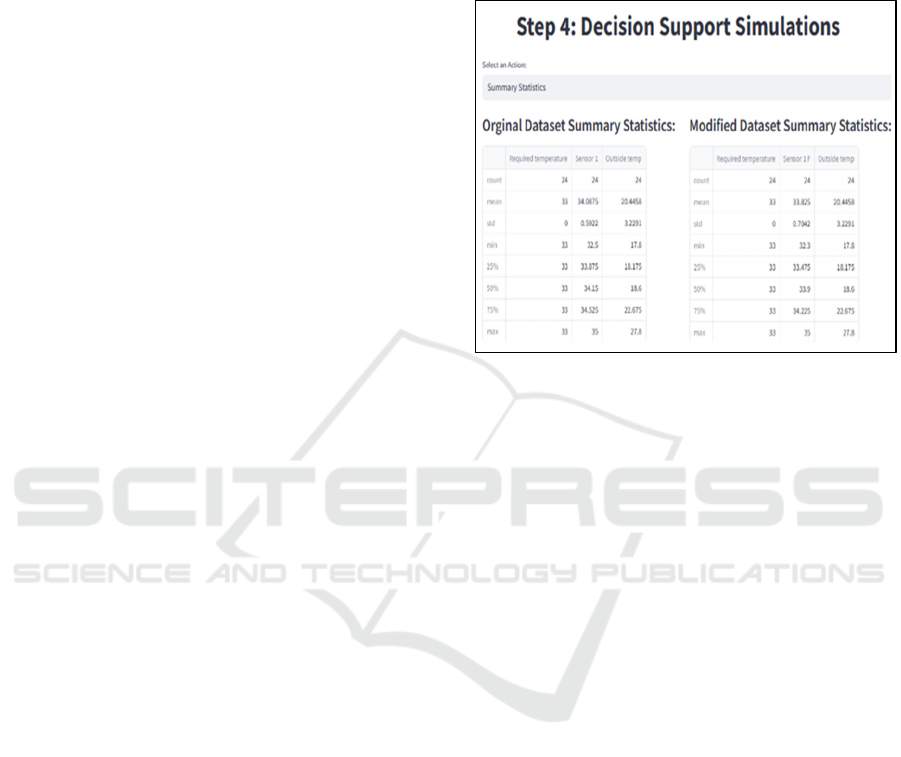
4.1 Profile Data
Users profiled the data to learn more about the
distribution, statistical measures, and important
features of the columns related to temperature (see
Figure 4, upper part, and lower left part).
Understanding the basic conditions and variability in
the farm environment was thus made easier by this
profiling.
Figure 4: Original vs modified summary statistics of data.
4.2 Edit Values
Users actively edited values within the selected data,
allowing for hypothetical scenarios and “what-if”
analyses. Using historical data, a temperature
coefficient was calculated by dividing the difference
of the inside temperature (before and after opening
the windows) with the time the windows remained
open. This coefficient was then used to estimate the
increase/decrease of temperature during simulations.
When users changed the value for the time windows
remained open, the relevant effect on temperature
was estimated based on the temperature coefficient
(see right column at the lower part of Figure 4).
4.3 Visualize Data
The system provided interactive data visualization
options, allowing users to create visual
representations of temperature-related variables. The
selected visualization types included bar charts, line
charts, and scatter plots, which enabled users to
identify patterns and trends in the data.
4.4 Perform Actions
Users employed various actions to simulate decision-
making scenarios. The handling of numerical
parameters, as in our case temperature, involves
filtering and focusing on specific attributes of the
data, using values that are “Greater than”, “Average”,
ENASE 2024 - 19th International Conference on Evaluation of Novel Approaches to Software Engineering
358
“Equal to”, “Less than or equal to”, and “Greater than
or Equal to”, etc. a key value. Adjustments performed
to the farm environment were triggered by studying
the behavior of the filtering based on average
temperature values and the corresponding changes in
temperature thresholds were observed as previously
described.
The main findings of the three scenarios may be
summarized as follows:
Scenario 1: Increased Frequency of Window
Openings
In this scenario, data is produced within the factory
mainly by two systems: CUBORA, which is a fully
operational heating control system requires for
securing the healthy growth and well-being of chicks
in the farms, and AGROLOGIC, which specializes in
the field of automated climate controllers, feeding
and weighing systems for the poultry. AGRO-LOGIC
in PARG is being integrated with Chore Time
controller and collects metrics from several remote
sensors that are distributed into the farms, such as
CO2, Temperature, Humidity, Air Static Pressure,
and Light Intensity Level. All metrics are recorded in
a database and are accessed through a Web
application in real-time. Furthermore, images of the
farms and/or equipment may be recorded for shift
managers to inspect visually when appropriate.
Finally, the system generates alerts if any of the
metrics exceed pre-defined thresholds via an
embedded GSM modem. The plant engineers, using
the framework capabilities described in Step 4,
decided to increase the frequency up to three times a
day and investigate the impact of this decision in the
simulated environment. It became evident that by
enabling more frequent ventilation the system
actively reacts to temperature average increases.
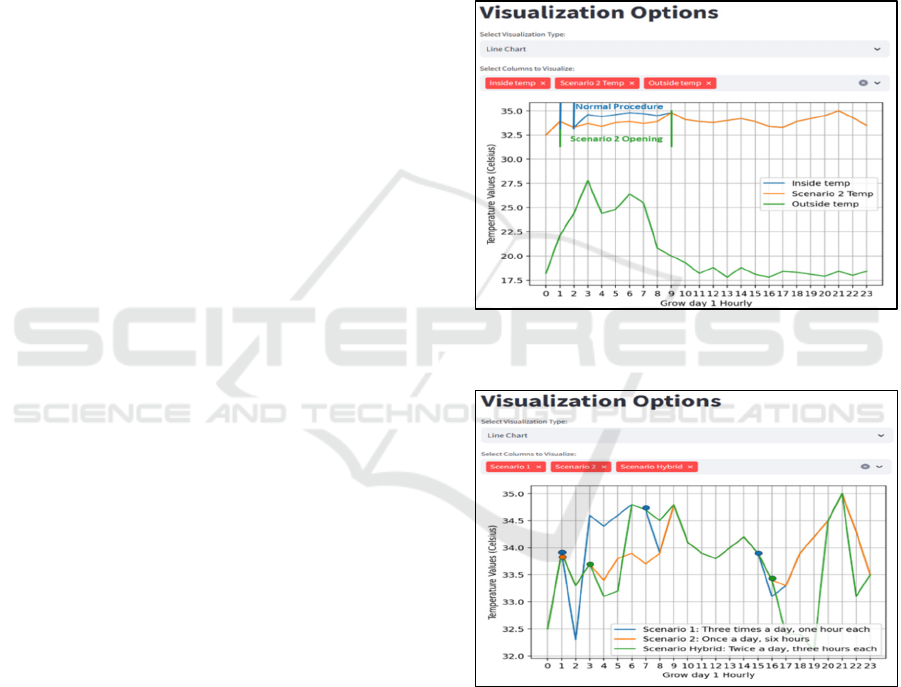
Scenario 2: Extended Duration of Window
Openings
The second scenario investigated the effects of
leaving the automated windows open for a longer
amount of time (6 hours) while keeping the daily
frequency stable (once). In Step 4, the users adjusted
the duration settings to allow longer air conditioning
times via the framework's user interface. Line charts
depicting temperature and statistical summaries were
consulted that highlighted the long-term cooling
impact on farming operations. Figure 5 graphically
depicts the outcome of this scenario (red color)
contrasted with the outside temperature (blue) and the
temperature achieved using the normal procedure
(oceanic blue). The figure also shows the time
windows remained open for the scenario and the
normal procedure (area within dotted lines).
Scenario 3: Hybrid Approach
This scenario combined longer duration more
frequently (twice a day for 3 hours each time). Again,
using step 4 the users interacted with the framework
to define that the system should automatically open
the windows more often than before and for a little
longer period. It became evident by using temperature
visualizations in the hybrid scenario that there exists
a complex relationship between frequency, duration,
and temperature. Figure 6 shows the performance of
each scenario tested with activation of windows
openings indicated by circles.
Figure 5: Behaviour of temperature based on window
opening duration (scenario 2).
Figure 6: Combined effects of all scenarios on temperature
values.
To optimize decision-making, the scenarios also
considered energy consumption effects. The
engineers evaluated the energy associated with each
scenario as follows: The normal daily temperature
control (NDTC) procedure involves opening
windows once and starting a roof fan 2-3 times for
some minutes. The purpose of the fan is to offer a
more drastic solution to increasing or decreasing
Enhancing Interaction with Data Lakes Using Digital Twins and Semantic Blueprints
359

temperature so as to guide it to the optimal value of
33ºC. More specifically, if outside conditions allow,
the temperature of the breeding site can be controlled
and brought to the optimal value using only the
windows. Otherwise, is actually the fan that regulates
the inside temperature. The fan, though, is a high
energy consumption device, and, therefore, it should
be used as little as possible. Each breeding cycle (50-
60 days) consumes 3250KWh of energy based on the
NDTC procedure. Using historical samples and
measurements in the past, an average daily energy
consumption was calculated, and this number was
distributed between the opening of the windows and
the operation of the fan with the support of site
engineers. These figures were then used to calculate
the energy cost of the decisions made according to the
frequency and duration of the windows opening
according to each scenario.
Based on the above, the engineer confirmed that
all three scenarios were able to improve temperature
and drive it close to the standard, desired value for the
breeding site, which, as previously mentioned, should
be 33 degrees Celsius. Scenario 1 lowers temperature
from 34.08ºC to 33.83ºC, scenario 2 to 33.82ºC and
scenario 3 to 33.39ºC. However, taking into account
the energy consumption, scenario 1 has the lowest
daily consumption but the highest average
temperature, scenario 2 has almost the same
temperature but higher energy consumption and,
finally, the hybrid scenario (#3) yields the best
average temperature and lower consumption
compared to the normal average daily consumption
but not the lowest among the three scenarios tested
(see Figure 6). However, the engineer chose to apply
the hybrid scenario in the real-world as he advocated
in favor of achieving the best possible temperature in
the plant at the cost of a slight increase in energy
consumption.
5 CONCLUSIONS
The paper proposed a framework which utilizes a
dedicated semantic enrichment mechanism that uses
data blueprints to facilitate interaction with DLs,
offering at the same time DT capabilities. The
framework is able to tackle successfully the
complexity present in real-time storing of high-
frequency data and offers data-driven user interaction
to support simulations and decision making.
Without requiring extensive technical knowledge,
the framework assists users to efficiently locate and
retrieve information from large data sets and convert
raw data into meaningful data. The proposed
approach is divided into a series of steps with which
organizations can enhance data processing and
analysis and be able to study the effects of possible
actions in a controlled, simulated environment.
The applicability of the framework was
demonstrated using a real-world case-study
conducted in a poultry meat factory. Three scenarios
were created and tested regarding the control of
temperature in breeding farms using automatic
ventilation systems that open windows and/or start
the operation of large ceiling fans. The scenarios were
evaluated in terms of successfully controlling the
current inside temperature and keeping energy
consumption at acceptable levels. The stakeholders-
engineers of the factory were quite satisfied and
highly appreciated the support they received during
simulations as they were able to differentiate between
the optimal case they would like to apply in reality.
Future work will focus on three axes: The first is
to explore further functional aspects of the DT
offering better services and more graphical tools and
visual representations of the data. The second is to
extend the interaction with users by enhancing the
visual querying part of the dashboard developed via
game engines, such as Unreal and Unity, and
providing a more gamified experience which will
further ease the processing and analysis of the data.
Finally, the third axis will revolve around exploring
different forms of DLs and data formats to investigate
how different sources of data and formats affect the
applicability of the proposed approach.
REFERENCES
Azvine, B., Cui, Z., Nauck, D. D., & Majeed, B. (2006).
Real time business intelligence for the adaptive
enterprise. CEC/EEE 2006 Joint Conferences,
2006(June 2014), 29. https://doi.org/10.1109/CEC-
EEE.2006.73
Fuller, A., Fan, Z., Day, C., & Barlow, C. (2020). Digital
Twin: Enabling Technologies, Challenges and Open
Research. IEEE Access, 8, 108952–108971.
https://doi.org/10.1109/ACCESS.2020.2998358
Gupta, S., Bag, S., Modgil, S., Beatriz Lopes de Sousa
Jabbour, A., & Kumar, A. (2022). Examining the
influence of big data analytics and additive
manufacturing on supply chain risk control and
resilience: An empirical study. Computers and
Industrial Engineering, 172(PA), 108629. https://doi.
org/10.1016/j.cie.2022.108629
Hariri, R. H., Fredericks, E. M., & Bowers, K. M. (2019).
Uncertainty in big data analytics: survey, opportunities,
and challenges. Journal of Big Data, 6(1).
https://doi.org/10.1186/s40537-019-0206-3
ENASE 2024 - 19th International Conference on Evaluation of Novel Approaches to Software Engineering
360

Kritzinger, W., Karner, M., Traar, G., Henjes, J., & Sihn,
W. (2018). Digital Twin in manufacturing: A
categorical literature review and classification. IFAC-
PapersOnLine, 51(11), 1016–1022. https://doi.org/
10.1016/j.ifacol.2018.08.474
Pang, L. Y., Zhong, R. Y., Fang, J., & Huang, G. Q. (2015).
Data-source interoperability service for heterogeneous
information integration in ubiquitous enterprises.
Advanced Engineering Informatics, 29(3), 549–561.
https://doi.org/10.1016/j.aei.2015.04.007
Rasheed, A., San, O., & Kvamsdal, T. (2020). Digital twin:
Values, challenges and enablers from a modeling
perspective. IEEE Access, 8, 21980–22012.
https://doi.org/10.1109/ACCESS.2020.2970143
Pingos, M., & Andreou, A. S. (2022). Exploiting Metadata
Semantics in Data Lakes Using Blueprints. In
International Conference on Evaluation of Novel
Approaches to Software Engineering, 220-242. Cham:
Springer Nature Switzerland.
Pingos, M., & Andreou, A. S. (2022). A Smart
Manufacturing Data Lake Metadata Framework for
Process Mining. The Nineteenth International
Conference on Software Engineering Advances
ICSEA, 11.
Pingos, M., Christodoulou, P., & Andreou, A. (2022, July).
DLMetaChain: An IoT Data Lake Architecture Based
on the Blockchain. In 2022 13th International
Conference on Information, Intelligence, Systems &
Applications (IISA), 1-8. IEEE.
Enhancing Interaction with Data Lakes Using Digital Twins and Semantic Blueprints
361
