
The Impacts of Environmental Context on Technology Adoption and
Their Invariance Analysis in Chinese Supply Chains
Zengwen Yan
1
and Kaining Ge
2
1
School of Intelligent Finance and Business, Xi’an Jiaotong Liverpool University, Suzhou, China
2
Management School, University of Liverpool, Liverpool, U.K.
Keywords: Technology Adoption, Regulatory Environment, Business Innovation Environment, Technology Performance,
Technology–Organisation–Environment Framework.
Abstract: Industry 4.0 technologies are increasingly used by corporations worldwide, but their successful adoption
remains problematic. In particular, the manufacturing and logistics industries in China have achieved more
promising outputs, supported by the adoption of emerging technologies in their supply chains. It is important
to research whether environmental context provides a conducive atmosphere for the corporate adoption of
these technologies. The study employs structural equation modelling (SEM) with data collected through 1,441
questionnaires from the manufacturing and related industries across mainland China. This paper focuses on
and discusses how environmental context affects technology adoption (TA) and post-performance based on
the technology–organisation–environment (TOE) framework. The study finds that in China, the regulatory
environment (RE) does not directly affect technology adoption and performance (TAP); rather, the business
innovation environment (BIE), greatly affected by the RE, influences TAP. This study enriches the content
on environmental context, examines the robustness and generalizability of the results.
1 INTRODUCTION
In the contemporary landscape of global industry and
technology, the concept of 'Industry 4.0' emerges as a
pivotal force reshaping the dynamics of production
and supply chain management. Xu et al. (2018)
posited that the ‘Industry 4.0 project is considered a
major endeavour for Germany to establish itself as a
leader of integrated industry’; achieving this goal
predominantly hinges on technology adoption (TA),
which is still in its nascent stages. This necessity is
widely recognized across industries, especially in
manufacturing and logistics, to maintain continuous
production and reliable supply chains amid economic
uncertainties. Digital transformation through TA
enhances supply chain resilience and visibility
(Narwane et al., 2023), highlighting TA's importance
in reducing risks and losses.
This study initiates its examination of TA in
supply chains through a technology–organisation–
environment (TOE) framework, identifying gaps
from existing literature. Notably, the research on TA's
environmental contexts is limited (Lin, 2014),
somewhat vague and broad, despite extensive studies
on its organizational and technological aspects (Yeh
and Chen, 2018). This research, therefore, focuses on
the environmental dimension of TOE. Second, it
highlights the scant attention to environmental
factors, especially the regulatory environment (RE), a
crucial and original TOE element impacting TA and
performance (TAP) that has been overlooked for
years (Schwarz and Schwarz, 2014; Yeh and Chen,
2018). This paper aims to bridge this gap by focusing
on RE, comparing it with the business innovation
environment (BIE) regarding TAP (Zhu et al., 2003).
Last, it addresses the call for testing findings from
developed economies in developing ones, examining
Chinese enterprises to glean insights into TA within
the Chinese context, responding to calls for broader
geographic research applicability (Adomako and
Danso, 2014).
2 LITERATURE REVIEW
2.1 Theoretical Background
The TOE framework developed by Tornatzky et al.
(1990) is commonly used, with the aim of facilitating
104
Yan, Z. and Ge, K.
The Impacts of Environmental Context on Technology Adoption and Their Invariance Analysis in Chinese Supply Chains.
DOI: 10.5220/0012622200003717
Paper published under CC license (CC BY-NC-ND 4.0)
In Proceedings of the 6th International Conference on Finance, Economics, Management and IT Business (FEMIB 2024), pages 104-111
ISBN: 978-989-758-695-8; ISSN: 2184-5891
Proceedings Copyright © 2024 by SCITEPRESS – Science and Technology Publications, Lda.
the adoption of technological innovations; its
technological, organisational and environmental
contexts were identified to ascertain whether a firm
can successfully implement a technological
innovation. Besides, the TOE framework, with a
validated theoretical foundation, provides valuable
insights for TA across companies, consistent
empirical studies support the usefulness of the TOE
framework and it is argued that environmental
context contributes more to the adoption of
information technology than technological and
organisational contexts (Pan and Jang, 2008). The
environmental context refers to the external situations
a corporation may encounter, for example, the
government’s regulatory policies, the BIE created by
the local community and the corporation’s industry
competitors (Tornatzky et al., 1990).
2.2 Environmental Context of the
Technology‒Organisation‒
Environment Framework
Prior research on environmental context lacks clarity
(Schwarz and Schwarz, 2014). RE significantly
impacts TAP, with mixed findings on its effect. Zhu
and Kraemer (2005) found that government
regulations play a key role in encouraging firms to
adopt new technologies, with supportive regulations
or business laws providing incentives and fostering
trust in e-business. In China, governmental
regulations and support notably shape business
operations, and in emerging markets, the blend of
Information Technology adoption and political ties
greatly affects firms' performance (Luo et al., 2023).
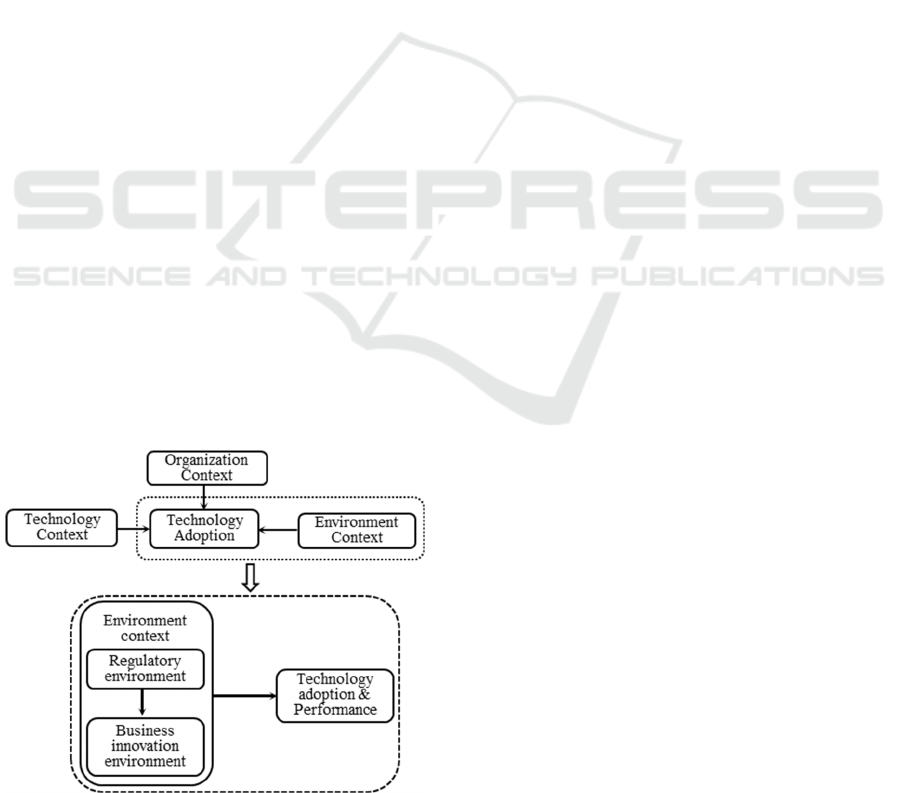
Thus, enhancing understanding of the environmental
context's role in TA is a primary goal of this research,
as depicted in Figure 1.
Figure 1: Focus and potential contribution of this study.
3 HYPOTHESIS DEVELOPMENT
3.1 Regulatory Environment and
Business Innovation Environment
From a broad perspective, the notion of RE should
encompass the political climate and governance
authority, as well as policy matters of a region.
Enhancing the RE in the marketplace establishes
institutional protections for BIE, safeguarding their
accomplishments and economic gains. This, in turn,
boosts their innovative drive, with the enhancement
of RE seen as pivotal for the BIE's survival and
growth (Li et al. 2023). Opara et al. (2017) found that
the RE significantly influences the BIE in Alberta,
Canada, highlighting that political leadership and a
supportive policy milieu are essential for a thriving
BIE. The RE is deemed crucial for BIE to secure a
competitive edge, especially benefiting from robust
public safety and security, intellectual property rights
protection, and an efficient judicial and legal
framework. These factors help minimize the BIE's
regulatory compliance costs and waste.
Generally, regulations contain strong controlling
purposes of facilitating new targets—innovation
being core among these—but the link between the RE
and the BIE is indirect because it depends on the types
of regulations and targets, which is reflected in the
study of the livestock industry by Lin et al. (2023). A
business-friendly RE allows an innovation
environment to incubate and hatch because
government activities pave the way for innovation by
preparing a suitable external context, for instance,
firms in countries with flexible employment laws
raise a competitive edge over those in stricter
regulatory nations, affecting the easiness of access to
credit (Moro et al., 2022); as the BIE is rooted in the
RE.
H1: The more friendly and welcoming the RE, the
more dynamic the BIE.
3.2 Regulatory Environment and
Technology Adoption and
Performance
Prominent studies have concluded that TA is shaped
by three sets of factors, one of which is regulatory
policies. The influence of the RE on TA is significant
and the level of TA is consistent with specific
regulatory policies (Javier and Frank, 2006). In fact,
TAP is encouraged by regulatory incentives,
indicating that advanced technology is important for
corporations in many ways, but is still not widespread
The Impacts of Environmental Context on Technology Adoption and Their Invariance Analysis in Chinese Supply Chains
105
for several reasons.
Kobos et al. (2018) claimed that a connection
exists between regulatory constraints and TA,
although the effects created by regulatory factors vary
with the nature of each technology. Wang and Feeney
(2016) adopted a stakeholder perspective to explore
the regulatory behaviours of government, arguing that
a positive connection exists between the RE and TAP,
and that government and corporations share common
interests as external and internal stakeholders,
respectively. Opara et al. (2017) argued that political
support contributes to TAP in Alberta, with
government policies in that area playing the key role
in TAP. Ouyang et al. (2019) empirically tested the
supportive role of TA regulations in the hotel industry
and found that the effect of such regulations may vary
in size and scale. Peng et al. (2023) highlight the vital
role of policies supporting IT capabilities,
differentiated green innovation, and environmental
regulations in boosting green tech innovation and
corporate performance. Thus, the regulative
institutions are the primary stimulus for corporations
concerning their technology-related activities.
H2a: There is a positive relationship between a
well-regulated environment and TAP.
3.3 Business Innovation Environment
and Technology Adoption and
Performance
Innovation plays a pivotal role in giving corporations
a competitive advantage, both in the external business
environment and in their internal innovation
capability (Damanpour and Schneider, 2006). The
BIE reflects changes in customer needs and future
trends for business in relation to improving
technological capability—the BIE is closely related
to the adoption and performance of technology
because there is a high degree of uncertainty
associated with corporations’ potential success (Tidd,
2001). Indeed, complexity and uncertainty affect
organisational structure and intentions for TA.
Prajogo and Ahmed (2006) argued that to enable TA,
an active business context is required to incorporate
practices for implementation and this context
represents the enabling stimulus factor for TA.
Corporations operate within a certain environmental
context, the impulses of which lead them to further
innovation, including TA. TAP responds to the BIE,
which offers opportunities and resources—such as
information and technology—and constraints, such as
regulations and restrictions. Khanagha et al. (2013)
argued that an ideal BIE should provide appropriate
learning patterns and sufficient competences and
resources, which can contribute to TA. Similarly,
Persico et al. (2014) contended that providing a
platform is essential to introducing technology, and
changes should be gradual to achieve long-lasting
effects. Corporations in a high-level BIE are more
likely to introduce technology and obtain the
expected performance (Pan and Jang, 2008).
H2b: The BIE is positively related to TAP for
corporations, and the openness and dynamics of
innovation in the business environment contribute to
corporations being more likely to adopt technology
and achieve better technological performance.
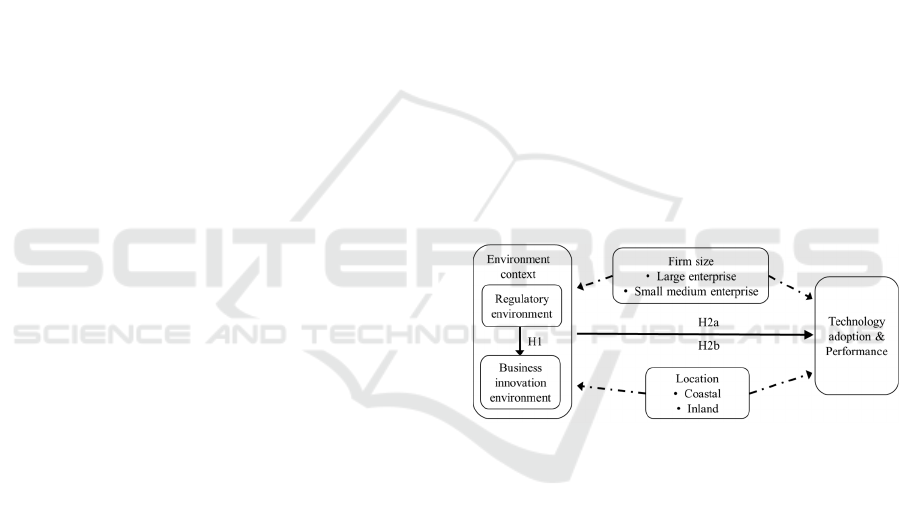
3.4 Conceptual Model
Apart from verifying the impacts of RE on TAP, and
examining the influence of BIE on TAP, this study
also investigates the generalisability and applicability
of the improvements it has made to the TOE
framework. Given that all the hypotheses are
supported, whether the indicators of each construct
and the model are applicable in different contexts
remains doubtful. Thus, this study also conducts an
invariance analysis from the perspectives of firm size
and location. Figure 2 displays these relationships
within the conceptual model.
Figure 2: Conceptual model.
4 RESEARCH DESIGN
4.1 Measurements Development and
Data Collection
This study applied the existing scales of Zhao (2018)
as the framework and then adapted the items to
measure the RE (Adomako and Danso, 2014), the
BIE (Zhu and Kraemer, 2005) and TAP (Zhu and
Kraemer, 2005; Xu et al., 2018). New measurements
were developed as well based on the authors’
understanding of the constructs concerning the
Chinese cultural context and on observations made
during interviews and firm visits. Data were collected
from municipalities and provincial cities across
mainland China for comprehensiveness. 1,441
FEMIB 2024 - 6th International Conference on Finance, Economics, Management and IT Business
106
corporations were studied, and a key informant from
each corporation was identified to complete the
questionnaire, who ensured the information about the
internal and external processes was reliable and
insightful.
4.2 Reliability and Validity
The research model was tested using structural
equation modelling (SEM) with Amos 24.0, a
covariance-based SEM. Considering the nature of this
study, the covariance-based SEM was the preferred
technique for theory testing and development, as
indicated by Fornell and Bookstein (1982). For the
TAP construct, the study adopted a second-order
mode in the measurement model. In the following two
subsections, five representative technology
constructs in the first-order measurement model—
automation technology (AT), the information
management system (IMS), the Internet of Things
(IoT), big data (Data) and the logistics platform
(Plat)—are analysed along with the RE and BIE
constructs; the third subsection discusses the second-
order TAP construct.
4.2.1 Reliability Analysis
Construct reliability refers to the degree to which
items are free from random errors and, as a result,
yield consistent results. According to the criteria
suggested by Hair et al. (2010), squared multiple
correlations (SMCs) should be greater than 0.36 to
indicate the reliability of each item for the latent
Table 1: Presents the reliability results for each construct.
SMC CR SMC CR
BIE
BIE1 .643 .836
RE
RE1 .480 .847
BIE2 .494 RE2 .527
BIE3 .533 RE3 .646
BIE4 .575 RE4 .674
AT
AT1 .830 .938
IMS
IMS1 .803 .891
AT2 .806 IMS2 .671
AT3 .865 IMS3 .721
IoT
IoT1 .835 .919
Data
Data1 .891 .949
IoT2 .762 Data2 .929
IoT3 .774 Data3 .764
Plat
Plat1 .856 .928
Plat2 .806
Plat3 .769
variable. The values of SMC in the measurement
model were all greater than this suggested limit.
Further, composite reliability (CR) was analysed
following Hair et al.’s (2010) suggestion that the CR
value be greater than 0.7 to indicate reliable and
consistent data within the same construct (Straub,
1989).
4.2.2 Construct Validity
Straub (1989) argued that successive stages of
refinement are necessary for developing an
appropriate measurement model. Confirmatory factor
analysis was employed to examine construct validity,
with two types of validity assessed. Convergent
validity examines consistency across multiple
operationalisations (Bagozzi et al., 1991). Here, all
standardised factor loadings (Std) ranged between 0.6
and 0.95 and were significant (p < 0.001), strongly
supporting good convergent validity for each
construct. The average variance extracted (AVE)
(Fornell and Larcker, 1981) was applied to further
confirm convergent validity. The AVE value of each
construct should exceed the threshold value of 0.5
(Hair et al., 2010).
Table 2: Convergent validity results for the BIE, RE, and
technology constructs.
Std AVE Std AVE
BIE
BIE1 .802 .561
RE
RE1 .693 .582
BIE2 .703 RE2 .726
BIE3 .730 RE3 .804
BIE4 .758 RE4 .821
AT
AT1 .911 .834
IMS
IMS1 .896 .732
AT2 .898 IMS2 .819
AT3 .930 IMS3 .849
IoT
IoT1 .914 .790
Data
Data1 .944 .861
IoT2 .873 Data2 .964
IoT3 .880 Data3 .874
Plat
Plat1 .925 .810
Plat2 .898
Plat3 .877
Discriminant validity compares the square root of the
AVE of a particular construct with the correlation
between that construct and other constructs. The
value of the square root of the AVE should be higher
than the correlation (Henseler et al., 2015).
The Impacts of Environmental Context on Technology Adoption and Their Invariance Analysis in Chinese Supply Chains
107

Table 3: Discriminant validity of each construct.
AVE BIE RE Data Plat AT IoT IMS
BIE .561 .749
RE .582 .744 .763
Data .861 .103 .100 .928
Plat .810 .129 .139 .538 .900
AT .834 .123 .074 .362 .329 .913
IoT .790 .110 .094 .453 .531 .420 .889
IMS .732 .058 .083 .436 .617 .335 .557 .856
4.2.3 Rationality of Second-Order Construct
The structure of TAP as a second-order construct was
described above. The paths from the TAP construct to
four of the five first-order constructs were of high
magnitude and significance, according to the
suggested limit of 0.7 (Chin, 1998). For the AT
construct, the value was quite close to 0.5: the value
suggested by Hair et al. (2010) as acceptable. Marsh
and Hocevar (1988) proposed that the efficacy of the
second-order model be evaluated through the target
coefficient (t-ratio) with an upper bound of 1, which
is the outcome of the chi-square division between the
first- and the second-order constructs. The t-ratio of
the proposed model was 0.964, which isreasonably
close to 1. This result indicates that the second-order
construct captured the key connections among the
first-order constructs (Stewart and Segars, 2002). As
a result, on both theoretical and empirical grounds,
the conceptualisation of TAP as a higher-order and
multidimensional construct was justified. In addition,
reliability and validity issues for the second-order
construct were examined. Table 4 summarises all
relevant results.
Table 4: Reliability and validity: TAP construct.
P Std SMC CR AVE
TAP
IMS 0.700 0.490 0.789 0.433
IoT *** 0.695 0.483
AT *** 0.478 0.228
Plat *** 0.744 0.554
Data *** 0.640 0.410
Note: ***
p
< 0.001
4.3 Model Fitness
The Goodness-of-Fit Index (GFI) and its adjusted
version (AGFI), which corrects for the number of
indicators per latent variable, assess model fit by
comparing the proposed model to observed data, with
values above 0.9 indicating acceptability (Hooper et
al., 2008). Similarly, the Comparative Fit Index (CFI)
evaluates model discrepancy, considering sample
size, with values closer to 1 suggesting a better fit;
this study's model showed a CFI of 0.98, denoting a
good fit (Teo & Khine, 2009). The Root Mean Square
Error of Approximation (RMSEA) addresses sample
size issues, aiming for values under 0.08 for
acceptable fit; the model achieved 0.04 (Hooper et al.,
2008; Hair et al., 2010). Lastly, a Chi-square to
degrees of freedom ratio between 1 and 5, as seen
with 3.325 in this study, signifies a good fit without
overfitting (James, 1987). All indices confirmed the
model's adequacy.
Table 5: Summary statistics of model fitness.
Chi-square 206.165 GFI 0.978
Degree of freedom 62.000 AGFI 0.968
Chi-square/DF 3.325 CFI 0.98
P value < 0.000 RMSEA 0.04
Standardised RMR 0.0302
5 DISCUSSION
5.1 Results
5.1.1 Conceptual Model Results Analysis
A correlation analysis of the data for possible
relationships among variables has been conducted,
the results in Table 6 reveal that RE is positively
related to BIE (p < 0.001) and significantly influences
BIE, supporting H1: a friendly and welcoming RE
leads to a dynamic BIE, and the more friendly and
welcoming the RE, the more dynamic the BIE. In
examining the effects of the RE and the BIE on TAP,
the quantified data show different results. For the
relationship between RE and TAP, H2a is rejected (p
= 0.202), indicating no significant effect of RE on
TAP in China, challenging common beliefs about
RE's importance in business across Mainland China.
That is, the present study found no direct effects on
this relationship. For the relationship between the BIE
and TAP, the significance value was p = 0.044, thus
supporting H2b at the 95% confidence level. This
implies that the BIE is positively related to TAP for
corporations, and the openness and dynamics of
innovation in the business environment contribute to
corporations being more likely to adopt technology
and achieve better technological performance.
FEMIB 2024 - 6th International Conference on Finance, Economics, Management and IT Business
108

Table 6: Results of hypotheses.
RE BIE *** H1 Supported
RE TAP 0.202 H2a Rejected
BIE TAP 0.044* H2b Supported
Note: * p < 0.05, *** p < 0.001
5.1.2 Robustness Analysis
There might be other factors affecting the results if
the dataset were changed. Thus, the authors re-
categorised the data into sub-groups, as per features
of the data used for analysis, and selected one sub-
group to run the SEM again to test the robustness of
the above results. No significant difference was found
(Table 7) between the re-categorised data and the
above results proving the reliability of the results.
Table 7: Results of re-categorised data (coastal area).
RE BIE *** H1 Supported
RE TAP 0.841 H2a Rejected
BIE TAP 0.011* H2b Supported
Note: * p < 0.05, *** p < 0.001
To explore the generalisability of the conceptual
model in this study to other contexts, the authors
further conducted multi-group invariance analysis in
the aspects of firm size and location. Given that the
conceptual model can be replicable in each context, a
comparison of multi-group SEMs was carried out.
Byrne (2016) noted the importance of factor loadings,
covariances, and structural regression paths in
evaluating the model’s relevance for multi-group
equivalence, with results detailed in Table 8. The
model's fit was confirmed using CMIN/DF, AGFI,
CFI, and RMSEA metrics.
To test the invariance of multi-group SEMs, the p
value, ΔCFI, and ΔTLI are key, the latter two are
frequently employed to assist with the judgment of
invariance results. Despite the p value's limitations,
Little (1997) and Cheung and Rensvold (2002)
highlighted ΔTLI ≤ 0.05 and ΔCFI ≤ 0.01 as
indicators of invariance to be supported, respectively.
Table 8 shows the values of p, ΔCFI and ΔTLI
confirm the invariance of multi-group SEMs in the
context of the firm location. As for the context of the
firm size, though the p-value is significant and rejects
the invariance from a statistical perspective, the
values of ΔCFI and ΔTLI support the invariance of
multi-group SEMs in the context of firm size.
Therefore, the study supports the conceptual model's
invariance and general applicability.
Table 8: Fit goodness and comparison of multi-group
invariance results.
Model CMIN DF CMIN/DF AGFI CFI RMSEA P ΔCFI ΔTLI
Large
vs.
SMEs
Baseline 279.902 127 2.204 0.958 0.979 0.029
Measurement
weights
329.217 137 2.403 0.955 0.973 0.031 *** −0.006 0.004
Structural
covariances
330.552 138 2.395 0.955 0.973 0.031 0.248 0 0
Structural
residuals
348.930 140 2.492 0.952 0.971 0.032 *** −0.002 0.002
Coastal
vs.
Inland
Baseline 296.148 127 2.332 0.956 0.976 0.030
Measurement
weights
301.629 137 2.202 0.958 0.977 0.029 0.857 0.001 −0.003
Structural
covariances
304.861 138 2.209 0.958 0.977 0.029 0.072 0 0
Structural
residuals
305.282 140 2.181 0.959 0.977 0.029 0.81 0 −0.001
Note: *** p < 0.001
5.2 Managerial Implications
Municipal governments should use emerging
technologies to boost city competitiveness and
innovation, fostering business growth and supply
chain development. Government should act as a
service provider, supporting a BIE and using online
platforms for enterprise services. Industry
associations mediate between government and
businesses, influencing policy for a dynamic business
climate. For technology startups, easy access to
venture capital, local education, and industry
associations support technology implementation and
innovation. Information platforms also play a crucial
role in TAP. This study offers insights for
policymakers, industry associations, investors,
corporate management, and professionals on using
emerging technologies to enhance operational
efficiency and innovation, benefiting both
government and industry by understanding TAP's
impact.
5.3 Theoretical Implications
This study reveals three key theoretical implications
of testing a conceptual model. Firstly, it shows that
TA in supply chains, especially in China, is driven by
external corporate environments and faces challenges
in practical implementation due to the gap between
research and industry practices. It highlights the
reluctance in adopting new technologies due to
uncertain outcomes. This study provides successful
TAP evidence and increases corporations’ confidence
in implementing emerging technologies in their
supply chains. Secondly, it contributes to the TOE
framework by focusing on the environmental
context's role in TA, a previously underexplored area,
and distinguishes between regulatory and business
environmental impacts on TA in Chinese supply
chains. Further, it suggests a new direction for
analysing the BIE as the root cause of TAP. Lastly,
The Impacts of Environmental Context on Technology Adoption and Their Invariance Analysis in Chinese Supply Chains
109

it applies findings from developed contexts to
developing ones like China, showing that Chinese
corporations are affected by government policies
similarly to those in mature economies, suggesting a
shift towards a more mature market economy in
China. This challenges traditional views and
emphasizes the evolving role of government
regulations in supporting corporate needs in China.
6 CONCLUSIONS
Based on the TOE framework, this study adds to the
literature by examining how environmental factors
impact TAP from an environmental viewpoint. It
finds a connection between the RE and BIE, offering
a fuller view of TAP adoption in Chinese supply
chains before and after. To prevent TA failure,
companies need to fully assess their environments
since RE doesn't directly affect TAP success. Instead,
BIE, stemming from RE, plays a key role in whether
firms can successfully adopt new technologies to
boost performance. As emerging technologies are
complex, their application in production needs
ongoing focus to better TA effectiveness, lower
failure rates, enhance performance, and increase
competitiveness.
Due to length constraints, more details on
measurement development, sample and data
collection, and numerical analysis results can be
provided by contacting the authors for those
interested.
REFERENCES
Adomako, S. and Danso, A. (2014), “Regulatory
environment, environmental dynamism, political ties,
and performance: study of entrepreneurial firms in a
developing economy”, Journal of Small Business and
Enterprise Development, Vol. 21 No. 2, pp. 212–30.
Bagozzi, R. P., Youjae, Y. and Phillips, L. W. (1991),
“Assessing construct validity in organizational
research”, Administrative Science Quarterly, Vol. 36
No. 3, pp. 421–58.
Byrne, B. M. (2016), Structural equation modeling with
Amos: basic concepts, applications, and programming,
3rd edn, Routledge, New York, NY.
Cheung, G. W. and Rensvold, R. B. (2002), “Evaluating
goodness-of-fit indexes for testing measurement
invariance”, Structural Equation Modeling, Vol. 9, pp.
233–55.
Chin, W. W. (1998), “Issues and opinion on structural
equation modeling”, MIS Quarterly, Vol. 22 No. 1, pp.
vii–xvi.
Damanpour, F. and Schneider, M. (2006), “Phases of the
adoption of innovation in organizations: effects of
environment, organization and top managers”, British
Journal of Management, Vol. 17 No. 3, pp. 215–36.
Fornell, C. and Bookstein, F. L. (1982), “Two structural
equation models: LISREL and PLS applied to
consumer exit-voice theory”, Journal of Marketing
Research, Vol. 19 No. 4, pp. 440–52.
Fornell, C. and Larcker, D. F. (1981), “Evaluating structural
equation models with unobservable variables and
measurement error”, Journal of Marketing Research,
Vol. 18 No. 1, pp. 39–50.
Hair, J. F., Black, W. C., Babin, B. J., Anderson, R. E. and
Tatham, R. L. (2010), Multivariate data analysis: a
global perspective, Pearson-Hall International, Upper
Saddle River, NJ.
Henseler, J., Ringle, C. M. and Sarstedt, M. (2015), “A new
criterion for assessing discriminant validity in variance-
based structural equation modeling”, Journal of the
Academy of Marketing Science, Vol. 43 No. 1, pp. 115–
35.
Hooper, D., Coughlan, J. and Mullen, M. (2008),
“Structural equation modelling: guidelines for
determining model fit”, Electronic Journal of Business
Research Methods, Vol. 6 No. 1, pp. 53–60.
James, C. A. (1987), “An approach for confirmatory
measurement and structural equation modeling of
organizational properties”, Management Science, Vol.
33 No. 4, pp. 525–41.
Javier, C. and Frank, W. (2006), “Information technology
adoption and political regimes”, International Studies
Quarterly, Vol. 50 No. 4, pp. 911–33.
Khanagha, S., Volberda, H., Sidhu, J. and Oshri, I. (2013),
“Management innovation and adoption of emerging
technologies: the case of cloud computing”, European
Management Review, Vol. 10 No. 1, pp. 51–67.
Kobos, P. H., Malczynski, L. A., Walker, L. T. N., Borns,
D. J. and Klise, G. T. (2018), “Timing is everything: a
technology transition framework for regulatory and
market readiness levels”, Technological Forecasting
and Social Change, Vol. 137, pp. 211–25.
Li, X., Tang, J. and Huang, J. (2023) ‘Place-based policy
upgrading, business environment, and urban
innovation: Evidence from high-tech zones in China’
, International Review of Financial Analysis
, 86.
Little, T. D. (1997), “Mean and covariance structures
(MACS) analyses of cross-cultural data: practical and
theoretical issues”, Multivariate Behavioral Research,
Vol. 32, pp. 53–76.
Luo, G., Serrão, C., Liang, D., & Zhou, Y. (2023) ‘A
Relevance-Based Technology – Organisation –
Environment Model of Critical Success Factors for
Digital Procurement Adoption in Chinese Construction
Companies’, Sustainability, 15(16), p. 12260.
Marsh, H. W. and Hocevar, D. (1988), “A new, more
powerful approach to multitrait-multimethod analyses:
application of second-order confirmatory factor
analysis”, Journal of Applied Psychology, Vol. 73 No.
1, pp. 107–17.
FEMIB 2024 - 6th International Conference on Finance, Economics, Management and IT Business
110

Moro, A., Maresch, D., Ferrando, A. & Udell., (2022) ‘
Funding innovation and the regulatory environment –
The role of employment protection legislation ’ ,
Journal of Business Research, 145, pp. 745-756–756.
Narwane, VS, Raut, RD, Mangla, SK, Dora, M &
Narkhede, BE. (2023) ‘Risks to Big Data Analytics
and Blockchain Technology Adoption in Supply
Chains’, Annals of Operations Research, 327(1), pp.
339–374.
Opara, M., Elloumi, F., Okafor, O. and Warsame, H.
(2017), “Effects of the institutional environment on
public–private partnership (P3) projects: evidence from
Canada”, Accounting Forum, Vol. 41 No. 2, pp. 77–95.
Ouyang, Z., Wei, W. and Chi, C. G. (2019), “Environment
management in the hotel industry: does institutional
environment matter?”, International Journal of
Hospitality Management, Vol. 77, pp. 353–64.
Pan, M. and Jang, W. (2008), “Determinants of the adoption
of enterprise resource planning within the technology–
organization–environment framework: Taiwan’s
communications industry”, Journal of Computer
Information Systems, Vol. 48 No. 3, pp. 94–102.
Peng, Y., Zhou, J., Lin, M., & Feng, D. (2023) ‘The
Impact of IT Capability on Corporate Green
Technological Innovation: Evidence from
Manufacturing Companies in China ’ , Journal of
Information & Knowledge Management, 22(1), pp. 1–
24.
Persico, D., Manca, S. and Pozzi, F. (2014), “Adapting the
technology acceptance model to evaluate the innovative
potential of e-learning systems”, Computers in Human
Behavior, Vol. 30, pp. 614–22.
Prajogo, D. I. and Ahmed, P. K. (2006), “Relationships
between innovation stimulus, innovation capacity, and
innovation performance”, R&D Management, Vol. 36
No. 5, pp. 499–515.
Schwarz, C and Schwarz A. (2014), “To Adopt or not to
adopt: a perception-based model of the EMR
technology adoption decision utilizing the technology
organization environment framework”, Journal of
Organizational and End User Computing, Vol. 26, pp.
57–79.
Stewart, K. A. and Segars, A. H. (2002), “An empirical
examination of the concern for information privacy
instrument”, Information Systems Research, Vol. 13
No. 1, pp. 36–49.
Straub, D. W. (1989), “Validating instruments in MIS
research”, MIS Quarterly, Vol. 13 No. 2, pp. 147–169.
Teo, T. and Khine, M. S. (2009), Structural equation
modeling in educational research, Sense Publishers,
Rotterdam, Holland.
Tidd, J. (2001), “Innovation management in context:
environment, organization and performance”,
International Journal of Management Reviews, Vol. 3
No. 3, pp. 169–83.
Tornatzky, L. G., Fleischer, M. and Chakrabarti, A. K.
(1990), Processes of technological innovation,
Lexington Books, Lexington, MA.
Wang, S. and Feeney, M. K. (2016), “Determinants of
information and communication technology adoption in
municipalities”, American Review of Public
Administration, Vol. 46 No. 3, pp. 292–313.
Xu, L. D., Xu, E. L. and Li, L. (2018), “Industry 4.0: state
of the art and future trends”, International Journal of
Production Research, Vol. 56 No. 8, pp. 2941–62.
Yeh, C and Chen, Y. (2018), “Critical success factors for
adoption of 3D printing”, Technological Forecasting
and Social Change, Vol. 132, pp. 209–16.
Zhao, X. (2018), Logistics technology development report
of China 2018—technology assisting logistics, CEIBS-
GLP Supply Chain and Services Innovative Center,
Shanghai, China.
Zhu, K. and Kraemer, K. L. (2005), “Post-adoption
variations in usage and value of e-business by
organizations: cross-country evidence from the retail
industry”, Information Systems Research, Vol. 16 No.
1, pp. 61–84.
Zhu, K., Kraemer, K. and Xu, S. (2003), “Electronic
business adoption by European firms: a cross-country
assessment of the facilitators and inhibitors”, European
Journal of Information Systems, Vol. 12 No. 4, pp. 251–
68.
The Impacts of Environmental Context on Technology Adoption and Their Invariance Analysis in Chinese Supply Chains
111
