
Human Centric Intersection Crossing Control Using C-ITS Information
Abhishek Kalose, Dehlia Willemsen and Jochem Brouwer
Integrated Vehicle Safety Department of TNO (Netherlands Organization for Applied Scientific Research), Helmond,
Keywords:
Connected and Automated Driving, Human-Like Driving, Cooperative Driving, Traffic Light Control,
Intersection Crossing Control.
Abstract:
One of the challenges in automated transport of passengers is comfort and trust of the passengers during
their travel. This especially comes into play when the automated driving vehicle has to react to external
influences from e.g. traffic lights. Much research has been put into recognizing the traffic lights and their state
with on-board sensors and into optimal traffic regulation at signalized intersections, however, optimal vehicle
control for passenger trust and comfort seems lacking. To advance in this area, in the EU-project SHOW,
an in-car traffic light control algorithm was designed and implemented in TNO’s carlab to be evaluated with
passengers. The outcome of experimental tests with a limited number of participants as passenger, seems
promising and will be a basis for future research on this topic. The implemented approach was found to be
an adequate methodology to tune the intersection crossing functionality of an automated vehicle in order to
optimize comfort and increase passenger trust.
1 INTRODUCTION
Automated driving technology has been progressing
into urban areas for quite some time now. And where
in the US this is currently concentrating around ride
sharing with companies like e.g. Uber and Waymo;
in Europe the focus is more on public transport-like
implementations. In the European project SHOW
(Shared automation Operating models for Worldwide
adoption) both approaches are considered (SHOW,
2020). The project aims to support the deployment of
shared, connected and electrified automation in urban
transport to enhance sustainable urban mobility. This
is done through real-life urban demonstrations con-
ducted in 20 cities across Europe by deploying shared,
connected, electrified fleets of automated vehicles in
coordinated Public Transport (PT), Demand Respon-
sive Transport (DRT), Mobility as a Service (MaaS)
and Logistics as a Service (LaaS) operational chains
in these cities.
One of the challenges in automated transport of
passengers is comfort and trust of the passengers and
other road users. This especially comes into play
when the automated driving vehicle has to react to
outside actions from e.g. other road users and infras-
tructure such as traffic lights. These traffic situations
have to be expected when driving in urban regions as
targeted in the SHOW project.
With respect to automated vehicles negotiating
traffic lights, much research has been put into recog-
nizing the traffic lights and their state with on-board
sensors (Bach et al., 2018), (Wang et al., 2023) and
into regulation of the traffic light state to optimize
traffic throughput (Le et al., 2022), (Treiber and Kest-
ing, 2014), (Guo et al., 2019). However, when it
comes to an optimal approach for passengers in terms
of comfort and trust, to the authors’ knowledge, no
specific publications are available. Hence a first de-
sign was set up to be evaluated with passengers (Sven
et al., 2022).
Where the previous publication focuses on the
methodology to measure user acceptance, this paper
presents details on the design and integration of the
model-based in-car algorithms to negotiate the sig-
naled intersections with a focus on the stopping be-
havior.
2 METHODOLOGY
For development and demonstration in the SHOW
project, the automated vehicles are thought to be driv-
ing on an existing bus lane, in normal traffic. This
means that most of the time, the automated vehicle
is separated from the traffic except for some specific
284
Kalose, A., Willemsen, D. and Brouwer, J.
Human Centric Intersection Crossing Control Using C-ITS Information.
DOI: 10.5220/0012623500003702
Paper published under CC license (CC BY-NC-ND 4.0)
In Proceedings of the 10th International Conference on Vehicle Technology and Intelligent Transport Systems (VEHITS 2024), pages 284-292
ISBN: 978-989-758-703-0; ISSN: 2184-495X
Proceedings Copyright © 2024 by SCITEPRESS – Science and Technology Publications, Lda.

points: signaled intersections and crossing Vulnera-
ble Road Users (VRUs). Additionally, the automated
vehicles should be able to relocate themselves in low-
traffic demand times. A platooning operation through
normal traffic is considered for this. The platoon is
thought to not to have to follow the bus lane in the
low-traffic hours. The first vehicle in the platoon
is then driven by a trained diver. The other vehi-
cles follow automatically. The traffic light algorithm
is thus part of a complete automated driving sys-
tem (Schmeitz et al., 2019), (Schmeitz et al., 2023),
(Klunder et al., 2019).
2.1 High Level Design Approach
The methodology to synthesise the full vehicle con-
troller followed a classical systems design approach:
• Firstly, use cases were defined. These are de-
scribed in the next section, section 2.2.
• From the use cases the required functionality was
derived and the tests to evaluate the functionality
were defined (so called ‘unit testing’). The de-
rived requirements are described in next section,
section 2.2.
• In parallel internal requirements (like e.g. the
hardware architecture of the carlab) were gath-
ered. See section 3 for additional requirements,
that mainly stem from the separation of the func-
tionality into a tactical part and an operational
part.
• Then a functional (‘logical’) design was made, see
section 5.
• Followed by the physical design and system veri-
fication (6).
2.2 Use Cases and Requirements
For the SHOW demonstration, there are two opera-
tional uses: normal use, where passengers are trans-
ported using a bus lane, and relocation, where the ve-
hicles are relocated in platoon. The main use cases for
handling a signalized crossing are part of both uses,
and are:
1. In-lane driving on straight or curved road without
preceding traffic,
2. In-lane driving on straight or curved road with
preceding traffic (respect minimum desired inter-
vehicle distance),
3. Brake (stop) for traffic light violation by VRU, no-
tified by Road Side Unit (RSU), to avoid collision,
4. Handle VRU crossing at pedestrian crossing, no
traffic light,
Inputs
Tactical layer
Vehicle mode manager
Go no-go
logics
Brakeline distance
Brakeline
distance
calculation
GLOSA
and VRU
states
Operational layer
Longitudinal control
Intersection controller
(Co-operative) ACC
Collision avoidance
Lateral control
Lane keeping
GLOSA/VRU state
Driving mode
Driving mode
manager
Traffic light
status (current)
Distance to
stop line
Vehicle
Velocity
Driver HMI
input
Outputs
Longitudinal
action goal
Lateral action
goal
Lane markings
Figure 1: Functional Architecture (GLOSA: Green Light
Optimal Speed Advisory).
5. Perform stop for traffic light, VRU,
6. Perform go after traffic light, VRU.
The use cases were the basis to define the func-
tional requirements. The functional requirements
mainly describe normal driving behavior. For exam-
ple, while driving in lane without traffic in front, the
vehicle should not exceed the speed limit and when
there is a vehicle in front, it should not drive too close
to this other vehicle, etc. These are quite straight-
forward requirements for driver support systems like
ACC and lane centering (see e.g. ISO standards
like (ISO 15622:2018, 2018) and (ISO 11270:2014,
2014)). Therefore, these are not repeated here. For
platooning the interested reader is referred to the
EU-project ENSEMBLE, see e.g. (Willemsen et al.,
2023).
Next to the behavioral requirements, additional re-
quirements have been formulated. Most important in
this paper is, as already stated, that approaching the
traffic light is comfortable for the passengers to sup-
port build-up of trust in the automation system. Since
no literature was found on what this exactly means,
one of the requirements is, that the actual approach
should be adjustable such that different behaviors can
be tested.
3 FUNCTIONAL
ARCHITECTURE
The architecture of the SHOW demonstrator applica-
tion has a setup with different layers: the operational
layer contains the algorithms for the short horizon
control of the vehicle: controlling speed, distance and
lateral position on the road; the tactical layer com-
prises the algorithms for driving behaviour, i.e. set-
point generation for the operational layer, following
strategies for lane keeping, lane changing, safe vehi-
cle following, platooning, approaching a traffic light,
etc. Figure 1 displays the tactical and operational
layer for the demonstrator vehicle with the algorithms
of the SHOW project.
Human Centric Intersection Crossing Control Using C-ITS Information
285
3.1 Operational Layer
The operational layer contains the functions for the
direct control of the motion of the automated vehicle.
These functions are explained in the following two
subsections.
3.1.1 Longitudinal Control
The longitudinal control function block contains
functions that define the longitudinal goal for the au-
tomated vehicle in terms of acceleration and decel-
eration setpoints. The longitudinal control functions
blocks contains the following functions,
• Adaptive Cruise Control (ACC) and Cooperative
Adaptive Cruise Control (CACC). This function
allows the automated vehicle to maintain a cer-
tain speed while keeping a safe distance to the
vehicle in front. One of the inputs to this func-
tions comes from the world model. The world
model performs the sensor fusion for localiza-
tion of the vehicle, object tracking and vehicle-
to-vehicle - and vehicle-to-infrastructure commu-
nication (‘V2X communication’).
The CACC controller along with the object infor-
mation also has communication over V2X with
the vehicle in front, thus allowing for faster re-
sponse to the changes in state of the vehicle in
front (Ploeg et al., 2011).
• Collision Avoidance. This functions is a safety
function, designed to avoid imminent collisions
with objects, the world model provides this func-
tion with the necessary object information (Regu-
lation No 131, 2014).
• Intersection Controller. The intersection con-
troller determines the acceleration/deceleration
setpoints needed to safely cross or stop at a sig-
nalized intersection. This is explained further in
section 5.
3.1.2 Lateral Control
The lateral control function block contains functions
that define the lateral steering setpoints to control the
automated vehicle. The lane keeping function outputs
steering wheel setpoints based on the lane line infor-
mation provided by sensors in the automated vehicle,
to keep the automated vehicle driving in the same lane
(Schmeitz et al., 2017).
3.2 Tactical Layer
The tactical layer contains functions that focus on de-
cision making for various functions of the automated
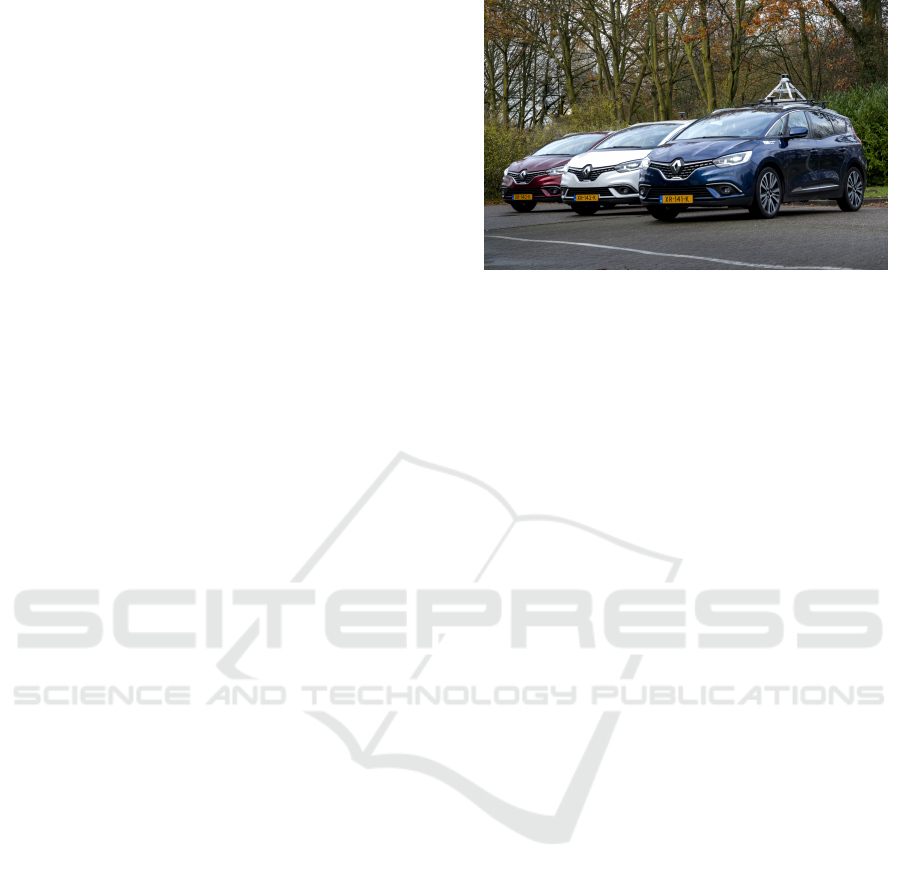
Figure 2: TNO Renault Scenic CarLab.
vehicle. For the SHOW project the tactical layer was
extended with functions that perform decision mak-
ing for safely crossing an intersection: capturing the
traffic light state, predicting the future state (using
V2X communication) and decision making on this in-
formation (continue driving, slow down based on the
traffic light state or stop at the traffic light).
In particular, the vehicle mode manager has the
following functionality:
• Brakeline Distance Calculator. This function cal-
culates the different brakeline distances as a func-
tion of vehicle speed. This is further explained in
section 5.1.
• Go No-Go Logic. This functions determines if
it is safe to cross an intersection when the traffic
light is yellow. It determines if the automated ve-
hicle should continue to cross the intersection or
stop before it. This is further explained in section
7.3
• GLOSA and VRU States. This function is a state
machine that determines where the automated ve-
hicle is with respect to the traffic light and the
defined brakelines, as shown in Figure 5. These
states parameterize the braking bahvior of the op-
erational controller, hence adjusting the way the
longitudinal setpoints are computed in order to
guide the vehicle for passing through an intersec-
tion.
4 PHYSICAL ARCHITECTURE
The intersection controller has been implemented in
one of the TNO carlabs (Renault Grand Scenic 2019)
depicted in Figure 2. These carlabs have been de-
veloped to support SAE Level 4 automated driving
(SAE Standard J3016, 2021).,For that purpose they
are equipped with additional sensors and automated
controls for accelerating, braking and steering. The
VEHITS 2024 - 10th International Conference on Vehicle Technology and Intelligent Transport Systems
286
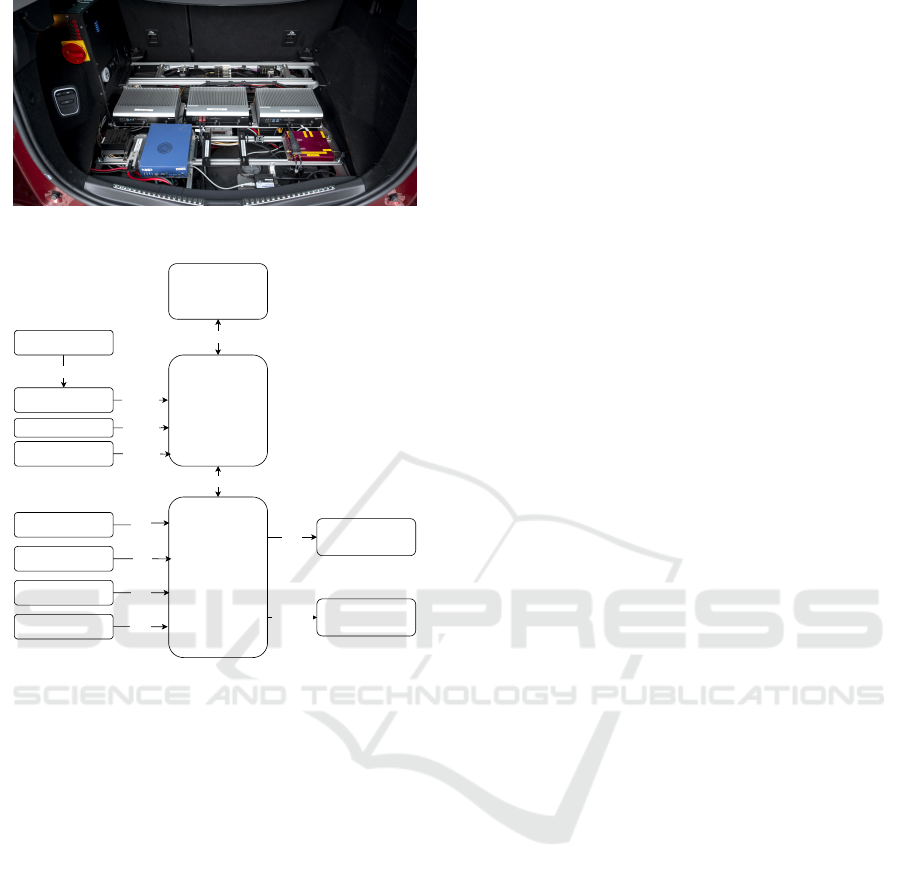
Figure 3: Retrofitted components in the TNO Carlabs trunk.
ethernet
Axiomtek
(tBOX324-894-FL-i7)
Logging Platform
Axiomtek
(tBOX324-894-FL-i7)
Sensor I/O
CAN
CAN
Analogue
TNO Developed
Vehicle Gateway
integrated PCIe
inexpensive GNSS
sensor
CAN
Wheel Speed
Sensors
CANOther vehicle sensors
Steering actuator
CANSteering Wheel Angle
CANIMU
ethernetV2X communication
ethernetHMI
CAN/
ethernet
Other retro-fitted
sensors
Throttle and brake
actuator
Figure 4: Carlab physical architecture.
standard sensor suite of the Renault is extended with
additional radars and cameras, and a variety of com-
munication systems (ITS-G5, 5G, C-V2X). Although
not used for this application, the CarLab sensor suite
can also be easily extended with additional sensors,
such as Ultra-wideband-tags and a RTK-GPS en-
hanced GNSS system.
Data from the vehicle based sensors can be ac-
cessed through a specially designed vehicle gateway.
This gateway also provides the possibility to actuate
the vehicle, where it converts the acceleration and
steering setpoints into actual drive, brake and steer-
ing actuation. To guarantee safe and reliable opera-
tion, the vehicle gateway additionally contains several
safety features. The vehicle gateway employs multi-
ple I/O for the communication with the vehicle sys-
tems in a safe way. Besides the integrated low-level
control, safety monitoring and sensor pre-processing,
the vehicle gateway allows for data collection to sup-
port evaluation of the developed functionalities, in a
safe, reliable and efficient way.
Figure 3 shows all the retrofitted components in
the TNO Carlabs’ trunk. Figure 4 shows the rel-
evant physical architecture for the purpose of this
project. The software stack of the automated vehicle
runs on axiomtek. It provides all the nominal func-
tionality such as intersection controller, lane keep-
ing controller, ACC, CACC, etc. Furthermore, the
axiomtek receives GNSS information from an inex-
pensive GNSS device. Additionally, the nominal ax-
iomtek is connected to a V2X communication unit,
to receive traffic light information and a Human Ma-
chine Interface (HMI) unit, which enables the user to
interface with the automated functions and to provide
the user with feedback about the state of the vehicle
and the developer with the state of the software stack
(Sven et al., 2022).
5 INTERSECTION
CONTROLLER
This section describes the tactical decision making
algorithm and the acceleration responses needed by
an automated vehicle to handle a signalised intersec-
tion. The intersection controller was developed in or-
der for the automated vehicle to safely handle signal-
ized intersection crossings. The current traffic light
state of the intersection is thought to be communi-
cated over X2V. The braking profile of the controller
was designed such that it resembles human like brak-
ing when approaching towards a signalised intersec-
tion, ensuring smooth transition towards automated
driving, minimising the need for adaptation from both
the occupants of the automated vehicle and other road
users around the automated vehicle.
The following sections explain in detail how the
intersection controller was designed.
5.1 Brakeline Definition
In this section the computation of brakelines for the
intersection controller is explained. The aim of the
controller is to let the automated vehicle either safely
pass through or stop at the signalized intersection,
based on the current traffic light state. In order to have
a human like braking approach towards the signalised
intersection a three phased approach with gradually
increasing levels of deceleration was developed. The
three phases are coasting, mild (lower magnitude)
braking with constant deceleration and brake to a
standstill with constant deceleration (higher magni-
tude). The different phases are identified by different
brakelines.
The three braking phases of the intersection con-
troller are defined by the relative position of the auto-
mated vehicle with respect to the reference line of the
Human Centric Intersection Crossing Control Using C-ITS Information
287
First
brakeline
Second
brakeline
Third
brakeline
Fourth
brakeline
Reference
line
V
1
initial
V
2
initial
V
3
initial
V
slow
V
final
= 0
A
B C
D
i ii iii iv
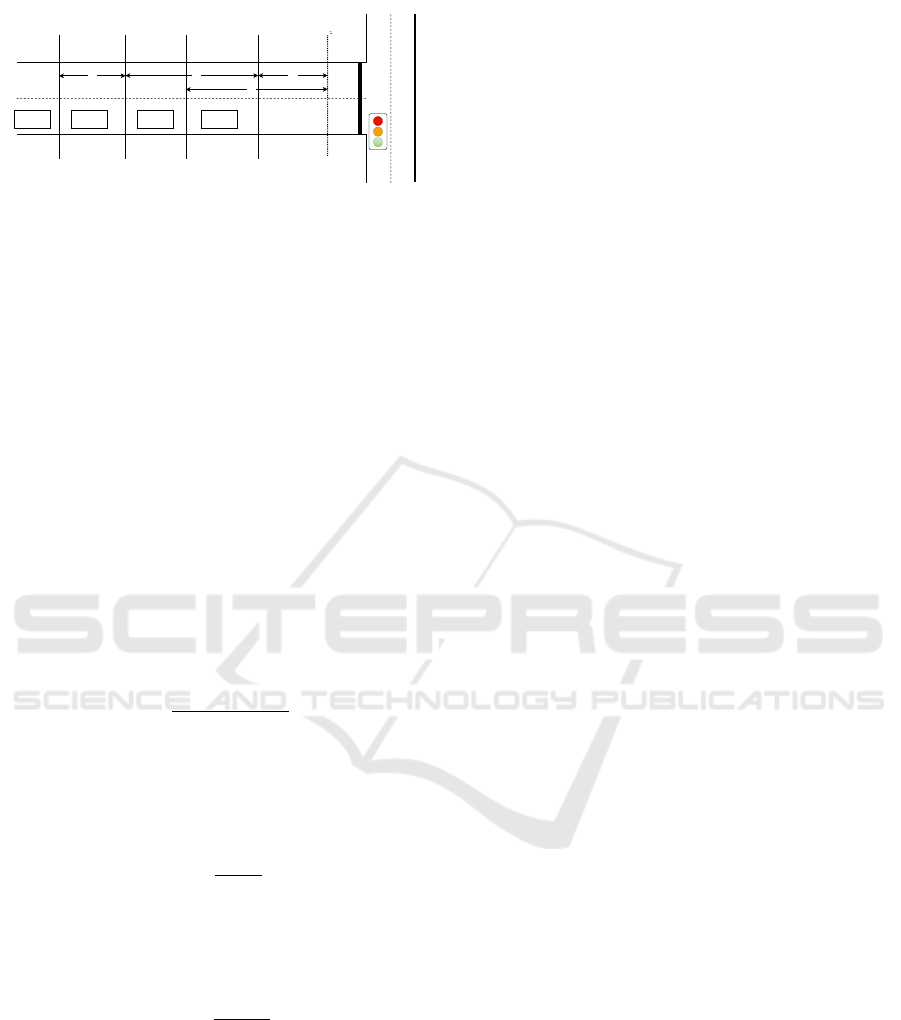
Figure 5: Brakeline definition of intersection controller.
intersection and the speed of the automated vehicle.
Figure 5 shows a representation of the brakelines.
The distance A, from the first to the second brake-
line, is the distance where the automated vehicle
coasts. During this phase the automated vehicle is not
meant to actively brake, but slow down due to longi-
tudinal resistance. The distance A is defined based on
a predetermined coasting time t
coasting
and the initial
speed when entering this phase V
1
initial
:
A = V
1
initial
∗ t
coasting
. (1)
The distance B, from the second to the fourth
brakeline, is the distance over which the automated
vehicle decelerates with a constant deceleration of
a
slow
, to reach a target speed V
slow
at the fourth brake-
line (V
2
initial
is the vehicle speed when reaching the
second brakeline, i.e. at the end of the coasting phase
when t = t
coasting
):
B =
V
2
slow
− V
2
2
initial
2a
slow
. (2)
Distance C is the distance over which the auto-
mated vehicle decelerates to standstill at the reference
line from a longitudinal speed V
slow
with a targeted
constant deceleration of a
stop
:
C = −
V
2
slow
2a
stop
. (3)
Over the distance D, the automated vehicle decel-
erates to standstill at the reference line with a targeted
constant deceleration of a
stop
:
D = −
V
3
2
initial
2a
stop
(4)
The tactical decision maker uses these brakelines
to determine the required braking behaviour of the au-
tomated vehicle as explained in the next subsection.
5.2 Tactical Decision Making
The tactical decision making algorithm is a state ma-
chine that determines the state of the automated vehi-
cle based on its position relative to the brakelines and
its speed. This is needed by the intersection controller
to compute the required acceleration/deceleration to
either stop at or continue through the intersection
based on the traffic light state. If required by the inter-
section signal state, the automated vehicle stops at the
reference line (a predefined line with a safety distance
before the actual stop line of the intersection).
If the traffic light state is green, the automated
vehicle does not slow down for the intersection but
passes through it using the ACC/CACC controller. If
the traffic light is yellow or red the intersection con-
troller is activated. Figure 5 shows different positions
(i, ii, iii and iv) the automated vehicle can have when
the traffic light state changes from green to yellow and
ultimately to red. The decision making for determin-
ing the braking behaviour connected to the position is
as follows.
Three Phase Braking
This is implemented when the automated vehicle is
at ‘position i’ in figure 5 and follows the three phase
braking approach. The automated vehicle, upon
reaching the first brakeline with speed V
1
initial
, starts
coasting till the second brakeline. From the second
brakeline till the fourth brakeline, it enters the next
phase where it decelerates from V
2
initial
to a prede-
fined speed V
slow
, with a constant targeted decelera-
tion of a
slow
. It then enters the last braking phase and
decelerates to stand still at the reference line with a
constant targeted deceleration a
stop
. The actual re-
quired deceleration values are computed as a function
of current vehicle speed and the distance to the tar-
geted brakeline. This is explained in section 5.3.
Two Phase Braking
This is implemented when the automated vehicle is
either at ‘position ii’ or ‘position iii’ in figure 5, when
it first starts braking in order to come to standstill at
the traffic light (i.e. it first receives a V2X message
that the traffic light is yellow or red, or it receives a
V2X message that the traffic light changed from green
to yellow). The automated vehicle skips the coasting
phase and starts slowing down from V
2
initial
to V
slow
between the second and fourth brakelines with a tar-
geted constant deceleration a
slow
. Between the fourth
brakeline and the reference line it enters the next brak-
ing phase and comes to standstill at the reference line
with a targeted constant deceleration of a
stop
.
One Phase Braking
This is implemented when the automated vehicle is
at ‘position iv’ in figure 5. It then skips the first two
braking phases and aims to come to stand still before
VEHITS 2024 - 10th International Conference on Vehicle Technology and Intelligent Transport Systems
288

the reference line, with a targeted constant decelera-
tion of a
stop
.
Yellow Light Decision Making and Braking
When there is a late phase transition from green to
yellow, the intersection controller checks if it possi-
ble for the automated vehicle to safely stop before
the intersection or if it can pass through it safely.
This is done by comparing the time duration of the
yellow phase (t
yellow
) to the time required by the
automated vehicle to pass through the intersection
with its current speed (V
current
): if V
current
∗ t
yellow
<
distance to re f erence line, the automated vehicle will
brake to standstill, if not, it continues through the in-
tersection without stopping. The value of t
yellow
is a
constant based on the speed limit of the road section,
as stated in (Onderzoek geeltijden, 2015).
5.3 Acceleration Calculation
In the previous section the computation of the brake-
lines was defined as a function of speed at the respec-
tive brakeline and predefined accelerations. The ac-
celeration of the automated vehicle in actual practice
can not always be a constant. Hence, it is computed in
close loop as a function of current vehicle speed and
current distance to the targeted brakeline and depends
on when the automated vehicle receives the current
traffic light state change. The following equations ex-
plain how the accelerations are computed.
The coasting phase during distance A is identified
by a constant predefined value of a
coasting
:
A
deceleration
= −a
coasting
. (5)
The deceleration in between the second and fourth
brakeline is computed as
B
deceleration
=
V
2
slow
− V
2
2
current
2B
distance
, (6)
where V
slow
is the targeted speed at the fourth brake-
line, V
current
is the speed of the vehicle at that instance,
and B
distance
is the distance from the current auto-
mated vehicle position to the fourth brakeline (eq. 3).
Between the fourth brakeline and the reference
line, the aim is to bring the automated vehicle to a
standstill at the reference line. Hence deceleration
is computed as a function of current vehicle speed
V
current
and the distance from the current automated
vehicle position to the reference line C
distance
:
C
deceleration
= −
V
2
2
current
2C
distance
. (7)
Finally, the deceleration between the third brake-
line and the reference line is computed similarly as for
C
deceleration
, i.e. a function of current vehicle speed
and the distance from the current position of the auto-
mated vehicle to the reference line:
D
deceleration
= −
V
3
2
current
2D
distance
. (8)
5.4 Design Parameters
Wrapping up the concept of the brakelines and the
decision making on the multi-phase braking, follow-
ing parameters can be used to shape the approach-
ing behavior (e.g. based on testing with participants,
or from individually registered manual braking be-
haviour):
1. t
coasting
: some drivers may prefer economic driv-
ing, thus implementing long coasting times,
2. a
slow
, a
stop
and V
slow
: all these together, some
drivers like late, stronger braking, where others
prefer more comfortable braking.
6 IMPLEMENTATION AND
TESTING
This section explains how the intersection controller
was integrated in the whole software stack and how
the testing and validation of the controller has been
carried out.
6.1 Software Implementation
The control algorithm of section 5 was developed us-
ing MATLAB and Simulink. The control and deci-
sion making algorithms were tested individually for
their functionality by the method of unit testing. Ad-
ditionally, the integrated software stack was tested in
integration tests for the test cases mentioned in sec-
tion 6.2. Also integration testing was carried out in
MATLAB and Simulink (MATLAB version: 2019b,
2019). Tested functions were compiled to a C++
ROS (Robotic Operating System, 2018) node, using
Simulink Coder (Simulink Coder (2019b), 2019).
The individual sub-functions of the software were
integrated in a full AD stack using Robot Operating
System (ROS) as middle-ware. Besides the newly
compiled controller sub-functions, additional world
modelling, health monitoring and drivers for receiv-
ing the sensor data in the automated vehicle are inte-
grated. Each of these functions were running as indi-
vidual ROS nodes and communicate with each other
by means of either custom or standard ROS messages.
This entire software stack was then implemented on a
TNO CarLab for real world testing.
Human Centric Intersection Crossing Control Using C-ITS Information
289
6.2 Testing and Validation
The real world tests were carried out at Aldenhoven
Test Center (Aldenhoven Testing Center, ) in Ger-
many. The test facility has an urban driving area
with several intersections. An intersection traffic light
equipped with communication was used to provide
the automated vehicle with the current traffic light
state and the location of the stop line in terms of lati-
tude and longitude. Based on the position of the auto-
mated vehicle obtained from the onboard GNSS sen-
sor, the distance from the automated vehicle to the
stop line was computed. From this, the position with
respect to the brakelines could be computed using the
current vehicle speed as well.
The developed intersection controller and the de-
cision making algorithm were tested for approaches
to the intersection starting from a steady state speed
of 50 km/h, while using an active lane keeping con-
troller to keep the automated vehicle in the lane. To
isolate and only study the behavior of the intersec-
tion controller, the automated vehicle approached the
intersection with a clear path, free from other vehi-
cles or obstacles. This eliminated the influence of any
other longitudinal and lateral control systems. The
state of the traffic light was emulated using a scenario
generator due to lack of a traffic light with X2V capa-
bility, and to facilitate easy repeating of a specific the
scenario. The tests were carrier out for the following
three scenarios:
• Far away: the traffic light state changes from
green to yellow when the automated vehicle is
120 m from the stop line, and then to red after
3 s,
• Close: the traffic light changes state from green
to yellow when the automated vehicle is at 50 m
from the stop line and then to red after 3 s,
• Very close: the traffic light changes state from
green to yellow when the automated vehicle is at
20 m from the stop line.
The three tests were repeated 6 times. Resulting
in a total of 18 test runs. Further detailed explana-
tion of the test procedure is explained in (Sven et al.,
2022). This paper focuses on functional and perfor-
mance validation of the designed algorithm. The test
results are discussed in the next section.
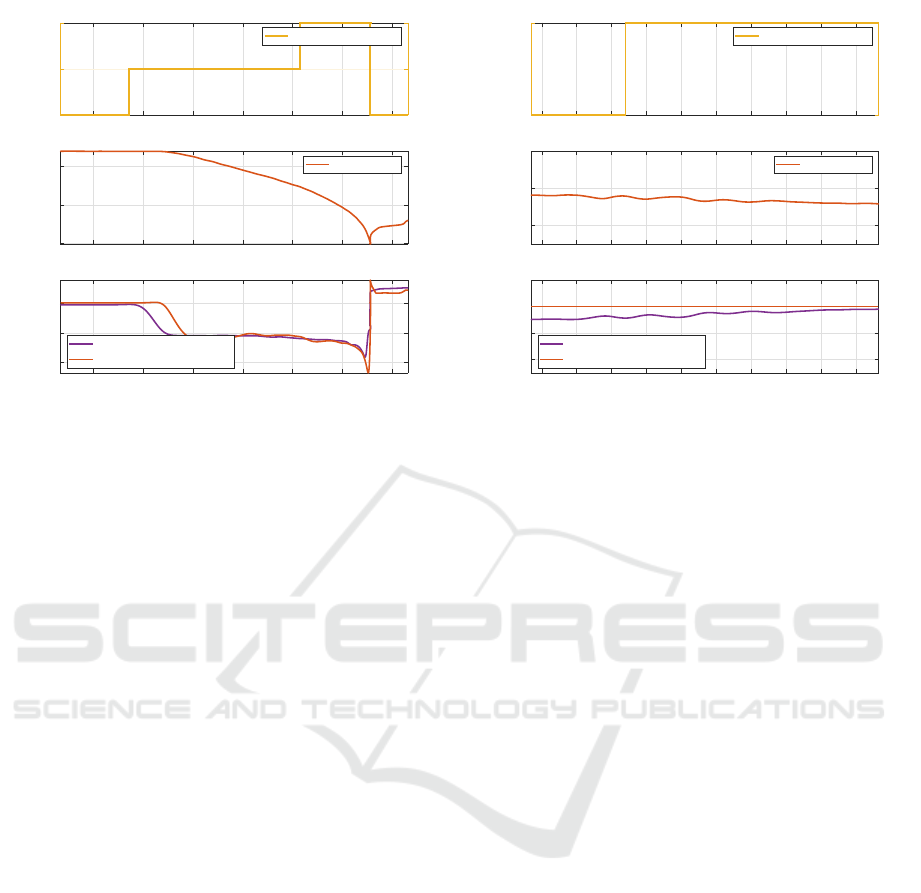
7 RESULTS
The main outcome of the user tests at Aldenhoven
Testing Center (ATC) [5], are shown in Figure 6, Fig-
ure 7 and Figure 8. They show the typical braking
020406080100120
Distance to stopline [m]
Green
Yellow
Red
Phase [-]
Glosa Current Phase
020406080100120
Distance to stopline [m]
0
20
40
Velocity [km/h]
Host Velocity
020406080100120
Distance to stopline [m]
-2
0
2
Acceleration [m/s
2
]
Host Acceleration Setpoint
Host Acceleration
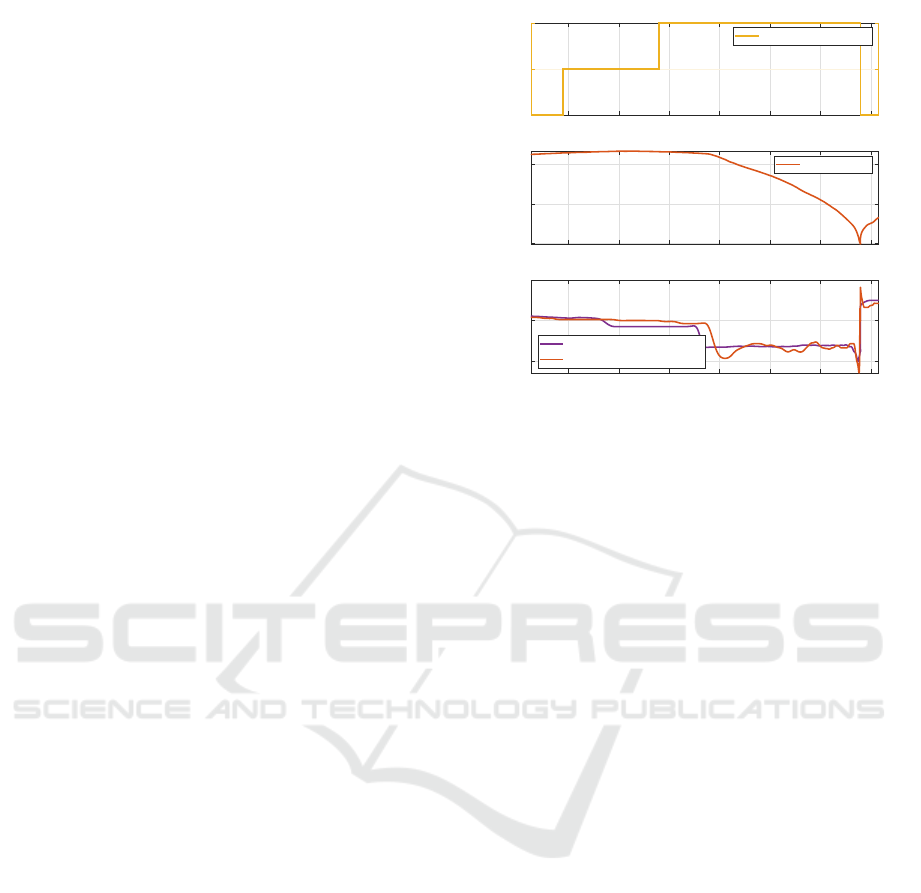
Figure 6: Three phase braking results.
response of the automated vehicle, with respect to the
distance to the reference line for the three tested con-
ditions. In each figure the first graph from the top
shows the current status of the traffic light, the mid-
dle graph represents the vehicle speed, and the bottom
graph shows the requested (purple line) and realised
deceleration (red line). The realised deceleration al-
ways has a small delay due to the dynamics of the
drivetrain and the vehicle inertia.
7.1 Three Phase Braking Results
Figure 6 shows the behavior of the tactical decision
maker and the control algorithm when the automated
vehicle starts reacting to the traffic light before the
first brakeline.
It shows the braking response of the automated ve-
hicle for the “far away” test case. From the graph it
can be seen that the automated vehicle is at constant
speed till it detects the yellow traffic light. It then
starts decelerating initially in the coasting phase, fol-
lowed by braking with constant deceleration, and then
brakes to stand still at around 8 m before the reference
line, to stop at the reference line. Then when the traf-
fic light turns green the automated vehicle switches
back to the ACC controller and accelerates in order
to cross the intersection. The response of the auto-
mated vehicle is as expected, it goes through all the
three braking phases. As the realised deceleration is
slightly delayed compared to the requested decelera-
tion, it overshoots to compensate for the delay. Note
that the delay of the braking dynamics is typically
t = 0.3 s. However, as we depict the distance to the
intersection on the x-axis, the delay may seem quite
VEHITS 2024 - 10th International Conference on Vehicle Technology and Intelligent Transport Systems
290
0102030405060
Distance to stopline [m]
Green
Yellow
Red
Phase [-]
Glosa Current Phase
0102030405060
Distance to stopline [m]
0
20
40
Velocity [km/h]
Host Velocity
0102030405060
Distance to stopline [m]
-4
-2
0
Acceleration [m/s
2
]
Host Acceleration Setpoint
Host Acceleration
Figure 7: Two phase braking results.
large. The noise in the realised acceleration close to
the reference line is induced by the downshifting of
the transmission of the automated vehicle.
7.2 Two Phase Braking Results
Figure 7 shows the reaction of the automated vehicle
when it starts braking for the traffic light after the third
brakeline.
It shows the braking response of the automated ve-
hicle in the “close” case. The approach speed of the
ego vehicle is 50 km/h and when the automated vehi-
cle is at 50 m from the reference line the traffic light
changes from green to yellow and then subsequently
to red. The automated vehicle reacts to this and starts
braking with the required deceleration to come to a
standstill at the intersection, according to eq. 7. The
response of the automated vehicle is as expected, and
it comes to a safe stop before the stop line.
7.3 Yellow Phase Decision Results
Figure 8 shows the automated vehicle in the “too
close” case. The approach speed of the ego vehicle
is 50 km/h and when the automated vehicle is at 20 m
from the reference line, the traffic light changes from
green to yellow. Since the automated vehicle is too
close to the stop line, the yellow light decision mak-
ing algorithm determines that it is no longer possible
to come to a safe stop before the stop line, as the lon-
gitudinal deceleration needed by the automated vehi-
cle to come to standstill would result in harsh braking.
Moreover, the vehicle will pass the traffic light before
it turns red. The response in the test is thus in line
-10-505101520253035
Distance to stopline [m]
Green
Yellow
Phase [-]
Glosa Current Phase
-10-505101520253035
Distance to stopline [m]
46
48
50
Velocity [km/h]
Host Velocity
-10-505101520253035
Distance to stopline [m]
-0.4
-0.2
0
0.2
Acceleration [m/s
2
]
Host Acceleration Setpoint
Host Acceleration
Figure 8: Yellow phase decision results.
with the controller design.
8 CONCLUSIONS
This paper describes the methodology, design and in-
tegration of an automated vehicle controller to handle
signalized intersection crossings, with focus on com-
fort and trust. The initial results of this research seem
promising and is the basis for other research on this
topic, such as a controller for reacting to a Vulnera-
ble Road User (VRU) crossing the intersection. The
implemented approach was found to be an adequate
methodology to tune the intersection crossing func-
tionality of an automated vehicle in order to optimize
comfort to increase passenger trust.
All the tests were carried out at 50 km/h, and all
the three test scenarios were tested 6 times on the
same day, hence reducing influence of external fac-
tors. It was observed that all the test results were in
line with the expected outcome and consistent in per-
formance.
The presented design is a first setup to gather ini-
tial feedback from (potential) passengers. Only lim-
ited testing has been possible so far. Currently more
research is being performed into generalisation of the
approach presented in this work to generic intersec-
tion crossing. This, among others, involves investi-
gation of approaching a traffic light comfortably for
passengers of automated vehicles. Recently, research
into the evaluation of automated driving for public
road admission is looking into human driving for
comparison. This may offer usable algorithms and/or
models also for the design of automation functions as
Human Centric Intersection Crossing Control Using C-ITS Information
291

presented here. Hence, this will be monitored closely
for future research directions.
In parallel, a more overall method to design deci-
sion making algorithms for multiple automated driv-
ing functionalities (i.e. not only approaching a traffic
light, but e.g. also platooning with other vehicles) in
an automated manner is being researched. Further-
more, a similar controller to handle VRUs crossing
an intersection was also developed, the results of this
will be discussed in future publications.
ACKNOWLEDGEMENTS
This research and paper have been made possible
through funding by the European Union’s Horizon
2020 research and innovation program under Grant
Agreement number 875530, project SHOW (SHared
automation Operating models for Worldwide adop-
tion).
REFERENCES
Aldenhoven Testing Center. https://www.aldenhoven-
testing-center.de/en/.
Bach, M., Stumper, D., and Dietmayer, K. (2018). Deep
convolutional traffic light recognition for automated
driving. In 2018 21st International Conference on In-
telligent Transportation Systems (ITSC), pages 851–
858. IEEE.
Guo, Q., Li, L., and Ban, X. J. (2019). Urban traffic sig-
nal control with connected and automated vehicles:
A survey. Transportation research part C: emerging
technologies, 101:313–334.
ISO 11270:2014 (2014). Intelligent transport systems lane
keeping assistance systems (lkas) performance re-
quirements and test procedures. Standard, Interna-
tional Organization for Standardization, Geneva, CH.
ISO 15622:2018 (2018). Intelligent transport systems adap-
tive cruise control systems performance requirements
and test procedures. Standard, International Organi-
zation for Standardization, Geneva, CH.
Klunder, G., Michel, L., Hettie, B., Ron, W., Simeon, C.,
Paco, H., and Stefan, T. (2019). CACC Proef Noord-
Holland.
Le, D. D., Merkert, M., Sorgatz, S., Hahn, M., and Sager,
S. (2022). Autonomous traffic at intersections: An
optimization-based analysis of possible time, energy,
and co savings. Networks, 79(3):338–363.
MATLAB version: 2019b (2019).
https://www.mathworks.com.
Onderzoek geeltijden (2015).
https://www.crow.nl/downloads/pdf/verkeer-
en-vervoer/publicatie/eindrapport-geeltijden-
iver januari2016.aspx.
Ploeg, J., Scheepers, B. T., Van Nunen, E., Van de Wouw,
N., and Nijmeijer, H. (2011). Design and experimen-
tal evaluation of cooperative adaptive cruise control.
In 2011 14th International IEEE Conference on Intel-
ligent Transportation Systems (ITSC), pages 260–265.
IEEE.
Regulation No 131 (2014). Regulation no 131 of the Eco-
nomic Commission for Europe of the United Nations
(UN/ECE) — Uniform provisions concerning the ap-
proval of motor vehicles with regard to the Advanced
Emergency Braking Systems (AEBS). document UN
R131, EUR-Lex 42014X0719(01) EN EUR-Lex (Eu-
ropa.Eu).
Robotic Operating System (2018). https://www.ros.org.
SAE Standard J3016 (2021). Taxonomy and definitions for
terms related to driving automation systems for on-
road motor vehicles.
Schmeitz, A., Schwartz, R. S., Ravesteijn, D., Verhaeg, G.,
Altgassen, D., and Wedemeijer, H. (2019). Eu autopi-
lot project: Platooning use case in brainport.
Schmeitz, A., Zegers, J., Ploeg, J., and Alirezaei, M. (2017).
Towards a generic lateral control concept for cooper-
ative automated driving theoretical and experimental
evaluation. In 2017 5th IEEE international conference
on models and technologies for intelligent transporta-
tion systems (MT-ITS), pages 134–139. IEEE.
Schmeitz, A. J., Willemsen, D. M., and Ellwanger, S.
(2023). Eu ensemble project: Reference design and
implementation of the platooning support function.
IEEE Transactions on Intelligent Transportation Sys-
tems.
SHOW (2020). SHared automation Operating models for
Worldwide adoption, https://show-project.eu/.
Simulink Coder (2019b) (2019).
https://www.mathworks.com.
Sven, J., Jochem, B., and Koichi, K. (2022). Human-centric
automated driving for intersection crossing. Proceed-
ings of the 2022 JSAE Annual Congress.
Treiber, M. and Kesting, A. (2014). Automatic and ef-
ficient driving strategies while approaching a traffic
light. In 17th International IEEE Conference on In-
telligent Transportation Systems (ITSC), pages 1122–
1128. IEEE.
Wang, X., Han, J., Xiang, H., Wang, B., Wang, G., Shi, H.,
Chen, L., and Wang, Q. (2023). A lightweight traf-
fic lights detection and recognition method for mobile
platform. Drones, 7(5):293.
Willemsen, D. M., Schmeitz, A. J., and Mascalchi, E.
(2023). Eu ensemble project: Specification of an inter-
operable solution for a support function for platoon-
ing. IEEE Transactions on Intelligent Transportation
Systems.
VEHITS 2024 - 10th International Conference on Vehicle Technology and Intelligent Transport Systems
292
