
Automated Georeferencing and Extraction of Building Footprints
from Remotely Sensed Imagery using Deep Learning
Aniruddha Khatua
a
, Apratim Bhattacharya and Bharath H. Aithal
b
Ranbir and Chitra Gupta School of Infrastructure Design and Management,
Indian Institute of Technology Kharagpur, Kharagpur, India
Keywords: Remote Sensing, GIS, Deep Learning, Automation, UAV Data Processing.
Abstract: Extracting building footprints from remotely sensed photos is crucial in conducting analyses in domains such
as land-use analysis, transportation planning and development, environmental studies, and others. Various
methodologies and strategies have been suggested for extracting building footprints from satellite or UAV
images, aiming to circumvent the arduous, time-consuming, less effective, and costly process of manually
digitizing building footprints. These proposed methodologies and strategies have demonstrated their efficacy
in detecting and extracting features. However, they do not adequately retain the geographical information
during the output generation process. This paper presents a pipeline that can automatically extract
geographical information from input photos and transfer it to the output image, thereby achieving automated
georeferencing of the output image. The pipeline utilizes the YOLOV8 model, an advanced deep-learning-
based architecture for object detection and segmentation. The detection and segmentation findings, combined
with the acquired geographical information, are used to perform vectorization and generate vector images of
the extracted building footprint. This suggested pipeline streamlines the process of obtaining building
footprint data linked to geospatial information by automating the georeferencing and shapefile preparation
phases, reducing the associated complications. This automation not only expedites the process but also
improves the precision and uniformity of the output datasets.
1 INTRODUCTION
The process of urbanization has experienced
accelerated growth in the past twenty years because
of globalization (Ramachandra et al., 2014).
Urbanization, a significant driver of city expansion, is
influenced by various elements, including economic,
social, and political influences, as well as the
geomorphology of urban regions. These growth
factors stimulate investment, enhance the quality of
public and private services, and foster technological
innovation. Urban space refers to a human-dominated
and altered environment that has been created through
the process of urbanization (Bharath et al., 2018). The
built-up density rises with population growth,
modernization, and industrialization. Therefore, to
ensure sustainable development, it is necessary to
implement effective planning and meticulous design.
a
https://orcid.org/0000-0002-4308-0595
b
https://orcid.org/0000-0002-4323-6254
Buildings are acknowledged as one of the crucial
components of urban areas. Identifying building types
and extracting their footprints represent essential
information within the realm of urban-related
research. Obtaining the building information through
GIS and integrating machine learning and remote
sensing has significantly enhanced this process,
resulting in improved accuracy and reduced time
requirements. Annotated datasets have emerged as a
vital prerequisite for developing and evaluating new
automated techniques for interpreting remote sensing
data. Unmanned Aerial Vehicle (UAV) imagery is an
excellent means for training, annotating, testing, and
automating the interpretation and data extraction
procedures. The automated classification of building
types and extracting their footprints from aerial
imagery proved significant in deep learning,
computer vision, and remote sensing (Goldberg et al.,
2017; Ps & Aithal, 2022, Dey et al., 2024).
128
Khatua, A., Bhattacharya, A. and Aithal, B.
Automated Georeferencing and Extraction of Building Footprints from Remotely Sensed Imagery using Deep Learning.
DOI: 10.5220/0012625300003696
Paper published under CC license (CC BY-NC-ND 4.0)
In Proceedings of the 10th International Conference on Geographical Information Systems Theory, Applications and Management (GISTAM 2024), pages 128-135
ISBN: 978-989-758-694-1; ISSN: 2184-500X
Proceedings Copyright © 2024 by SCITEPRESS – Science and Technology Publications, Lda.

Over the past few years, there has been a
substantial surge in the application and advancement
of deep learning methodologies across diverse
domains. This trend is particularly pronounced in
remote sensing, with a noteworthy increase in the
integration and application of deep learning
techniques. Many tasks, including feature extraction
and classification, are now being conducted on
various types of remotely sensed data, such as
satellite and aerial images. Researchers have actively
devised and implemented segmentation algorithms to
enhance the efficiency and precision of surface
feature extraction. Among the notable algorithms are
modified versions of U-Net (Prakash et al., 2022;
Madhumita et al., 2023), VGGNet (Simonyan &
Zisserman, 2014), GoogleNet (Szegedy et al., 2015),
ResNet (He et al., 2016), ImageNet (Krizhevsky et
al., 2017), and Segnet (Badrinarayanan et al., 2017),
among others. YOLOV8 (Jocher et al., 2023), an
iteration of the You Look Only Once architecture
(Redmon et al., 2016), has demonstrated promising
outcomes in object detection and instance
segmentation.
The investigation conducted by Khatua et al.
(2023) delves into the noteworthy application of
YOLOV8 within the geospatial domain, particularly
in the classification of building rooftops. Their study
involved categorizing building rooftops into two
distinct classes, namely "Residential Buildings" and
"Non-residential Buildings," which was achieved
through the adept utilization of YOLOV8 for
detection and segmentation. The researchers
employed high-resolution datasets, specifically the
open-source SpaceNet-3 Vegas dataset (satellite) and
ISPRS Potsdam dataset (aerial), although the study
area was outside India. Upon applying a similar
methodology to an Indian dataset, an intriguing
observation emerged: the model's output lacked
geospatial information despite the input images being
perfectly georeferenced. This necessitated an
additional georeferencing step for the output images
to make them suitable for subsequent geospatial
analyses. In response to this challenge, this article
proposes a refined approach to address the issue by
introducing a systematic process for georeferencing
the output images generated by the model.
Moreover, the article advocates for an automated
procedure to extract building footprints in vector
format enriched with geospatial information. This
proposed enhancement ensures that the extracted
building footprints maintain spatial references,
significantly augmenting their utility and
applicability for geospatial analyses. Including the
georeferencing process is crucial for effortlessly
incorporating the model's results into extensive
geospatial workflows, thereby improving the overall
efficiency of YOLOV8-based classification of
building rooftops across various geographical
settings.
2 METHODOLOGY
The methodology employed in this study adopts the
building classification framework outlined by Khatua
et al. (2023). The dataset used for this investigation is
derived from an Indian source obtained through
Aereo Manufacturing Private LTD., in conjunction
with the SpaceNet-3 Vegas dataset. A meticulous
annotation process was undertaken to categorize all
images within the specified dataset into residential
and non-residential classes. This annotated dataset
was then utilized for training the YOLOV8 detection
model—the initial phase of the training process
involved exclusively using the SpaceNet-3 dataset.
Once the model achieved satisfactory training
accuracy on this dataset, the Indian dataset was
introduced as an additional component to further
enhance the model's robustness. After the successful
training on both datasets, the model underwent testing
using images deliberately held out from the training
dataset. Upon completion of the result generation
phase, the subsequent stage in the pipeline
encompasses georeferencing and the production of
vector images for the segmented and categorized
buildings. This step involves translating the spatial
information of the identified buildings and converting
them into vector representations, contributing to a
more comprehensive understanding of the built
environment. Incorporating georeferencing and
creating vector images guarantee both spatial
precision and visual portrayal of the recognized
building classifications, enhancing the overall
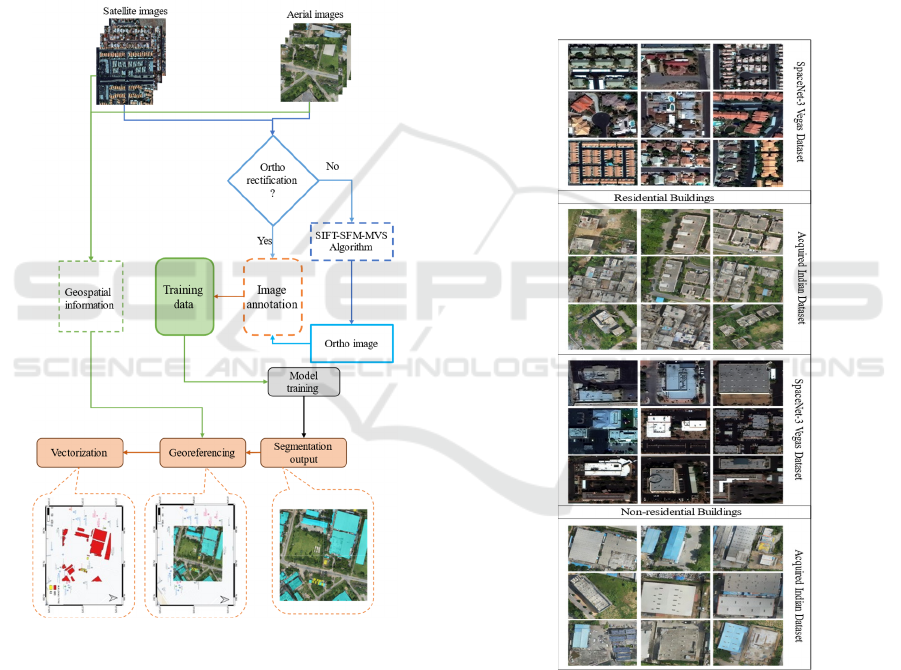
efficiency of the classification procedure. Figure 1
depicts the entire methodology workflow.
In summary, the methodology unfolds
systematically, starting with model training for
classification, expanding to enhance the
generalization capability, incorporating
georeferencing to relate predictions to real-world
locations, and generating vector polygons that capture
the spatial distribution of segmented features. This
stepwise approach ensures a robust and versatile
pipeline-building analysis in diverse geographical
contexts.
Automated Georeferencing and Extraction of Building Footprints from Remotely Sensed Imagery using Deep Learning
129
2.1 Dataset
This research utilized a diverse set of images,
originating from various sources including aerial
and satellite imaging. Satellite images are
commonly available with embedded geospatial
information and are often ortho-rectified, ensuring
accurate geometric representation. Conversely,
aerial images, while also typically accompanied by
geospatial information, may lack orthorectification.
In the specific context of this study, the dataset
sourced from Aereo Manufacturing Private LTD.,
comprises aerial images that are not ortho-rectified;
however, they are georeferenced.
Figure 1: Methodology workflow.
2.1.1 SpaceNet-3 Dataset
The consortium of CosmiQ Works, Radiant
Solutions, and NVIDIA has publicly released a
significant satellite imagery collection annotated on
the Amazon Web Services (AWS) platform under the
name SpaceNet. SpaceNet partners have introduced
public competitions to drive advancements in
machine learning algorithms for remote sensing. This
study utilized the SpaceNet 3 Las Vegas dataset
(Figure 2), initially designed for road network
extraction. Notably, the dataset includes diverse
building images in size, shape, and architectural
characteristics, proving advantageous for the model's
comprehensive learning. The images are 1300x1300
pixels with a spatial resolution of 30cm.
2.1.2 Indian Dataset
The dataset (Figure 2) provided by Aereo
Manufacturing Private LTD. includes images sized at
6000x4000 pixels, with a resolution of 3 centimetres.
The bit depth of each image is 24, signifying the
extent of color information encoded in each pixel.
Furthermore, the images are structured in the RGB
colour space.
Figure 2: Example of residential and non-residential
buildings.
2.2 Image Preprocessing and
Ortho-Map Generation
Image preprocessing steps are implemented to
generate orthorectified images (Figure 3) to enhance
the quality and accuracy of the dataset. This crucial
process corrects geometric distortions in the original
GISTAM 2024 - 10th International Conference on Geographical Information Systems Theory, Applications and Management
130

aerial images, aligning them with the Earth's surface
and facilitating precise spatial analysis. Integrating
georeferencing and orthorectification in the
preprocessing phase is essential for ensuring the
reliability and consistency of the dataset, enabling
more accurate interpretations and analyses in
subsequent stages of the research. The initial step in
this process involves the creation of an ortho-mosaic
map layer through aerial triangulation. This step is
crucial for producing an accurately geolocated ortho
map. The ortho-mosaic is generated using the SIFT-
SFM-MVS algorithm, distinguishing itself from
traditional photogrammetry. The SFM-MVS
workflow comprises three essential stages. First, it
involves identifying and matching key points, such
as Scale Invariant Feature Transform (SIFT)
(Lindeberg, 2012). Second, the process entails
performing Structure-from-Motion (SFM)
(Schonberger & Frahm, 2016) with camera
parameters to generate a sparse point cloud as
output. Third, a densified point cloud is generated
through the Multi-View-Stereo (MVS) process
(Iglhaut et al., 2019). Firstly, the SIFT-SFM-MVS
method offers automatic identification and matching
of image features, even when they exhibit variations
in scale, viewing angles, and orientations. This
feature is mainly for small and unstable platforms.
Secondly, the algorithm equations can be solved
without necessitating information about the camera
positions or ground control points, although these
can be incorporated if available. Lastly, the
approach allows for the automatic calibration or
refinement of camera parameters during the
processing. Following the generation of the ortho
map, it is further organized into equal-sized grid-
based tiles, each measuring 960x960, for efficient
data management. The division enhances the overall
organization and accessibility of the geospatial data.
2.3 Model Training and Output
Generation
The study utilized YOLOV8 detection model as the
detection component, sharing a design lineage with
YOLOV5 (Jocher et al., 2020) through their common
creator Ultratlytics. YOLOV8 introduces the C2f
module, which combines two convolutional modules
to improve detection by blending high-level and
contextual features. It is an anchor-free model with a
separate head for independently managing detection,
classification, and regression, enhancing its accuracy
and efficiency.
The process begins with amalgamating two
distinct image datasets, followed by meticulous
annotation for each image. These annotated datasets
are then carefully partitioned, allocating 70% for
training, 20% for validation, and 10% for testing. The
significance of the validation set lies in its role as a
metric for assessing the precision and recall of the
model, offering insights into its performance.
Augmented versions of each image are systematically
generated to enhance the training accuracy. The
applied augmentation techniques encompass vertical
flips, horizontal flips, mirroring, and a 90
0
rotation.
The validation images facilitate prediction
comparisons at every iteration throughout the training
phase, contributing to the model's refinement. Upon
achieving a satisfactory level of training accuracy, the
model is deployed to predict outcomes on the images
within the designated test dataset. This
comprehensive approach ensures a robust and well-
optimized model capable of generalizing to new data.
Figure 3: Example of orthorectification.
Automated Georeferencing and Extraction of Building Footprints from Remotely Sensed Imagery using Deep Learning
131

2.4 Automated Georeferencing of the
Model-Generated Outputs
The developed process demonstrates its effectiveness
in generating a detailed mask that accurately outlines
the recognized buildings. However, a significant
drawback in the model's output becomes evident as it
does not include crucial geospatial information.
Acknowledging the vital role of geospatial
information for extracting rooftop details, endeavours
are focused on extracting this data. The needed
geospatial details can be found in the original input
images. The developed process demonstrates its
effectiveness in generating a detailed mask that
accurately outlines the recognized buildings.
However, a significant drawback in the model's
output becomes evident as it does not include crucial
geospatial information. Acknowledging the vital role
of geospatial information for extracting rooftop
details, endeavours are focused on extracting this
data. The needed geospatial details can be found in
the original input images.
A systematic process is implemented to address
this gap to extract georeferencing information from
the input image. This process is executed with
precision and efficacy by utilising an open-source
Geospatial Data Abstract Library (GDAL) in the
Python platform. The amalgamation of geospatial
data is accomplished by employing the
"georeference_image" function, as delineated in the
following pseudo-code (Algorithm 1). This function
serves as a crucial intermediary, transferring the
extracted geospatial information from the input
image to output generated by the YOLOV8 model.
In essence, the strategic incorporation of
georeferencing ensures that the model's outputs are
visually accurate and possess spatial contexts
needed for subsequent applications, such as vector
image generation. Integrating the geospatial
information to the output images elevates the overall
utility of the pipeline, enabling more nuanced and
context-aware analyses.
2.5 Vectorization of the Identified
Objects
Once the segmented object coordinates transform
into georeferenced coordinates, a crucial subsequent
step involves connecting these newly acquired
coordinates to create vector polygons. Figure 5
depicts the pseudo-code of the entire vectorization
and polygon generation process. These polygons
serve as geometric shapes on the map and play a
vital role in representing the spatial distribution of
the identified features. Importantly, these polygons
encompass geographical coordinates and store
additional information, such as the classification or
type of the building, as attributes associated with
each polygon. An essential detail lies in maintaining
the consistency of the coordinate reference system
(CRS) throughout the process. The coordinate
reference system is a standardized way of
representing location on the Earth's surface. In this
case, the CRS used for the vector polygons is
directly transferred from the original input image.
This careful alignment ensures no error in the spatial
positioning of the vector polygons. In other words,
the geographic information encoded in the vector
polygons precisely matches that of the initial image,
eliminating any potential misalignment issues that
could compromise the accuracy of subsequent
analyses or applications.
Function
georeference_image(reference_tiff_path,
input_image_path,
output_georeferenced_path):
Data: OPEN reference_tiff_path with gdal
geo_transform: GET geo transformation
from dataset;
CALCULATE corner coordinates (Upper
Left, Upper Right, Lower Left, and Lower
Right);
OPEN reference_tiff_path with rasterio as
src_ref;
GET reference image transform from src_ref
OPEN input_image_path with rasterio as
src_input
READ input data and get input transform from
src_input
CREATE GroundControlPoints (GCPs) for
input image corners
CREATE transformation from GCPs
UPDATE output_profile with transformation
and CRS info
OPEN output_georeferenced_path with
rasterio for writing
WRITE input_data with updated profile to
output_georeferenced_path
end
Algorithm 1: Georeference Image.
GISTAM 2024 - 10th International Conference on Geographical Information Systems Theory, Applications and Management
132
3 RESULTS AND DISCUSSION
The methodology pipeline encompasses three key
functionalities: building-type classification,
georeferenced output generation, and vectorization of
segmented features. The construction of this
comprehensive pipeline unfolds in a stepwise manner
to ensure its effectiveness. Initially, the YOLOV8
model undergoes training using the SpaceNet-3
dataset (Figure 4), focusing solely on validating the
proper functioning of the classification process. This
initial training phase is foundational, establishing the
model's ability to accurately categorize building
types.
Function
create_polygon_shapefile(output_shapefile_pa
th, coordinates, reference_crs, names):
DEFINE schema as dictionary with geometry
and properties
OPEN output_shapefile_path with fiona for
writing with specified schema and reference
CRS
FOR EACH (coords, name) pair in
ZIP(coordinates, names):
CREATE polygon from coords
WRITE polygon geometry and
properties to output shapefile
INCREMENT index
RETURN output_shapefile_path
end
Algorithm 2: Creating vector polygons.
Following the successful validation, the pipeline
expands by incorporating the preprocessed Indian
dataset (Figure 5). The YOLOV8 model undergoes a
subsequent round of training over this merged dataset
to enhance its generalization capabilities. This
iterative training approach, involving different
datasets, ensures that the model can effectively
handle diverse scenarios and accurately classify
building types in varied geographical contexts.
Upon completion of the training process, the
pipeline advances to the georeferencing stage. Here,
geospatial information is seamlessly transferred to the
output image, aligning it with real-world coordinates.
This step is crucial for integrating the model's
predictions with the broader geospatial context,
enhancing the practical utility of the results. Finally,
leveraging the geospatial information, the pipeline
generates vector polygons. These polygons
encapsulate the segmented features, providing a
detailed spatial representation of the identified
buildings. The vectorization process transforms
pixel-based segmentations into geometric shapes,
facilitating more
nuanced and interpretable analyses.
Figure 6 shows the entire output of the model
pipeline.
The pipeline's detection and segmentation
components utilize the YOLOV8 detection
framework alongside the Segment Anything (SAM)
model. Performance evaluation involves comparing
this approach to other instance segmentation
frameworks, including YOLOV8-seg and YOLOV5-
seg. Notably, the YOLOV8-seg model outperforms
its counterparts by achieving a higher mean average
precision (mAP) at a 50% intersection over union
(IoU) benchmark (Table 1). With 200 training epochs
conducted on 800 images of 960x960 resolution,
YOLOV8-seg notably completed training in the
shortest time, clocking in at 0.45 hours. The
integration of YOLOV8 for detection and SAM for
segmentation has shown to be comparably effective
to the standalone YOLOV8-seg model.
It's noteworthy that the implementation of this
integrated technique entails a higher time investment
compared to the alternative methods mentioned. In
terms of detection efficiency, the study's showcased
model outshines its counterparts by delivering
quicker inference times. Specifically, the YOLOV8-
seg model achieves an average processing time of
around 400ms for a 960x960 image, encompassing
pre-processing, inference, and post-processing
phases. This contrasts with the YOLOV5's slightly
longer processing time of 415 milliseconds, while the
model proposed here marks a significant
improvement with just 198 milliseconds needed
(Table 1). In practical scenarios, such time
differences might seem negligible for single-image
analysis. However, this time efficiency becomes
critically important when processing multiple images,
highlighting the model's advantage in more
demanding applications.
Table 1: Performance metrics values for different models.
Model Precision Recall mAP Avg.
inference
time (ms)
YOLOV8-seg 0.944 0.892 0.945 400
YOLOV5-seg 0.932 0.844 0.91 415
Proposed
pipeline
0.929 0.838 0.899 198
Automated Georeferencing and Extraction of Building Footprints from Remotely Sensed Imagery using Deep Learning
133
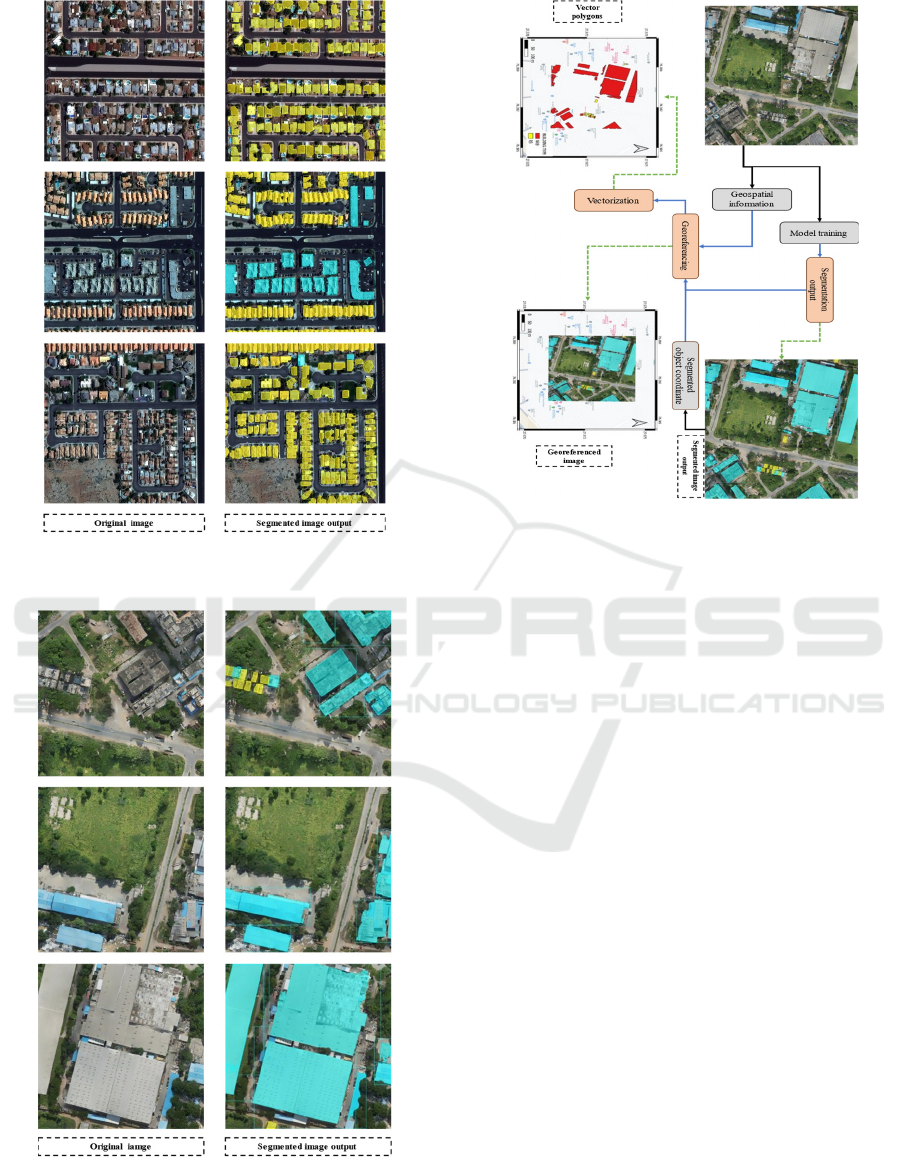
Figure 4: Examples of outputs of the pipeline for SpaceNet-
3 dataset.
Figure 5: Examples of outputs of the pipeline for Indian
dataset.
Figure 6: Example of entire pipeline outputs.
4 CONCLUSIONS
The research leveraged a pre-trained module that
Khatua et al. (2023) introduced to extract distinctive
building features from high-resolution remote-
sensing images. Through comprehensive training and
performance evaluation, the model produced output
images or prediction maps that aligned with the input
images' size, shape, coordinates, and datum. This
consistent alignment facilitates subsequent spatial
analyses, enhancing the interpretability of the results.
In the present scenario, it is noted that the
YOLOV8-seg model outperforms other models in
segmentation tasks. Yet, when considering inference
speed, YOOV8+SAM leads the pack. The success of
SAM in creating inferences is dependent on the
detection capabilities of YOLOV8. This implies that
SAM’s ability to generate quick inferences is closely
linked to how well YOLOV8 can detect objects.
The segmentation output from the pipeline
conspicuously highlights the accurate extraction of
most buildings, complete with relevant categorical
information utilizing high-resolution remotely sensed
images. This study effectively showcases the
application of deep learning techniques to gain
valuable insights into complex urban conditions.
Furthermore, the demonstrated process is versatile,
offering the potential for the application across
GISTAM 2024 - 10th International Conference on Geographical Information Systems Theory, Applications and Management
134

various deep learning model outputs to extract
geospatially relevant information.
ACKNOWLEDGEMENTS
We thank the Indian Institute of Technology
Kharagpur Ranbir and Chitra Gupta School of
Infrastructure Design and Management for financial
and infrastructure support. We thank Aereo
Manufacturing Private LTD. for providing us the
aerial dataset on the Indian context.
REFERENCES
Badrinarayanan, V., Kendall, A., & Cipolla, R. (2017).
Segnet: A deep convolutional encoder-decoder
architecture for image segmentation. IEEE transactions
on pattern analysis and machine intelligence, 39(12),
2481-2495.
Bayati, H., Najafi, A., Vahidi, J., & Gholamali Jalali, S.
(2021). 3D reconstruction of uneven-aged forest in
single tree scale using digital camera and SfM-MVS
technique. Scandinavian Journal of Forest Research,
36(2–3), 210–220. https://doi.org/10.1080/028275
81.2021.1903074
Bharath, H. A., Chandan, M. C., Vinay, S., &
Ramachandra, T. V. (2018). Modelling urban dynamics
in rapidly urbanising Indian cities. The Egyptian
Journal of Remote Sensing and Space Science, 21(3),
201-210.
Dey, M., Prakash, P. S., & Aithal, B. H. (2024). UnetEdge:
A transfer learning-based framework for road feature
segmentation from high-resolution remote sensing
images. Remote Sensing Applications: Society and
Environment, 101160.
Goldberg, H., Brown, M., & Wang, S. (2017). A benchmark
for building footprint classification using orthorectified
RGB imagery and digital surface models from
commercial satellites. In 2017 IEEE Applied Imagery
Pattern Recognition Workshop (AIPR) (pp. 1-7). IEEE.
He, F., Liu, T., & Tao, D. (2020). Why resnet works?
residuals generalize. IEEE transactions on neural
networks and learning systems, 31(12), 5349-5362.
Iglhaut, J., Cabo, C., Puliti, S., Piermattei, L., O'Connor, J.,
& Rosette, J. (2019). Structure from motion
photogrammetry in forestry: A review. Current
Forestry Reports, 5(3), 155-168.
Jocher, G., Chaurasia, A., & Qiu, J. (2023). YOLO by
Ultralytics (Version 8.0.0) [Computer software].
https://github.com/ultralytics/ultralytics
Jocher, G., Nishimura, K., Mineeva, T., & Vilarino, R.
(2020). Yolov5 by ultralytics. Disponı vel em:
https://github. com/ultralytics/yolov5.
Khatua, A., Goswami, A. K., & Aithal, B. H. (2023). Deep
learning-based automatic building types classification
for transport planning. Research for Transport and
Logistics Industry (R4TLI), 8Th International
Conference, Sri Lanka Society of Transport and
Logistics.
Krizhevsky, A., Sutskever, I., & Hinton, G. E. (2017).
ImageNet classification with deep convolutional neural
networks. Communications of the ACM, 60(6), 84-90.
Lindeberg, T. (2012). Scale Invariant Feature Transform.
Scholarpedia, 7(5), 10491.
Ps, P., & Aithal, B. H. (2022). Building footprint extraction
from very high-resolution satellite images using deep
learning. Journal of Spatial Science, 1-17.
Ramachandra, T V &Aithal, Dr. Bharath & M V,
Sowmyashree. (2014). Urban structure in Kolkata:
metrics and modelling through geo-informatics.
Applied Geomatics. 6. 1-16. 10.1007/s12518-014-
0135-y.
Ramachandra, T. V., Aithal, B. H., & Sanna, D. D. (2012).
Insights to urban dynamics through landscape spatial
pattern analysis. International journal of applied earth
observation and geoinformation, 18, 329-343.
Redmon, J., Divvala, S., Girshick, R., & Farhadi, A. (2016).
You only look once: Unified, real-time object detection.
In Proceedings of the IEEE conference on computer
vision and pattern recognition (pp. 779-788).
Schonberger, J. L., & Frahm, J. M. (2016). Structure-from-
motion revisited. In Proceedings of the IEEE
conference on computer vision and pattern recognition
(pp. 4104-4113).
Simonyan, K., & Zisserman, A. (2014). Very deep
convolutional networks for large-scale image
recognition. arXiv preprint arXiv:1409.1556.
Szegedy, C., Liu, W., Jia, Y., Sermanet, P., Reed, S.,
Anguelov, D., ... & Rabinovich, A. (2015). Going
deeper with convolutions. In Proceedings of the IEEE
conference on computer vision and pattern recognition
(pp. 1-9).
Automated Georeferencing and Extraction of Building Footprints from Remotely Sensed Imagery using Deep Learning
135
