
Missing Data Imputation in Daily Wearable Data for Improved
Classification Performance
Mikel Catalina
1 a
, Ander Cejudo
1,2 b
and Cristina Martín
1,2 c
1
Fundación Vicomtech, Basque Research and Technology Alliance (BRTA),
Mikeletegi 57, 20009 Donostia, San Sebastián, Spain
2
Faculty of Engineering, University of Deusto, Avda. Universidades, 24, Bilbao 48007, Spain
Keywords:
Wearables, Artificial Intelligence, Data Imputation and Classification.
Abstract:
In the realm of wearable technology, the continuous monitoring of health parameters through smartwatches
provides a wealth of daily data for research and analysis. However, this data often encounters missing values,
presenting a challenge for interpretation and utilization. Remarkably, there exists a notable gap in the literature
concerning the imputation of missing daily data from smartwatches. To address this gap, our study systemati-
cally explores a diverse set of imputation methods with Fitbit wearable data, encompassing various scenarios
and missing rates. Our primary objectives are: (i) measure the influence of missing values rate and distribution
on the proposed imputation methods; (ii) assess the role of data imputation in enhancing the performance of
machine learning algorithms. Our results underscore the pivotal role of missing data patterns in imputation
method selection. Furthermore, we demonstrate that more advanced data imputation approaches positively
contributes to the efficacy of classification algorithms, improving 4,4% and 0,4% in terms of F-measure for
the proposed classification tasks. This study not only addresses the challenges associated with missing data
in wearable daily monitoring but it also provides practical insights for the optimization of machine learning
applications in health monitoring.
1 INTRODUCTION
The wearable market including wrist wearable de-
vices, has being growing in the last decade reaching
an industry size of 137.89 billion USD in 2022 and
it is expected to continue increasing, reaching 1.300
billion USD by 2035 (Nester, 2023). This technology
allows the continuous and remote monitoring of the
users ’s health parameters.
The utility of wearable devices have turn them into
a suitable tool for research in the healthcare domain,
enabling the development of data analytics, data vi-
sualization and artificial intelligence techniques for
the prevention and analysis of upcoming health events
(Iqbal et al., 2021; Lu et al., 2016). Data gathered
by wearable devices is categorized into two primary
classes in this work: sparse health parameters, which
encompass raw time series collected from wearable
data with frequencies lower than one day, and daily
health statistics, which comprise daily summaries of
a
https://orcid.org/0009-0000-2076-8015
b
https://orcid.org/0000-0001-7944-2706
c
https://orcid.org/0000-0002-3919-2738
sparse health parameters.
Wearable devices include some limitations such
as a finite battery duration, error in the readings of
several parameters for not having the wearable well
tighten, connectivity problems, deterioration of the
hardware components or even the user can forget to
wear it (Baek and Shin, 2017). As a result, the data
gathered from these devices can present significant
time spans without readings, even though removing
the registers would be the easiest procedure, this may
lead to unfavorable outcomes: less data to analyze,
inconsistencies and depending the class of missing
values (more precisely: missing not at random) re-
moving them will cause a biased result (Weber et al.,
2017).
Consequently, several works have attempted to de-
velop and evaluate automatic tools for missing data
imputation, learning the behavioral patterns of the dif-
ferent variables in the data and predicting the missing
values (Buczak et al., 2023). However, there are few
works that have evaluated the effectiveness of differ-
ent data imputation techniques on smart watch data,
and most of them evaluating large time series such as
Catalina, M., Cejudo, A. and Martín, C.
Missing Data Imputation in Daily Wearable Data for Improved Classification Performance.
DOI: 10.5220/0012625500003699
Paper published under CC license (CC BY-NC-ND 4.0)
In Proceedings of the 10th International Conference on Information and Communication Technologies for Ageing Well and e-Health (ICT4AWE 2024), pages 59-72
ISBN: 978-989-758-700-9; ISSN: 2184-4984
Proceedings Copyright © 2024 by SCITEPRESS – Science and Technology Publications, Lda.
59

heart rate or breathing, leaving out a wide range of
daily health statistics.
To address this issue, the main objective of this pa-
per is to evaluate the effectiveness of a wide range of
imputation methods on wearable data in order to im-
prove the classification performance of the proposed
models. In our work we address the following re-
search questions:
• RQ1. Do existing imputation algorithms obtain
better results compared to mean and median meth-
ods (baselines) in wearable data?
• RQ2. Does considering data from previous days
improve the quality of data imputation?
• RQ3. Is the performance of the proposed data im-
putation algorithm better than baselines when the
missing value rate increases?
• RQ4. Does including imputed data in the training
set help to improve the performance of classifica-
tion models?
The structure of the paper is organized as follows.
In section 2, we delve into the previous research con-
ducted by other authors on data imputation techniques
for data obtained from wearables. Section 3 provides
an explanation of the dataset utilized and the prepro-
cessing steps taken. Section 4 explains the techniques
used for data imputation and the different scenarios
where the proposed data imputation algorithms will
be tested. Section 5 shows the results obtained with
the proposed methodology, including a discussion,
whereas section 6 concludes the study by summariz-
ing the key findings.
2 PREVIOUS WORK
There are several works that have addressed the im-
putation of missing values in wearable data. In Lin
et al. (2020), the authors present a deep learning ap-
proach utilizing LSTM layers (Yu et al., 2019) to im-
pute missing heart rate values in time series data ac-
quired from Fitbit and Garmin wearables. Besides,
personal data for each subject is considered separately
for imputation. The authors feed the model with a
set of time series and make use of the adversarial
training (Zhao et al., 2022) to obtain results that im-
prove the performance of baselines, such as linear in-
terpolation (Noor et al., 2015) and moving average.
The proposed method is then tested in two smart-
watch datasets: in the case of the Garmin dataset
(Mattingly et al., 2019) increasing the RMSE (Will-
mott and Matsuura, 2005) score from 4,1% to 58,5%,
whereas in the Fitbit dataset (Faust et al., 2017) the
improvement went from 6,9% to 54,3% both of them
over the baselines and weighing specific periods of
time. In (Feng and Narayanan, 2019) the OMsig-
nal, a wearable that attaches to a shirt, is employed
to obtain various physiological metrics. The authors
decide to impute the missing values in the heart rate
time series, breath and steps time series using a re-
current neural network (Medsker and Jain, 2001) that
considers time dependency of the input to fill the
gaps. The authors develop a model that enhances
the attained scores in comparison to mean imputa-
tion and KNN imputations—chosen as baseline meth-
ods—particularly as missing rates escalate. The au-
thors of Wu et al. (2020), propose a convolutional au-
toencoder (Masci et al., 2011) that has the ability to
evaluate adjacent values to fill in the missing values,
moreover the authors make use of transfer learning
(Bozinovski, 2020) to incorporate the knowledge of a
model trained on wearable data with different users
of Garmin (Mattingly et al., 2019) or Fitbit (Faust
et al., 2017) devices to address the lack of data in
some subjects. The authors conclude that their model
is able to effectively impute data on heart rate time se-
ries. The performance of the model substantially im-
proves the results over the baseline methods obtaining
a 4,67% reduction of MAPE (De Myttenaere et al.,
2016) throughout two different datasets and distinct
test scenarios. Other studies as in (Huo et al., 2022),
consider accelerometer, gyroscope and magnetome-
ter data collected from smartphones with a frequency
of 20 seconds. Following the example of Wu et al.
(2020), the authors opted for the implementation of
an autoencoder (Bank et al., 2023), which comprises
LSTM layers to capture and retain information from
previous inputs. This design allows the model to con-
sider the temporal dependency of the input data. The
achieved results surpassed those of baseline methods,
including mean imputation, KNN, and random for-
est models. Notably, there was a substantial mean in-
crease in accuracy of 6,25% when the missing rate
values exceeded 10%. Additionally, increasing in the
rate of missing values does not have a significant im-
pact in the performance of the model as in this work
for certain methods.
There are numerous works that have studied the
utility of daily health statistics reported by wearable
devices. In Sathyanarayana et al. (2016), the Acti-
Graph GT3X+ (Aadland and Ylvisåker, 2015) wear-
able is used to monitor the sleep of different sub-
jects. The objective of this study is to predict the
sleep efficiency of the user, differentiating between
good (SE > 85%) and bad sleep (SE < 85%). For
that, recorded physical activity of the same day ob-
tained from accelerometers is considered. They pro-
ICT4AWE 2024 - 10th International Conference on Information and Communication Technologies for Ageing Well and e-Health
60

posed various deep learning methods reaching a 89%
accuracy for their best one, a LSTM based neural net-
work. The research conducted in Conroy et al. (2022)
with Garmin smartwatches, Oura rings and Empat-
ica E4 wristbands aimed to detect Covid-19 with the
recorded physiological metrics. First of all, they stan-
dardize the metrics from different wearables, getting
a time series with a sampling frequency of 10 min-
utes (this allows to merge breath and heart param-
eter from different devices). Once the data is stan-
dardized, cleaning is done according to the adequate-
ness of sleep data. Using machine learning models an
AUC of 0,82 and an F-score of 0,44 is achieved for
the prediction of Covid-19. In the work of Kanokoda
et al. (2019), a glove is made in order to collect data
from strain sensors located in three fingers to predict
hand gestures via a TDNN (Längkvist et al., 2014)
deep learning model. Attaining a model capable of
real-time result prediction, achieving a mean accuracy
of 84,6% when forecasting the next 10 steps, decreas-
ing to 61.1% when considering 30 steps ahead. In
the study conducted in Zhu et al. (2020), daily data
from various smartwatches, including Fitbit and Ap-
ple Watch, was collected from a substantial cohort of
30.529 participants over a two-month period. The
primary goal of this study was to monitor the out-
break of Covid-19 and predict potential infections.
Lastly, both Ghandeharioun et al. (2017) aim to pre-
dict depression based on wearable data. According
to Ghandeharioun et al. (2017), the authors employ
E4 wristbands and the smartphone usage data that
then is aggregated in both, intervals of 6 hours and
days. They introduce the data on an ensemble ma-
chine learning method to predict the Hamilton De-
pression Rating Scale (Williams, 2001). Achieving
an RMSE of 4,5 on the test exercise. The results sug-
gest that the information provided by health metrics
gathered from wearable devices can monitorize wear-
ers with the recorded data.
This study aims at assessing the impact of a di-
verse range of imputation methods on daily health
statistics derived from wearable devices. Notably, ex-
isting research predominantly focuses on the influ-
ence of various data imputation algorithms on time
series data obtained from wearables. However, there
is a significant gap in understanding how these algo-
rithms perform when applied to daily health statis-
tics obtained from wearable devices. Moreover, while
daily health statistics from wearables have been uti-
lized in various artificial intelligence tasks, the inves-
tigation into the effects of imputation algorithms on
commonplace tasks, such as classification, remains
largely unexplored.
3 MATERIALS
The popularity of wearable devices has increased
to such an extent that using their data is becoming
more frequent (Lu et al., 2016). This has led to
several datasets employed by previous works: Faust
et al. (2017), Tesserae project (Mattingly et al., 2019),
WISDM (Weiss, 2019), Bent et al. (2021), harAGE
presented in (Mallol-Ragolta et al., 2021), Vaizman
et al. (2017) and PMData (Thambawita et al., 2020).
As for private datasets, in Faust et al. (2017), a
smartphone and Fitbit dataset is introduced, where the
Fitbit smartwatch is given to approximately 700 stu-
dents for two different periods of time. The Tesserae
project (Mattingly et al., 2019) collects data from 757
workers over a year using Garmin smartwatches col-
lecting capturing heart rate, sleep and calories data.
As for public datasets, in Weiss (2019), the WISDM
is introduced, consisting of accelerometer and gyro-
scope data obtained from the LG G Watch and smart-
phones of 51 people while performing certain ac-
tions. The dataset discussed in Bent et al. (2021), fo-
cuses on data collected using the Empatica 4 wrist-
band, which gathers information such as heart rate
(HR), blood volume pulse (BVP), and interbeat in-
terval (IBI). Additionally, data from glucose sensors
is included, involving a total of 16 subjects observed
over a period ranging from eight to ten days. The
harAGE dataset (Mallol-Ragolta et al., 2021) records
data of Garmin smartwatches of 30 people perform-
ing various physical activities. Lastly, a public dataset
is introduced in Vaizman et al. (2017) where the au-
thors collect data from both, pebble smartwatches and
smartphones from a group of 60 people reaching a to-
tal of 300k minutes of data focusing on accelerometer
and gyroscope sensors, although location and audio
data is collected as well.
Our work is focused on the PMData (Thambawita
et al., 2020) database. The dataset consists of data
collected from 16 individuals throughout a period of
five months (November 2019 to end of march 2020)
and using the Fitbit Versa 2 smartwatch. This smart-
watch is capable of detecting different states of physi-
cal activity such as time exercising or being sedentary
as well as heart rate, kcal burnt, steps and sleep data,
each being collected in different time frequencies. For
instance, a heart rate value is stored each five seconds
while the time stayed active is accumulated for each
day. The availability of the data given by the original
authors can be seen in table 1. Aside from the smart-
watch data, additional information from each subject
is gathered as well: age, weight, coronary prone be-
haviour (Johnston, 1993), sex etc. However, due to
the scope of this work subject data will be only con-
Missing Data Imputation in Daily Wearable Data for Improved Classification Performance
61

Table 1: Categorization of the variables recorded and computed from the Fitbit smartwatch into two separate groups: daily
health statistics and sparse health parameters. For each variable the sample frequency of the wearable device is provided.
Group Category Data Frequency
Sleep data
Waso sleep, sleep latency, rem latency,
total sleep time, time rem, time light,
time deep, time awake and SRI
Daily
Daily health statistics Activity Kcal and steps Daily
Heart rate
Maximum, minimum, standard deviation
and mean values
Daily
Heart rate Beats per minute Per 5 seconds
Sparse health parameter Exercise/activity Distance, steps and kcal Per minute
Sleep data Sleep phases and sleep score When happens
sidered as label in the classification problem in order
to characterize users given solely the data collected
from smartwatch.
Given the circumstances described previously in
section 2, the PMData dataset is the only one, to the
best of our knowledge, that collects a wide range of
physiological parameters: heart, sleep data and sports
data among others, reaching a total of 16 daily health
statistics, and does not focus on HAR (Human Activ-
ity Recognition). This number of variables is promi-
nent for this study and the volume of data is public
and large enough to test a wide range of imputation
methods.
As stated, values collected from wearables are
stored as a time series and converted to tabular data,
where each row represents the temporal component
and each column the different daily health statistics.
Then, the data is aggregated by day, reducing signif-
icantly the number of rows. In addition, the data ob-
tained from the wearable lets us compute other vari-
ables such as SRI (i.e. Sleep Regularity Index, aver-
aged over 7 days) (see eq. (1)) where N is the num-
ber of days and M is the number of epochs per day.
The function δ(s
i, j
, s
i+1, j
) is equal to one, when the
sleep–wake state is the same 24 hours apart. Other
example is WASO (Wakefulness After Sleep Onset)
sleep (see eq. (2)), which is computed taking into ac-
count TST (Total Sleep Time) and the sleep period.
Note that this variables are related to sleep but sleep
efficiency depicts a more complete assessment of the
sleep quality.
SRI = 100 −
200
M(N − 1))
M
∑
j=1
N
∑
i=1
δ(s
i, j
, s
i+1, j
) (1)
WASO = Sleep period − T ST (2)
Once the data is sorted and aggregated by day,
missing values are found in the recorded data. In ta-
ble 3, a small sample of the dataset is shown for a
given user. Every row of the table corresponds to a
day of a specific user, whereas each of the columns
corresponds to each of the daily health statistics that
have been either collected or calculated from the Fit-
bit smartwatch.
After the preprocessing, the data contains 2.397
days from which 603 have at least one missing value.
However, the subject referred as "p12" by Tham-
bawita et al. (2020) has only sleep registers for 3
days from the 152 days that lasted the study. For this
reason, the data of the subject is not representative
enough and the subject is removed from the study. A
brief analysis of the data is shown in table 2 for the
train and test subsets in both classification tasks: sleep
efficiency and personality. The difference between
these two tasks is how the data has been divided. For
sleep efficiency, data has been randomly selected for
training, whereas the remaining data without miss-
ing values has been used for testing the imputation
methods. Leaving test data without missing values let
us evaluate classification algorithms with and without
imputation methods in the training subset, under the
same conditions. The same happens with personality,
but this label does not vary per user, thus, data has
been split by user, leaving 10 users for training and
the rest for testing.
4 METHODOLOGY
This section presents the methodological approach
employed on the study. In subsection 4.1 the algo-
rithms employed for data imputation are presented,
whereas 4.2 presents the two evaluation approaches.
Finally, subsection 4.3 explains the classification
tasks after data have been imputed.
4.1 Data Imputation Methods
This section presents the selected imputation meth-
ods, grouping them in baseline, column-based and
ICT4AWE 2024 - 10th International Conference on Information and Communication Technologies for Ageing Well and e-Health
62

Table 2: Description of the dataset gathered from Fitbit wearable devices and employed in this study. The dataset has been
split into train and test subsets in order to evaluate different classification algorithms in each of the proposed classification
tasks: personality and sleep efficiency.
Personality Sleep efficiency
Train Test Train Test
Total % Total % Total % Total %
Users 10 66% 5 34% 15 100% 15 100%
Instances 1.600 71,2% 645 28.7% 1.648 73,4% 597 26,5%
Missing values at random 1.575 8,7% 0 0% 1.600 8% 0 0%
Missing values at random per user 157,5 9,4% 0 0% 106,6 7,7% 0 0%
Missing values at lines 159 10,6% 0 0% 191 11,5% 0 0%
Missing values at lines per user 15,9 10,5% 0 0% 12,7 10,6% 0 0%
Consecutive missing values 2.878 72,6% 0 0% 2.941 74,7% 0 0%
Consecutive missing values per user 14,4 8,4% 0 0% 9,33 16,6% 0 0%
Personality label
A 989 44% 361 16,1% – – – –
B 611 27,2% 284 12,6% – – – –
Sleep efficiency label
< 85 (Normal / Bad) – – – – 171 7,6% 65 2,8%
≤ 90 (good) – – – – 825 36,7% 286 12,7%
≤ 95 (Very good) – – – – 602 26,8% 246 10,9%
Table 3: Sample of the dataset for a given user and for different daily health statistics, including TST (i.e. Total Sleep Time),
mean_hr (i.e. mean heart rate) and std_hr (i.e. standard deviation of heart rate).
user_id waso_sleep sleep_efficiency TST kcal steps ... mean_hr std_hr
P01 20 94,88 391 3.912,61 16.450 ... 64,78 14,57
P01 10 97,63 422,5 4.014,13 17.843 ... 64,82 17,05
P01 6 98,31 356 3.614,06 12.519 ... 68,15 22,08
P01 16 96,21 423 3.386,19 10.392 ... 63,91 13,30
P01 24 93,35 361 3.312,92 11.185 ... 62,41 12,58
row-based algorithms. The proposed approaches have
been widely used by previous works, excluding those
methods that require large amounts of data like re-
current neural networks (Medsker and Jain, 2001),
LSTM based networks (Yu et al., 2019) and trans-
formers (Vaswani et al., 2017), which are not feasible
as daily health statistics are recorded on a daily basis.
The imputation methods used are the following:
• Baselines. Baseline methods are considered the
easiest approach for data imputation (Engels and
Diehr, 2003). More complex approaches are ex-
pected to significantly increase the performance
compared to these methods. In this way, other ap-
proaches can be compared and considered suffi-
cient in order to be applied as input for a classifi-
cation task.
– Mean. Sets the mean for each feature respec-
tively on all the missing values of the same fea-
ture.
– Median. In this case, the median of each pa-
rameter is set respectively in the missing val-
ues.
• Column-Based. Includes methods that use as in-
put the historical data recorded for each health pa-
rameter. For that, a model is trained for each daily
health statistics and the missing values are pre-
dicted using as input of the algorithm the previous
w values of previous days. Thus, w is a key hyper-
parameter that is tuned in order to maximize the
performance of the column-based methods. The
optimal w value will depend on the rationale be-
hind each of the proposed methods.
– Moving Average. Each missing value found
on the recorded daily health statistics will be
replaced by the mean of the last known values
of each parameter (Hyndman, 2011).
– LOCF (Last Observation Carried Forward).
This method takes the last observation before a
missing value and drags it to the missing value.
Note that if there are several missing values to-
gether, the same value will be imputed for all of
them (Twumasi-Ankrah et al., 2019).
Missing Data Imputation in Daily Wearable Data for Improved Classification Performance
63

– Linear Interpolation. The linear interpolation
fits a line between the last known value and the
next known value. With this, missing values
distributed together are imputed depending on
the amount of missing values. If only one is
missing the midpoint is used. In the case of
3 missing values the quartiles are used (Noor
et al., 2015).
– SVM. A support vector machine regressor al-
gorithm that predicts the missing value depend-
ing on the previous values of the same feature
(Boser et al., 1992).
– RF. A random forest regressor algorithm that
imputes the missing value taking into account
the last values of the same feature (Breiman,
2001).
– ARIMA. Auto Regressive (AR) Integrated (I)
Moving Average (MA) models, are statistic
models used for time series were given a set
of values the next one can be predicted. This
model consists of 3 parameters: p, d and q each
one refers to each of the acronyms respectively
(Box, 2013).
– KNN. This is a variation of KNN, where the
values taken to estimate the neighbours are the
previous values of the feature. Besides, this
method evaluates the amount of missing val-
ues placed together and if there are more than
one, the first missing value will be imputed and
then, the last one evaluating the next values to
the missing value. Lastly, a linear gradient is
applied to the values this way the method has
the ability to weight the feature values with the
time.
• Row-Based. Methods that use as input other daily
health statistics recorded in the same day. Thus, in
this case, data imputation consists in a regression
task and every time a value is imputed, a model is
trained considering the daily health statistics with
known value in the day corresponding to the miss-
ing value. For example, if for a given day the total
sleep time must be imputed and the other daily
health statistics with known value are burnt calo-
ries and steps, a model is trained considering just
those two features to predict total sleep time, in-
cluding the data available of all the users.
– RF. A random forest algorithm that imputes the
missing values depending on the values of other
features gathered the same day, as for KNN, if
all the day is missing the mean of each daily
health statistics is imputed (Breiman, 2001).
– KNN. K-nearest neighbour takes the values
of other known variables on the same day
and computes the distance (uniform weights so
all points in each neighborhood are weighted
equally) between other days. Once the dis-
tances are computed, the K-nearest neighbours
are considered to fill the value. This method
is obtained using the KNN imputer from (Pe-
dregosa et al., 2011).
Some of the selected methods are also considered
as baselines for many studies that tackle wearable
time series imputation. For example, mean imputa-
tion is used in Feng and Narayanan (2019); Huo et al.
(2022), other studies as Lin et al. (2020) consider Lin-
ear interpolation, moving average and LOCF. KNN is
widely used as baseline method as can be seen in Feng
and Narayanan (2019); Huo et al. (2022); Lin et al.
(2020). Lastly, Huo et al. (2022) considers random
forest approaches as well.
Before data imputation is carried out with the
aforementioned algorithms, a "MinMaxscaler" (Pe-
dregosa et al., 2011) is applied to standardize data
as the daily health statistics are in different magni-
tudes. This method turns the maximum value of each
feature to one and the minimum value to zero, being
the rest of the values converted proportionally. This
is done in order to compare the selected imputation
methods, making all metrics weigh the daily health
statistics equally.
4.2 Missing Data Scenarios
The distribution of the missing values may impact the
performance of the proposed approaches for data im-
putation. For this reason, the proposed methodology
aims at evaluating the methods for data imputation in
different scenarios and with an increasing number of
missing values in order to address the first and sec-
ond research questions. In this work, two scenarios
have been considered: missing values at random and
missing values at lines. These scenarios are depicted
in Fig. 1, where first, days without missing values
are selected and second, missing values are added for
evaluation of the proposed methods.
Evaluation for the imputation methods was car-
ried out creating missing values. For that, clean data
is obtained removing days with at least one missing
value and thus, only days with complete readings for
all the daily health statistics are considered. Then,
missing values are generated by removing known val-
ues randomly for each of the missing data scenarios.
Finally, each of the proposed methods is applied to
estimate the missing values and compare it with the
actual value, where the method that assigns the clos-
est value to the actual is considered to have the best
performance. In the case of missing values at lines,
ICT4AWE 2024 - 10th International Conference on Information and Communication Technologies for Ageing Well and e-Health
64

Figure 1: The proposed two missing value scenarios from clean data to evaluate the selected data imputation methods: missing
values at random and missing values at lines.
the range of applicable methods is reduced, as there
are no other daily health statistics in the same day to
be used for these methods. Thus, only baseline and
column-based methods are used in this scenario.
The rationale behind the proposed methods may
lead to significantly different results, depending on
the missing values scenario and rate. For that reason,
both data imputation scenarios have been simulated
increasing the rate of missing values at random in
the first scenario and the number of days without any
recording in the second scenario. Note that missing
values at lines (days) comes closer to the reality of the
wearables as explained in Chakrabarti et al. (2023).
Each scenario is executed ten times to enhance re-
liability. This repetition is essential because, in ev-
ery iteration, the missing values are placed in differ-
ent segments of the dataset. Running the various al-
gorithms only once may lead to biased or unrealistic
results, as they could adapt too easily to those specific
missing values in a single run.
4.3 Classification
In order to answer the fourth research question pro-
posed in section 1, several machine learning algo-
rithms are proposed to be trained and then, to assess
the effect of the imputed data in different classifica-
tion problems. In this case, all the data is considered
including days with missing values for both the train
subset.
Classification models have been tested splitting
the data into train and test subsets and assuring that
there is not imputed data on the test subset. Thus,
days without any missing values have been consid-
ered for test and the rest for training the classifica-
tion algorithms. Then, the missing values in the train
set are imputed with the best algorithm for the spe-
cific scenario and rate of missing values. Finally, sev-
eral algorithms are trained with the imputed train set
and evaluated in the test set, using the F-score and
the accuracy metrics. Beside this, various feature se-
lection methods are used to improve the representa-
tion of the input and increase overall performance of
the classification algorithms: lasso penalty (Kim and
Kim, 2004), fisher test (Gu et al., 2012) and decision
tree feature importance (Grabczewski and Jankowski,
2005). The overall data distribution for both the train
and the test subsets for the classification exercise can
be seen in table 2.
The proposed classification models are the fol-
lowing: SVM (Support Vector Machine)(Boser et al.,
1992), KNN (K-Nearest Neighbour)(Peterson, 2009),
Linear regression (Montgomery et al., 2021), decision
tree (Quinlan, 1986), Random forest (Breiman, 2001),
feed forward neural network (Sazli, 2006) and a gra-
dient boosting trees method (Friedman et al., 2000),
in each of them various models are created changing
different hyper parameters.
5 RESULTS
In this section, the results obtained after applying the
proposed algorithms in section 4 are discussed. In
subsection 5.1 the evaluation metrics for both the data
imputation and classification tasks are explained. In
subsection 5.2 the results for the missing values at
random scenario are shown whereas in subsection 5.3,
the results of the missing values at lines scenario are
discussed. In subsection 5.4, classification models are
trained to asses the effect of the imputed data and
lastly, in subsection 5.5 the results obtained are fur-
ther discussed.
5.1 Evaluation
Evaluation of the methods has been carried out com-
puting various metrics. The metrics considered for
Missing Data Imputation in Daily Wearable Data for Improved Classification Performance
65

data imputation are the Mean Absolute Error (see eq.
3) and Mean Square Error (see eq. 4) which mea-
sure the difference between the imputed and the ac-
tual value.
MAE =
1
n
n
∑
i=1
|
y
i
− ˆy
i
|
(3)
MSE =
1
n
n
∑
i=1
(y
i
− ˆy
i
)
2
(4)
In both eq. (3) and (4) y
i
stands for the actual value
and ˆy
i
stands for the predicted value by the data impu-
tation algorithm. A MAE or MSE close to 0 indicates
a good performance with a prediction close to the ac-
tual value.
Finally, the evaluation of the classification task is
made by means of F-score (see eq. 5) and the accu-
racy (see eq. 6)(Vujovi
´
c et al., 2021). Both metrics
give a value between 0 and 1, being 1 a perfect clas-
sification score.
F1 = 2 ·
Precision · Recall
Precision + Recall
(5)
accuracy =
T P + T N
T P + T N + FP + FN
(6)
5.2 Missing Values at Random
The objective of these experiments, is to evaluate the
performance of different data imputation algorithms
when the distribution of missing values is random and
with an increased rate of missing values. For that, as
explained in section 4, three types of data imputation
algorithms are employed: baselines, row-based and
column-based methods. The results of these methods
can be seen in Fig. 2a with a missing values rate rang-
ing from 5% to 70%.
Preliminary experiments were carried out for each
of the proposed algorithms, testing the identical
model with various parameters and assessing which
configuration yielded the best performance. The de-
tailed results can be found in table 4.
Comparing all the method types, when the ratio of
missing values changes from 5 to 70%, the mean rela-
tive performance in terms of MAE curiously increases
1% for baselines and decreases 5,65% for column-
based methods and 42,3% for row-based methods.
These results suggest that row-based methods have
a significant decrement when the number of missing
values increases.
In addition, the results indicate that row-based
methods obtain the best performance when missing
value rates are lower than 35%. When missing rates
are lower than 30%, RF achieved better results than
KNN scoring an average MAE enhancement of 0,011
while KNN outperforms RF in higher missing (40 to
70%) rates averaging a 0,004 improvement. However,
both methods showed a relative improvement respect
to the best column-based method, the KNN, of 25%
and 11% (averaged for 5% to 30%), respectively.
When the number of missing values rate reaches
50%, column-based KNN algorithm achieves a rela-
tive improvement of nearly 7,5% compared to row-
based RF method in terms of MAE. In addition,
the mean performance of column-based methods im-
proves the mean performance of row-based methods
in a 13%, indicating that it is more convenient a
column-based approach over the 50% of missing val-
ues.
Comparing baseline methods with the best row-
based method, the RF, and the best column-based
method, the KNN, the results show a improvement of
23% and 18% respectively. In this scenario, baseline
methods do not improve the results achieved by other
methods.
All the proposed methods significantly improve
the baselines except for LOCF, which achieves the
worst performance in all the missing rates. Although
the LOCF method performs reasonably well in time
series data due to short intervals between samples, it
is less effective in this context, where each parameter
is registered on a daily basis.
Among the column-based methods, the KNN and
the RF scored very similar results, but the KNN
achieved an average of 6% MAE improvement com-
pared to the RF.
As a conclusion, row-based methods achieve the
best data imputation performance with a low missing
values ratio. Having a ratio of missing values higher
than the 35% the column-based methods would be the
best suited for imputation. Although the difference
in performance between some of the column-based
methods is small, KNN method averaged the best re-
sults. Lastly, the baselines showed robustness to the
missing rate and only scored consistently better than
LOCF which, as stated, is not suitable for this task.
5.3 Missing Values at Lines
Similarly, in this set of experiments the proposed
algorithms are evaluated with an increasing rate of
missing values. In this case, missing values are
present in the whole day, consequently, row-based
methods cannot be used. The objective of these exper-
iments is to evaluate the proposed methods in a miss-
ing values distribution closer to the reality of wearable
devices, including the limitation of not being able to
use other daily health statistics from the same day for
data imputation.
The same missing rates as in the first scenarios
ICT4AWE 2024 - 10th International Conference on Information and Communication Technologies for Ageing Well and e-Health
66
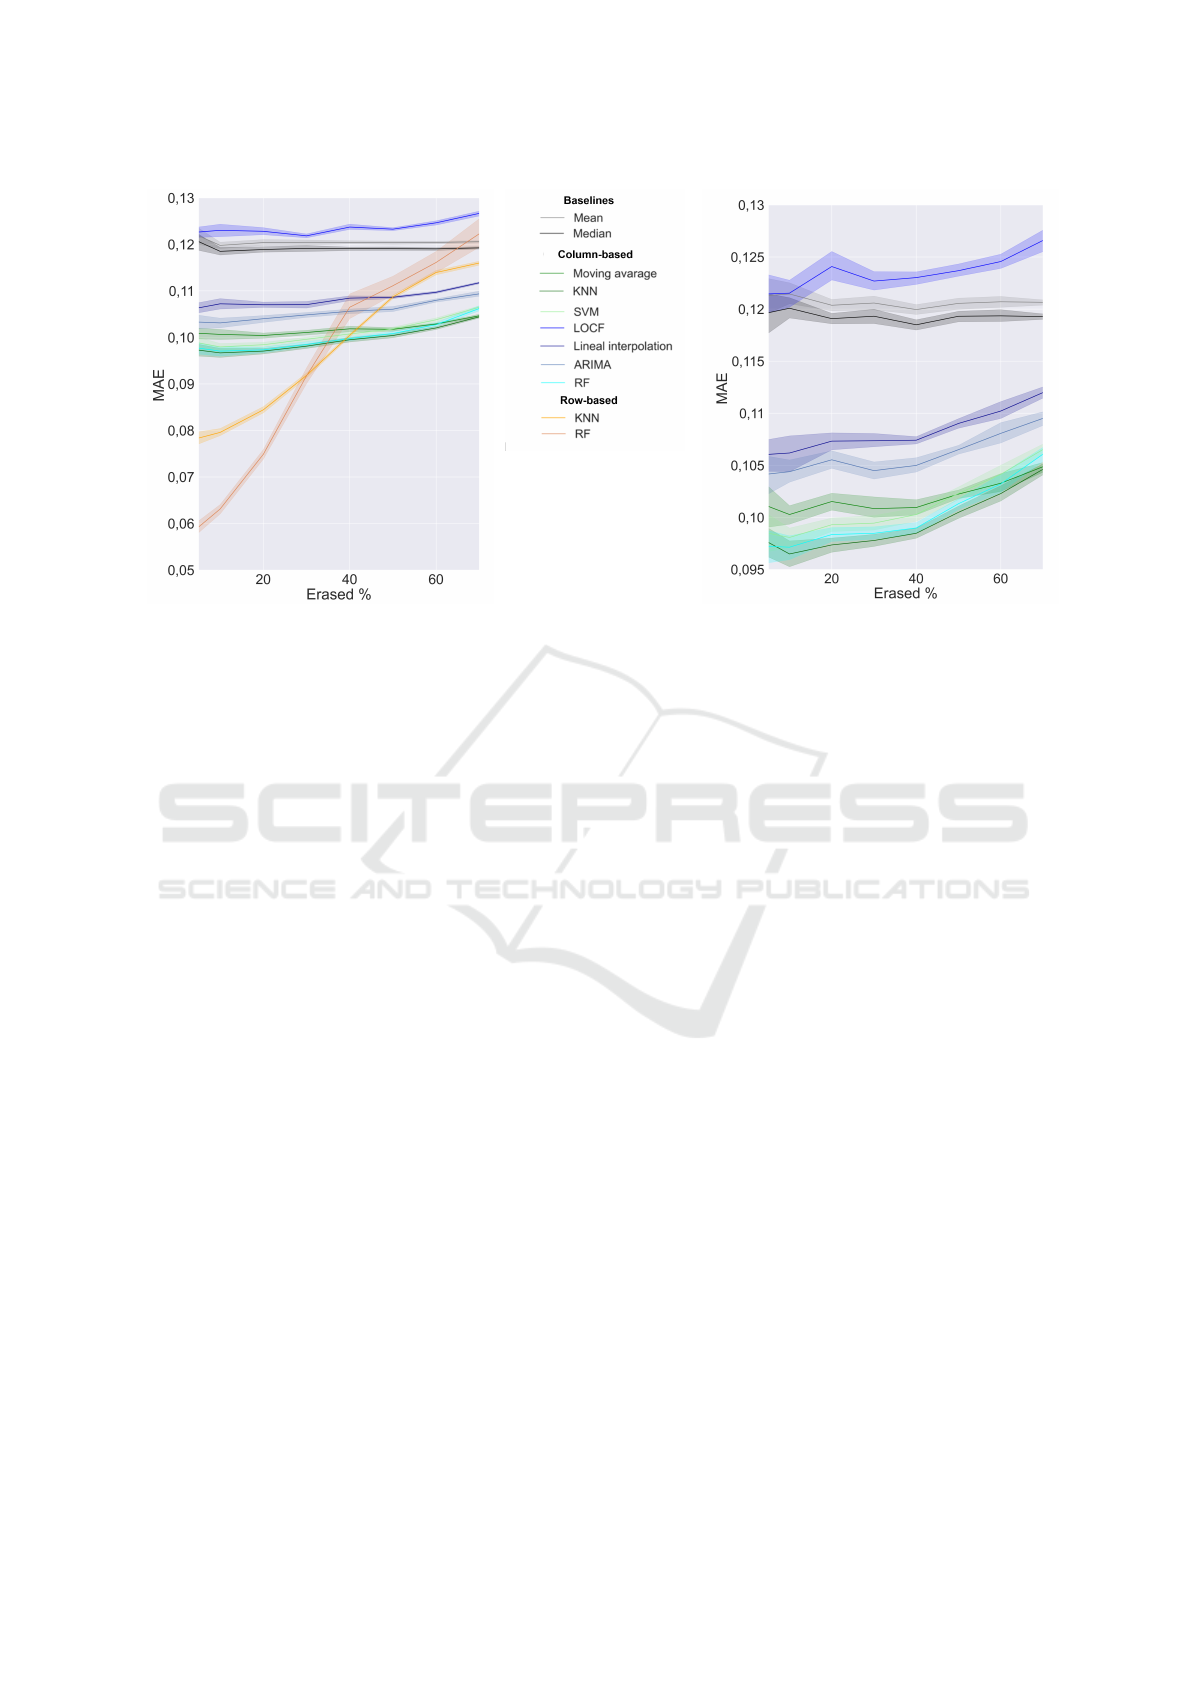
(a) Missing values at random. (b) Missing values at lines.
Figure 2: Normalized MAE (y axis) for various imputation methods with an increasing rate of artificially generated missing
values (x axis). Shaded areas show both the maximum and minimum MAE for each method across multiple runs for each
percentage of missing values. Scale over y axis is different in the second image to stand out the trend of column-based
methods.
have been tested for this scenario, the performances
of the methods is shown in Fig. 2b. Following
the same proceeding, the hyperparameters have been
tuned for this experiment as well. The detailed results
are shown in table 5.
In the column-based approaches, the MAE scores
are similar in both the first and last rate of missing
values. Methods showed a 6% decrease in perfor-
mance when these points are compared. Once more,
the baseline methods demonstrate notable resilience
to missing data by scoring 4% better at 70% of miss-
ing rate, surpassing LOCF in performance.The ratio-
nale of the poor performance has is the same as men-
tioned in section 5.2.
Once more, the KNN proved to be the the top-
performing method, achieving overall a 18% im-
provement over the baseline methods and 1% over the
second best method the RF, making it the best option
for data imputation using information from previous
days.
In both scenarios, the SVM was the column-based
method that most suffered from the missing rate in-
crease, with an 8% worsening over the missing rate
making it unreliable when the missing values rate is
high.
In conclusion, both baseline methods and column-
based methods exhibit no significant variation based
on the distribution of the missing values, averag-
ing similar scores in both scenarios. Regardless of
the missing value pattern, KNN consistently demon-
strated superior performance as the top-performing
column-based method.
Based on the results obtained and acknowledging
the linear pattern of missing values in the dataset, the
KNN is employed as the optimal imputation method
for conducting the classification experiment. Results
of applying the model to the dataset can be seen in
Fig. 3. In this instance, the variables TST (Total
Sleep Time) and steps for the user ’p15’ are displayed,
where the column-based KNN effectively replicates
the variations in the original data. However, there are
cases where imputation may deviate from reality, as
observed in the steps imputation towards the conclud-
ing dates, where the KNN placed a noticeable peak.
5.4 Classification
In this set of experiments, two classifications prob-
lems have been proposed in order to asses the ef-
fectiveness of data imputation when training machine
learning models. The goal of data imputation in this
work is to extend the data that can be used to train
the classification models, if imputation is carried out
correctly and information is restored from the miss-
ing values, we hypothesize that overall performance
of the predictive models should be increased.
More specifically, the first classification task con-
sists in the prediction of the sleep efficiency of each
day considering the rest of the daily health statistics
(Johnston, 1993). In this case, the data is split ran-
Missing Data Imputation in Daily Wearable Data for Improved Classification Performance
67

Table 4: Mean MAE and MSE for 5 to 70% of artificially generated missing values at random scenario.
5% 20% 50% 70%
Method MAE MSE MAE MSE MAE MSE MAE MSE
Baselines
Mean 0,1218 0,0241 0,1203 0,0236 0,1203 0,0237 0,1205 0,0237
Median 0,1205 0,0248 0,1189 0,0242 0,1190 0,0243 0,1192 0,0243
Column-based
Moving average 0,1008 0,0186 0,1004 0,0184 0,1028 0,0189 0,1046 0,0198
KNN 0,0972 0,0172 0,0970 0,0169 0,1004 0,0180 0,1044 0,0194
LOCF 0,1226 0,0285 0,1228 0,0285 0,1246 0,0286 0,1266 0,0300
Linear interpolation 0,1064 0,0212 0,1070 0,0214 0,1086 0,0219 0,1117 0,0231
ARIMA 0,1032 0,0194 0,1040 0,0198 0,1060 0,0204 0,1093 0,0202
SVM 0,0988 0,0174 0,0984 0,0173 0,1018 0,0183 0,1065 0,0196
RF 0,0977 0,0171 0,0973 0,0169 0,1008 0,0181 0,1062 0,0199
Row-based
KNN 0,0783 0,0117 0,0844 0,0133 0,1087 0,0203 0,1159 0,0255
RF 0,0592 0,0085 0,0748 0,0118 0,1111 0,0216 0,1222 0,0253
Table 5: Mean MAE and MSE for 5 to 70% of artificially generated missing values at lines scenario.
5% 20% 50% 70%
Method MAE MSE MAE MSE MAE MSE MAE MSE
Baselines
Mean 0,1213 0,0240 0,1203 0,0236 0,1205 0,0238 0,1206 0,0237
Median 0,1196 0,0246 0,1190 0,0243 0,1193 0,0245 0,1192 0,0243
Column-based
Moving Average 0,1010 0,0188 0,1015 0,0190 0,1022 0,0191 0,1048 0,0195
KNN 0,0976 0,0171 0,0973 0,0172 0,1004 0,0181 0,1046 0,0194
LOCF 0,1214 0,0281 0,1240 0,0293 0,1236 0,0289 0,1265 0,0301
Linear interpolation 0,1060 0,0210 0,1073 0,0216 0,1092 0,0221 0,1119 0,0234
ARIMA 0,1041 0,0200 0,1055 0,0205 0,1065 0,0206 0,1095 0,0215
SVM 0,0984 0,0174 0,0993 0,0178 0,1023 0,0185 0,1065 0,0196
RF 0,0972 0,0171 0,0983 0,0174 0,1013 0,0184 0,1060 0,0198
domly regardless the user. The second classification
task is to predict the behaviour of the user based on
the daily health statistics. In this case, a user has the
same behaviour regardless the day and the data is split
into train and test subsets by user. That is, the same
user does not appear in both the train and test subset
as only one subset is considered for a user. A more de-
tailed description of the data and labels used for each
classification tasks can be found in table 2. In table 6
the results for the classification tasks are shown with
and without data imputation for the best method in
each case, for simplicity.
For personality classification, the model that
reached the best results was the logistic regression
with Lasso’s penalty (Ranstam and Cook, 2018) re-
gardless of the imputation that is applied. For the pre-
diction of the sleep efficiency, the best model was the
neural network when missing values are filled. With-
out imputation, however, the support vector machine
classifier achieved the best performance.
In the case of personality the F-score improved by
4,4% while the accuracy scored 2,9% higher. In the
case of sleep efficiency, although the enhancements
were not as pronounced as those seen in personality,
both the F-score and the accuracy went up by 0,3%.
Thus, it is made clear that both classification task are
benefited when data is imputed and added to the train-
ing set.
As previously noted, there is considerable varia-
tion in the improvement of the models between the
classification tasks. This variability could be at-
tributed to the fact that in sleep efficiency, the value
itself is imputed, underscoring the critical importance
of ensuring accurate imputation for the feature.
5.5 Discussion
The results of the experiments showed that imputation
of data is beneficial for the proposed classification
methods. Addressing the research questions, the im-
ICT4AWE 2024 - 10th International Conference on Information and Communication Technologies for Ageing Well and e-Health
68
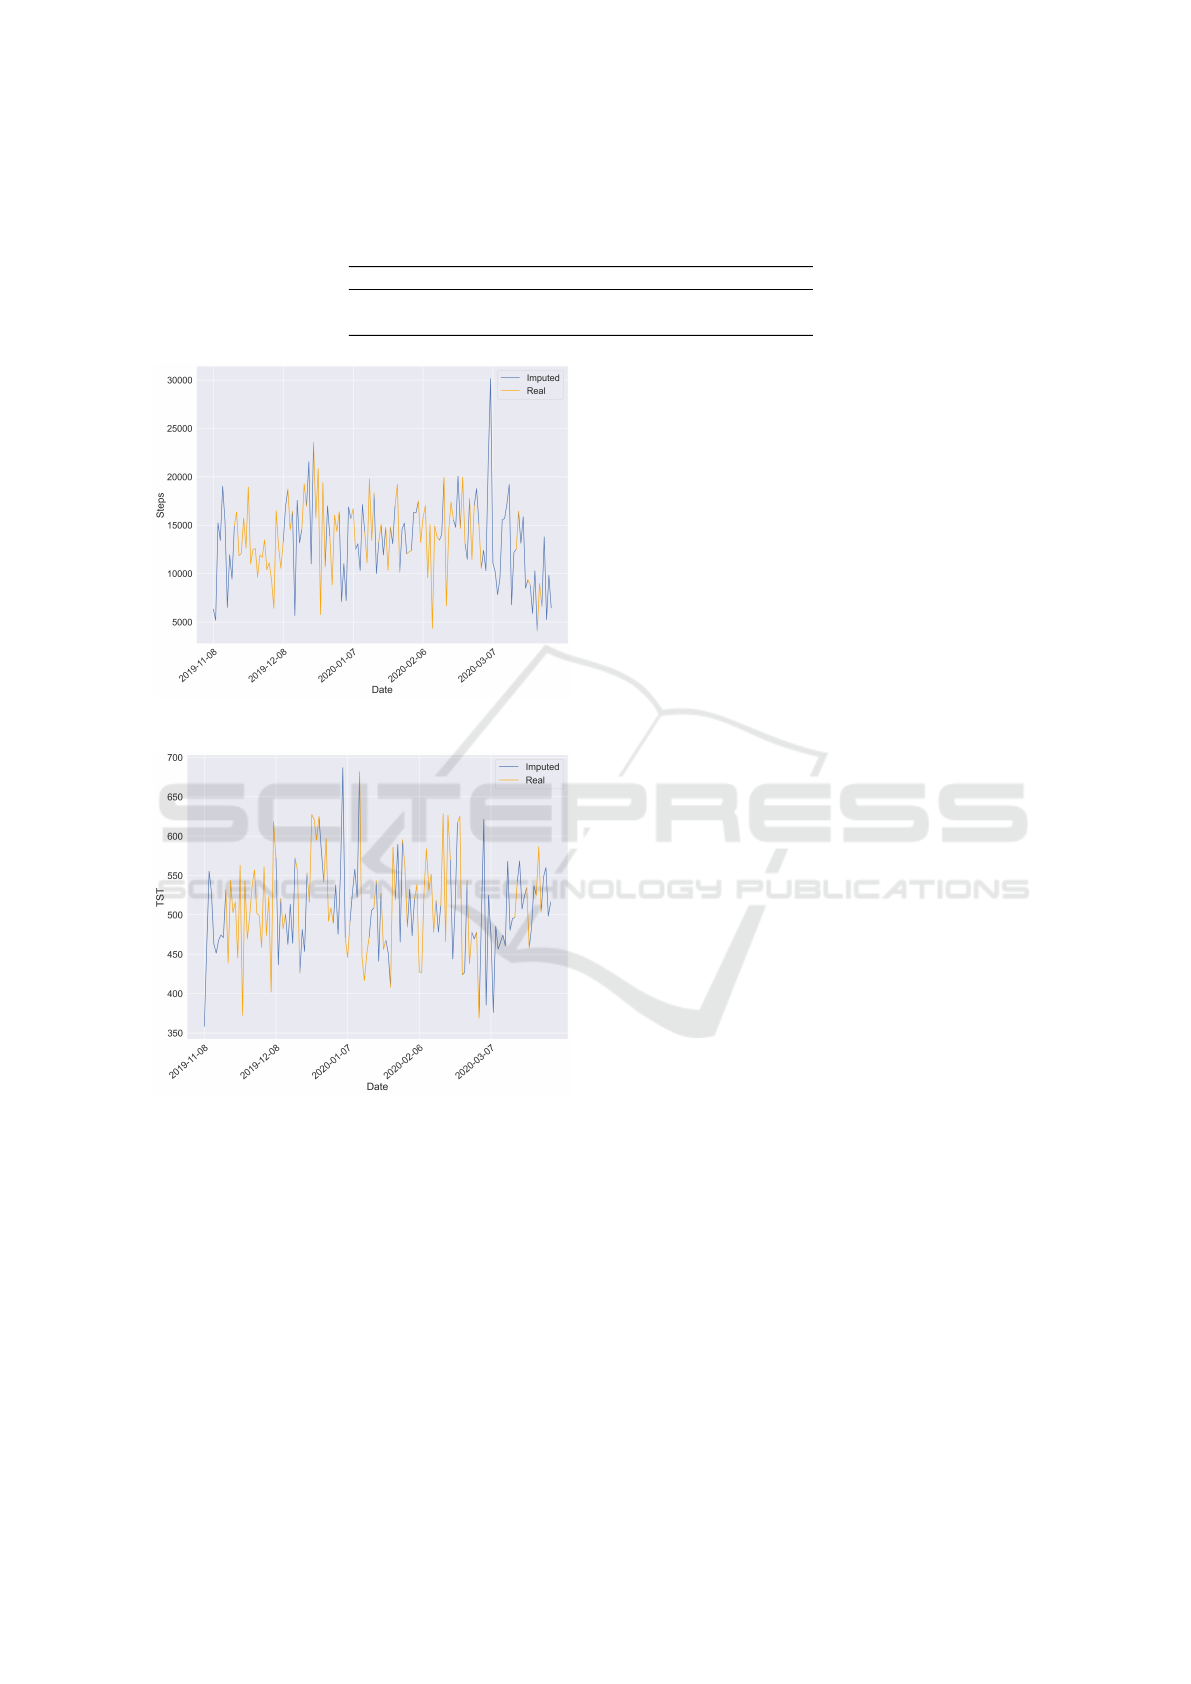
Table 6: Results of the best classification algorithm in each of the classification tasks when using only data without missing
values (i.e. Original) and when adding imputed values to Original data (i.e. Imputed).
Personality Sleep efficiency
Data F-score accuracy F-score accuracy
Original 67,3% 53,0% 80,2% 79,5%
Imputed 71,7% 55,9% 80,5% 79.8%
(a) Steps.
(b) Total sleep time (TST).
Figure 3: Example of data imputation in two different daily
health statistics.
putation employing various algorithms obtained sig-
nificantly better results in some cases than using the
baseline methods. As seen in both scenarios, base-
line methods (i.e. mean and median imputation) are
outperformed by all methods except for LOCF and
these methods should only be considered when com-
putational time has to be reduced as much as possible
or the number of samples is very limited. Notably,
the results showed that using features of the same day
(i.e., row-based methods) is the best option whenever
feasible and if the missing values rate does not reach
35-40% for a dataset of a similar size and variables,
being RF the best algorithm. Nevertheless, when the
missing rates are higher or it is not possible to im-
pute missing values using other daily health statistics,
the column-based methods should be used rather than
mean or median imputation.
The experiments comparing data imputation be-
tween two different scenarios revealed that there is
not much difference in the effectiveness of algorithms
when applied to both cases, although the results for
random missing values scenario are slightly better.
However, understanding the distribution of missing
values is crucial for determining the most suitable al-
gorithm for the dataset. Among the proposed meth-
ods, we note that LOCF, which was the worst pre-
forming method, is suitable for situations where the
time elapsed between samples or records is suffi-
ciently low (Twumasi-Ankrah et al., 2019). If this
does not fulfil, results may be poor as in this case, as
lineal interpolation is relevant when the feature being
imputed is dependent strictly on the last known value
and the next known value. However, in a more gen-
eral scenario where data doesn’t strictly depend on the
surrounding known value, and the time between sam-
ples is moderate, other column-based methods out-
performs these approaches. Among them, is worth
remarking KNN and RF algorithms, which obtained
the best results.
The classification results show that data imputa-
tion has enhanced the performance of the models on
unseen data. However, the increase reported in the
performance may be dependent on the classification
task to be carried out and each use case requires ex-
perimentation to test if data imputation is still benefi-
cial.
It is necessary to take into consideration some of
the limitations of this work. First of all is the lack
of data, as more data would lead to an increase in
the performance of the algorithms and more accu-
rate imputations. However, as the main focus of this
work are daily health statistics, it would be required
to have a longitudinal study combined with data aug-
mentation techniques to acquire enough data for deep
learning models. In addition, the results obtained are
specific for the dataset employed and may vary de-
pending the subjects of the study and the daily health
Missing Data Imputation in Daily Wearable Data for Improved Classification Performance
69

statistics considered. For that reason, this study is
also understood as a evaluation framework of data im-
putation methods for improved classification perfor-
mance, where a methodological approach is proposed
to evaluate different data imputation algorithms con-
sidering the nature of wearable devices and popular
smartwatches such as Fitbit.
6 CONCLUSIONS
In this study, we have designed an evaluation frame-
work of different data imputation algorithms under
two missing values scenarios: missing values at ran-
dom and at lines (days). The best algorithm for miss-
ing values at lines scenario is then used due to re-
semblance of the data to this scenario for two specific
classification tasks. Being able to consider more data
and improve the performance of the classification al-
gorithms.
More specifically, in the first two experiments, for
the evaluation of methods imputing missing values,
gaps were intentionally introduced in the dataset. This
is done with two different patterns to test the methods
in diverse scenarios. One scenario focused on miss-
ing values occurring randomly, whereas in the other,
missing values were situated in lines, resulting in the
deletion of an entire day of data. Additionally, each
scenario was executed 10 times to ensure that the re-
sults are not dependent on specific missing values.
In the third experiment, machine learning and
deep learning methods were developed to evaluate the
effectiveness of adding or not imputed data to clean
data. Two distinct classification problems were un-
dertaken: in the first, personality prediction was per-
formed, with the dataset divided by subjects as classes
repeated every day for each subject; in the second ex-
ercise, sleep efficiency was stratified into three levels
and the dataset was randomly divided as sleep effi-
ciency changes every day.
In our study, we reached the conclusion that im-
puting missing values proves beneficial for classifica-
tion, enabling us to sidestep the challenges associated
with working with smaller datasets that can not be
representative enough of the data distributions behind.
Nevertheless, it is crucial to evaluate the proposed
imputation methods for each dataset to ensure that
the imputed values significantly improve the baselines
and to select the best algorithm depending the miss-
ing values distribution in the dataset. This precaution
helps prevent biased outcomes stemming from inap-
propriate imputation methods or data deletion.
ACKNOWLEDGEMENTS
We acknowledge the trust of TECNUN University
of Navarra for the collaboration with VICOMTECH
through the master and degree students. We also
thank the funding received by Diputación Foral de
Gipuzkoa for ”OHARTU: Herramienta de detección
de anomalías de comportamiento para la prevención
del deterioro cognitivo” project under the program
Proyectos Gipuzkoa Next.
REFERENCES
Aadland, E. and Ylvisåker, E. (2015). Reliability of the acti-
graph gt3x+ accelerometer in adults under free-living
conditions. PloS one, 10(8):e0134606.
Baek, H. J. and Shin, J. (2017). Effect of missing inter-beat
interval data on heart rate variability analysis using
wrist-worn wearables. Journal of Medical Systems,
41:1–9.
Bank, D., Koenigstein, N., and Giryes, R. (2023). Autoen-
coders. Machine Learning for Data Science Hand-
book: Data Mining and Knowledge Discovery Hand-
book, pages 353–374.
Bent, B., Cho, P. J., Henriquez, M., Wittmann, A., Thacker,
C., Feinglos, M., Crowley, M. J., and Dunn, J. P.
(2021). Engineering digital biomarkers of interstitial
glucose from noninvasive smartwatches. NPJ Digital
Medicine, 4(1):89.
Boser, B. E., Guyon, I. M., and Vapnik, V. N. (1992). A
training algorithm for optimal margin classifiers. In
Proceedings of the fifth annual workshop on Compu-
tational learning theory, pages 144–152.
Box, G. (2013). Box and jenkins: time series analysis,
forecasting and control. In A Very British Affair: Six
Britons and the Development of Time Series Analysis
During the 20th Century, pages 161–215. Springer.
Bozinovski, S. (2020). Reminder of the first paper on trans-
fer learning in neural networks, 1976. Informatica,
44(3).
Breiman, L. (2001). Random forests. Machine learning,
45:5–32.
Buczak, P., Chen, J.-J., and Pauly, M. (2023). Analyzing
the effect of imputation on classification performance
under mcar and mar missing mechanisms. Entropy,
25(3):521.
Chakrabarti, S., Biswas, N., Karnani, K., Padul, V., Jones,
L. D., Kesari, S., and Ashili, S. (2023). Binned data
provide better imputation of missing time series data
from wearables. Sensors, 23(3):1454.
Conroy, B., Silva, I., Mehraei, G., Damiano, R., Gross, B.,
Salvati, E., Feng, T., Schneider, J., Olson, N., Rizzo,
A. G., et al. (2022). Real-time infection prediction
with wearable physiological monitoring and ai to aid
military workforce readiness during covid-19. Scien-
tific reports, 12(1):3797.
ICT4AWE 2024 - 10th International Conference on Information and Communication Technologies for Ageing Well and e-Health
70

De Myttenaere, A., Golden, B., Le Grand, B., and Rossi, F.
(2016). Mean absolute percentage error for regression
models. Neurocomputing, 192:38–48.
Engels, J. M. and Diehr, P. (2003). Imputation of missing
longitudinal data: a comparison of methods. Journal
of clinical epidemiology, 56(10):968–976.
Faust, L., Purta, R., Hachen, D., Striegel, A., Poellabauer,
C., Lizardo, O., and Chawla, N. V. (2017). Explor-
ing compliance: Observations from a large scale fitbit
study. In Proceedings of the 2nd International Work-
shop on Social Sensing, pages 55–60.
Feng, T. and Narayanan, S. (2019). Imputing missing
data in large-scale multivariate biomedical wearable
recordings using bidirectional recurrent neural net-
works with temporal activation regularization. In 2019
41st Annual International Conference of the IEEE En-
gineering in Medicine and Biology Society (EMBC),
pages 2529–2534. IEEE.
Friedman, J., Hastie, T., and Tibshirani, R. (2000). Additive
logistic regression: a statistical view of boosting (with
discussion and a rejoinder by the authors). The annals
of statistics, 28(2):337–407.
Ghandeharioun, A., Fedor, S., Sangermano, L., Ionescu, D.,
Alpert, J., Dale, C., Sontag, D., and Picard, R. (2017).
Objective assessment of depressive symptoms with
machine learning and wearable sensors data. In 2017
seventh international conference on affective comput-
ing and intelligent interaction (ACII), pages 325–332.
IEEE.
Grabczewski, K. and Jankowski, N. (2005). Feature selec-
tion with decision tree criterion. In Fifth International
Conference on Hybrid Intelligent Systems (HIS’05),
pages 6–pp. IEEE.
Gu, Q., Li, Z., and Han, J. (2012). Generalized fisher score
for feature selection. arXiv preprint arXiv:1202.3725.
Huo, Z., Ji, T., Liang, Y., Huang, S., Wang, Z., Qian, X.,
and Mortazavi, B. (2022). Dynimp: Dynamic impu-
tation for wearable sensing data through sensory and
temporal relatedness. In ICASSP 2022-2022 IEEE In-
ternational Conference on Acoustics, Speech and Sig-
nal Processing (ICASSP), pages 3988–3992. IEEE.
Hyndman, R. J. (2011). Moving averages.
Iqbal, S. M., Mahgoub, I., Du, E., Leavitt, M. A., and As-
ghar, W. (2021). Advances in healthcare wearable de-
vices. NPJ Flexible Electronics, 5(1):9.
Johnston, D. W. (1993). The current status of the coronary
prone behaviour pattern. Journal of the Royal Society
of Medicine, 86(7):406–409.
Kanokoda, T., Kushitani, Y., Shimada, M., and Shirakashi,
J.-i. (2019). Gesture prediction using wearable sens-
ing systems with neural networks for temporal data
analysis. Sensors, 19(3):710.
Kim, Y. and Kim, J. (2004). Gradient lasso for feature selec-
tion. In Proceedings of the twenty-first international
conference on Machine learning, page 60.
Längkvist, M., Karlsson, L., and Loutfi, A. (2014). A re-
view of unsupervised feature learning and deep learn-
ing for time-series modeling. Pattern recognition let-
ters, 42:11–24.
Lin, S., Wu, X., Martinez, G., and Chawla, N. V. (2020).
Filling missing values on wearable-sensory time se-
ries data. In Proceedings of the 2020 SIAM Inter-
national Conference on Data Mining, pages 46–54.
SIAM.
Lu, T.-C., Fu, C.-M., Ma, M. H.-M., Fang, C.-C.,
and Turner, A. M. (2016). Healthcare applica-
tions of smart watches. Applied clinical informatics,
7(03):850–869.
Mallol-Ragolta, A., Semertzidou, A., Pateraki, M., and
Schuller, B. (2021). harage: a novel multimodal
smartwatch-based dataset for human activity recogni-
tion. In 2021 16th IEEE International Conference on
Automatic Face and Gesture Recognition (FG 2021),
pages 01–07. IEEE.
Masci, J., Meier, U., Cire¸san, D., and Schmidhuber, J.
(2011). Stacked convolutional auto-encoders for hi-
erarchical feature extraction. In Artificial Neural Net-
works and Machine Learning–ICANN 2011: 21st In-
ternational Conference on Artificial Neural Networks,
Espoo, Finland, June 14-17, 2011, Proceedings, Part
I 21, pages 52–59. Springer.
Mattingly, S. M., Gregg, J. M., Audia, P., Bayraktaroglu,
A. E., Campbell, A. T., Chawla, N. V., Das Swain, V.,
De Choudhury, M., D’Mello, S. K., Dey, A. K., et al.
(2019). The tesserae project: Large-scale, longitudi-
nal, in situ, multimodal sensing of information work-
ers. In Extended Abstracts of the 2019 CHI Confer-
ence on Human Factors in Computing Systems, pages
1–8.
Medsker, L. R. and Jain, L. (2001). Recurrent neural net-
works. Design and Applications, 5(64-67):2.
Montgomery, D. C., Peck, E. A., and Vining, G. G. (2021).
Introduction to linear regression analysis. John Wiley
& Sons.
Nester, R. (2023). Wearable technology market size worth
usd 1.3 trillion by 2035, says research nester.
Noor, N. M., Al Bakri Abdullah, M. M., Yahaya, A. S., and
Ramli, N. A. (2015). Comparison of linear interpola-
tion method and mean method to replace the missing
values in environmental data set. In Materials Science
Forum, volume 803, pages 278–281. Trans Tech Publ.
Pedregosa, F., Varoquaux, G., Gramfort, A., Michel, V.,
Thirion, B., Grisel, O., Blondel, M., Prettenhofer,
P., Weiss, R., Dubourg, V., Vanderplas, J., Passos,
A., Cournapeau, D., Brucher, M., Perrot, M., and
Duchesnay, E. (2011). Scikit-learn: Machine learning
in Python. Journal of Machine Learning Research,
12:2825–2830.
Peterson, L. E. (2009). K-nearest neighbor. Scholarpedia,
4(2):1883.
Quinlan, J. R. (1986). Induction of decision trees. Machine
learning, 1:81–106.
Ranstam, J. and Cook, J. (2018). Lasso regression. Journal
of British Surgery, 105(10):1348–1348.
Sathyanarayana, A., Joty, S., Fernandez-Luque, L., Ofli, F.,
Srivastava, J., Elmagarmid, A., Arora, T., Taheri, S.,
et al. (2016). Sleep quality prediction from wearable
data using deep learning. JMIR mHealth and uHealth,
4(4):e6562.
Missing Data Imputation in Daily Wearable Data for Improved Classification Performance
71

Sazli, M. H. (2006). A brief review of feed-forward neural
networks. Communications Faculty of Sciences Uni-
versity of Ankara Series A2-A3 Physical Sciences and
Engineering, 50(01).
Thambawita, V., Hicks, S. A., Borgli, H., Stensland, H. K.,
Jha, D., Svensen, M. K., Pettersen, S.-A., Johansen,
D., Johansen, H. D., Pettersen, S. D., et al. (2020).
Pmdata: a sports logging dataset. In Proceedings of
the 11th ACM Multimedia Systems Conference, pages
231–236.
Twumasi-Ankrah, S., Odoi, B., Adoma Pels, W., and
Gyamfi, E. H. (2019). Efficiency of imputation tech-
niques in univariate time series.
Vaizman, Y., Ellis, K., and Lanckriet, G. (2017). Recog-
nizing detailed human context in the wild from smart-
phones and smartwatches. IEEE pervasive computing,
16(4):62–74.
Vaswani, A., Shazeer, N., Parmar, N., Uszkoreit, J., Jones,
L., Gomez, A. N., Kaiser, Ł., and Polosukhin, I.
(2017). Attention is all you need. Advances in neural
information processing systems, 30.
Vujovi
´
c, Ž. et al. (2021). Classification model evaluation
metrics. International Journal of Advanced Computer
Science and Applications, 12(6):599–606.
Weber, N., Härmä, A., and Heskes, E. P. D. T. (2017). Un-
supervised learning in human activity recognition: A
first foray into clustering data gathered from wearable
sensors. PhD thesis, Radboud University Nijmegen,
The Netherlands.
Weiss, G. M. (2019). Wisdm smartphone and smartwatch
activity and biometrics dataset. UCI Machine Learn-
ing Repository: WISDM Smartphone and Smartwatch
Activity and Biometrics Dataset Data Set, 7:133190–
133202.
Williams, J. B. (2001). Standardizing the hamilton depres-
sion rating scale: past, present, and future. Euro-
pean archives of psychiatry and clinical neuroscience,
251:6–12.
Willmott, C. J. and Matsuura, K. (2005). Advantages of the
mean absolute error (mae) over the root mean square
error (rmse) in assessing average model performance.
Climate research, 30(1):79–82.
Wu, X., Mattingly, S., Mirjafari, S., Huang, C., and Chawla,
N. V. (2020). Personalized imputation on wearable-
sensory time series via knowledge transfer. In Pro-
ceedings of the 29th ACM International Conference
on Information & Knowledge Management, pages
1625–1634.
Yu, Y., Si, X., Hu, C., and Zhang, J. (2019). A review of
recurrent neural networks: Lstm cells and network ar-
chitectures. Neural computation, 31(7):1235–1270.
Zhao, W., Alwidian, S., and Mahmoud, Q. H. (2022). Ad-
versarial training methods for deep learning: A sys-
tematic review. Algorithms, 15(8):283.
Zhu, T., Watkinson, P., and Clifton, D. A. (2020). Smart-
watch data help detect covid-19. Nature biomedical
engineering, 4(12):1125–1127.
ICT4AWE 2024 - 10th International Conference on Information and Communication Technologies for Ageing Well and e-Health
72
