
AI-Powered Urban Mobility Analysis for Advanced Traffic Flow
Forecasting
Sarah Di Grande
a
, Mariaelena Berlotti
b
and Salvatore Cavalieri
c
Department of Electrical Electronic and Computer Engineering, University of Catania, Viale A.Doria n.6, Catania, Italy
Keywords: Traffic Flow, Forecasting, Machine Learning, Clustering.
Abstract: Rapid global urbanization has resulted in burgeoning metropolitan populations, posing significant challenges
for managing transportation infrastructure. Despite various attempts to address these issues, persistent
challenges hinder urban growth. This study emphasizes the crucial need for effective traffic flow forecasting
in city traffic management systems, with Catania serving as a case study due to its notable traffic congestion.
Predicting traffic flow encounters obstacles, such as the cost and feasibility of deploying sensors across all
roads. To overcome this, the authors suggest an innovative two-level machine learning approach, involving
an unsupervised clustering model to extract patterns from extensive sensor-generated big data, followed by
supervised machine learning models forecasting traffic within individual clusters. Notably, this method allows
predictions for roads without sensor data by leveraging a small subset of alternative data sources.
1 INTRODUCTION
According to recent studies, more than half of the
population of the world currently resides in cities and,
in a few decades, this percentage is expected to rise
(ONU, 2019). This ever-increasing urban population
has led to an exponential rise in the number of
vehicles, putting transport systems under enormous
pressure and causing problems such as congestion
control, increased travel times, traffic, accidents, and
traffic law violations (Xu et al., 2020). Despite the
many attempts to mitigate these problems, traffic
congestion with its associated issues persists and
slows down the development of urban areas.
In recent years, the evolution of big data
technology has revolutionized problem-solving in
transportation (Abouaïssa et al., 2016). The field of
the Internet of Things (IoT) within Information and
Communication Technologies has gained
prominence thanks to possibility of creating a web of
interconnected devices accessible via the Internet.
This network facilitates easy data exchange through
various communication channels like Wi-Fi, RFID,
WSN, NFC, Bluetooth, and more (Swarnamugi and
Chinnaiyan, 2018). The proliferation of connected
a
https://orcid.org/0009-0008-8895-2175
b
https://orcid.org/0009-0007-6564-704X
c
https://orcid.org/0000-0001-9077-3688
devices in smart city setups contributes to an
exponential increase in collected data volumes
(Zantalis et al., 2019). The growth of computational
technologies coupled with the progressive
development of models for the analysis of the
abundant data, facilitates the development of
sophisticated algorithms crucial for traffic analysis
In the present paper, the authors propose a
machine learning approach to predict traffic flow
having input data available from sensors distributed
around the transportation system of an urban
scenario. This paper presents an extended version of
the work developed in (Berlotti et al., 2023). The
authors have enhanced the earlier research by
introducing a more intricate model, trained using one
year of data instead of the initial 3-month period. This
model is capable of detecting diverse patterns,
considering also variations across different months.
Furthermore, additional experiments were conducted
to test the models during holidays.
The paper is structured as follows: Section 2 will
provide an overview of the state of the art regarding
the paper subject; its content will be finalized to the
novelty of the proposed approach. In Section 3 the
authors provide a detailed explanation of the
Di Grande, S., Berlotti, M. and Cavalieri, S.
AI-Powered Urban Mobility Analysis for Advanced Traffic Flow Forecasting.
DOI: 10.5220/0012625900003714
Paper published under CC license (CC BY-NC-ND 4.0)
In Proceedings of the 13th International Conference on Smart Cities and Green ICT Systems (SMARTGREENS 2024), pages 57-64
ISBN: 978-989-758-702-3; ISSN: 2184-4968
Proceedings Copyright © 2024 by SCITEPRESS – Science and Technology Publications, Lda.
57

proposed approach. Section 4 will display the
principal outcomes of the proposal testing. Finally, in
Section 5 concluding remarks will summarize the
contents of the paper.
2 RELATED WORKS
In this section, the authors provide an overview of the
methods for the forecasting of traffic flow existing in
the current literature to identify the differences with
respect to the approach presented in this study.
In the literature, current traffic flow prediction
methods are broadly categorized into three groups.
The first category comprises statistical methods based
on mathematical theory. For instance, (J. Liu and
Guan, 2004) proposed a History Average Model (HA
model) for static prediction in urban traffic control
systems. Instead, according to (Lin et al., 2009) the
Autoregressive Integrated Moving Average model
(ARIMA model) is suitable for predicting stable
traffic flow by considering the sequence as a random
time sequence (Zhou et al., 2020). The second
category involves machine learning (ML) techniques
such as Regression analysis (Zhou et al., 2020) and
Boosting algorithms (Y. Liu et al., 2020) like
LightGBM (Chen and Guestrin, 2016), and CatBoost
(Ke et al., 2017), often used to identify patterns within
historical data progression and to forecasting and
regression problems. Finally, the third category
encompasses Deep Learning (DL) techniques,
particularly neural networks like Back Propagation
(BP) (Vijayalakshmi et al., 2021) and Long Short-
Term Neural Network (LSTM) (Li et al., 2020).
Models such as ST-ResNet (Ma et al., 2015) and
spatiotemporal graph convolutional networks
(ASTGCN) (J. Zhang et al., 2017) use various
architectures to predict traffic flow by modeling
congested traffic and attention mechanisms.
The approach of the authors predominantly relies
on the CatBoost model, employed differently from
existing literature, as elaborated further in subsequent
sections. In the present study, the input data given to
the model are obtained from sensors installed on
urban roads. Clearly, installing the sensors on all the
roads of an urban scenario is not possible due to costs
and other practical reasons. To address the challenge
of expensive and limited sensor installations on every
road, the authors use the data collected by sensors
installed in a subset of roads to predict both traffic on
the same roads and on roads lacking of sensor data.
Most current approaches in literature tries to
address this challenge by examining spatio-temporal
characteristics between neighboring and distant
sensors to predict traffic flow in urban areas lacking
from data but similar to the ones of the collected data
(Guo et al., 2019). For example, (Y. Zhang et al.,
2023) introduced a spatio-temporal traffic flow
estimation model that utilizes data from multiple
locations within the network. The approach
incorporates various features beyond solely relying
on traffic flow data.
The approach of the authors revolves around
utilizing a two-level machine learning method using
only traffic flow data. An unsupervised clustering
model organizes sensor data into clusters, while a
supervised machine learning model predicts traffic
flow for each cluster. This approach involves
assigning roads to clusters using distance metrics,
enabling precise prediction by employing specific
forecasting models trained on comprehensive sensor
data. Section 3 will delve into a detailed description
of this proposed approach.
3 PROPOSED APPROACH
In this section, the authors will provide details
regarding the proposed approach. In the analysis real
data from a network of traffic sensors situated in
Catania, Italy, were utilized. The most important
problem today in the traffic flow of Catania is
congestion. Over time, the population of the city
expanses, forming a unified urban network that
extends beyond municipal boundaries resulting in
considerable traffic pressure on Catania, in daily
congestion in the central area and in amplified
environmental pollution levels.
This situation intensified substantially leading to
the critical need to effectively manage traffic flow in
Catania through the implementation of forecasting
methodologies.
As previously stated, the primary idea proposed
by the authors is to use a two-level machine learning
approach, combining unsupervised and supervised
models. First, an unsupervised model is utilized to
extract patterns from the traffic flow time series
collected from sensors, organizing them into multiple
clusters. Within each cluster, a supervised machine
learning model will be then developed to predict
traffic flow for each time series belonging to the same
cluster. Using distance metrics enables the allocation
of roads to clusters with minimal observations,
facilitating predictions. Once the relevant cluster for
a specific road segment is identified, a machine
learning model trained on the traffic flow of segments
within that cluster is employed to predict traffic in the
new segment. Essentially, distinct models are created
SMARTGREENS 2024 - 13th International Conference on Smart Cities and Green ICT Systems
58

for each cluster, allowing the forecasting of traffic
flow for roads with limited observations sharing
similar patterns.
The results outlined in this paper will underscore
that each model, having been trained on extensive
time series within the same cluster, can effectively
generate forecasts for similar but unseen series
requiring only a minimal number of observations
from these new series. For these roads lacking
sensors, since a small subset of traffic data is crucial
for the forecasting models, it can be obtained from
alternative sources such as Floating Car Data.
3.1 Data Acquisition
Data employed in the model refers to sensors-data
about the traffic flow of Catania city. Located in the
eastern part of Sicily, Italy, Catania has a population
of around 300,000 inhabitants across approximately
183 km2 (Medina-Salgado et al., 2022). The city is
part of a larger metropolitan area encompassing the
main municipality and 26 nearby urban centers.
Sensor-based date have been collected through 21
microwave traffic counters known as MOBILTRAF
300 by FAMAS (www.famassystem.it/it/prodotto/
mobiltraf-300), placed across the Catania urban area.
When any vehicle crosses the electromagnetic field
generated by two MobilTraf300 sensors, these units
capture different vehicle-related data, including the
date and time of passage, the travel direction, and the
specific transit lane. To access and retrieve these data,
FAMAS's traffic manager software, known as
MobilTraf MANAGER, was used.
Twelve traffic counters (TCs)—those that were
operational at the time of data download—were
chosen from among all the ones present. The period
under analysis spans from January 1, 2022, to
December 31, 2022 with data recorded at 5-minute
intervals.
Each traffic counter corresponds to a specific
road, showcasing different characteristics. In the
following section the authors will describe the steps
involved in the preprocessing.
3.2 Data Preprocessing
The roads analysed can be categorized as single-lane
roads, two-lane roads in the same direction, or two-
lane roads in the opposite direction. Based on the
characteristics of each road, distinct data
preprocessing steps were applied. In details, for roads
with two lanes in the same direction, the vehicle
counts from both lanes were summed up in a
consolidated time series representing the total vehicle
count for that road. Conversely, time series related to
roads with two lanes in opposite directions were
disaggregated into distinct time series to capture
information about vehicles traveling in separate
directions on the same road.
Post a pivot transformation, the final dataset was
composed of one column for Timestamp and
additional columns representing the total vehicle
count for each road and direction.
The next step was the data cleaning. Two types of
missing values were identified in the dataset: sensor
malfunctions, when a specific TC broke and failed to
retrieve traffic information, and outliers. Outliers in
the time series were detected using boxplots and
replaced with missing values.
To address missing observations, the technique
chosen involves filling in missing values using a
time-based averaging method. This function
calculates the mean of traffic values for the same
road, day of the week, and time within the same
month.
Lastly, aiming to train the machine learning
model with hourly data, data have been aggregated
per hour using the sum as the aggregation function,
resulting in the total vehicle count recorded for a
specific street per hour.
The final dataset comprised 15 columns and 8769
rows, encompassing all the hours of the day across
365 days, equating to one year of data.
3.3 Clustering
The paper aims to create a ML solution to accurately
predict traffic flows both on the roads with sensors
and on the ones where sensors are not installed. To do
this, the authors use a machine learning model trained
on a set of sensors sharing similar characteristics to
forecast traffic flow on a road with a very limited
number of observations possessing resemblances to
the sensor-equipped group. Consequently, a
clustering step is applied.
The study utilizes Time Series K-means
(TSkmeans), an adapted version of the traditional K-
means algorithm designed specifically for clustering
time series data (Huang et al., 2016). In contrast to
standard K-means, which focuses solely on data point
values, TSkmeans incorporates temporal
relationships, considering both values and their
temporal aspects in cluster formation. Notably,
TSkmeans employs the Dynamic Time Warping
(DTW) metric instead of the conventional Euclidean
distance for measuring similarity among temporal
sequences. The initial step in TSKmeans clustering
involves determining the appropriate number of
AI-Powered Urban Mobility Analysis for Advanced Traffic Flow Forecasting
59

clusters (K), achieved through the use of a silhouette
score.
Before clustering, since the time series considered
exhibit widely varying value ranges, data
normalization was needed. Normalizing the data
enables to establish a uniform baseline to prevent the
clustering algorithm from reacting to feature scales.
The normalization technique used in the analysis is
Min-Max scaling, which transforms the range of each
variable to a standardized 0-1 scale.
After clustering data, the next step for the analysis
involves the creation of the forecasting model; next
paragraph will describe more in detail this step.
3.4 Forecasting
The purpose of this step of the analysis is to find out
the most suitable machine learning algorithm for
traffic flow forecasting. All the machine learning
models proposed, were implemented using Darts,
Python library. (Time Series Made Easy in Python —
Darts Documentation, n.d.)
First, the dataset was divided into a training set
spanning from January 1, 2022, to December 16,
2022, and a test set spanning from December 17,
2022, to December 31, 2022.
Next, the Catboost algorithm was compared with
various machine learning algorithms, with default
hyperparameters.
The authors considered the following metrics to
evaluate models’ performances: mean absolute error
(MAE) (Prokhorenkova et al., 2019), symmetric
mean absolute percentage error (SMAPE), mean
squared error (MSE) (Dorogush et al., 2018) and the
root mean square error (RMSE). For each of these
metrics, lower values denote better model
performance. It is important to note that while
SMAPE is the main performance metric used to
choose the best model, other metrics like MAE, MSE,
and RMSE are also taken into consideration as
supporting indicators during the evaluation process.
According to all these metrics, Catboost emerged
as the best-performing algorithm and was considered
to proceed with the analysis.
Proposed by (Herzen et al., 2023), the CatBoost
algorithm is a Gradient Boosting Decision Tree
(GBDT) framework that merges weak learners as
symmetric decision tree, to generate a stronger
predictive model. Ensemble methods like CatBoost
process sequentially a series of simple decision trees,
trying to reduce the errors done in the models
previously trained for optimizing performances.
To test the approach multiple times, different
models were trained repeatedly, leaving out one
specific time series from the training data each time,
and then evaluating the model's performance based
on the omitted time series. The purpose of this
methodology is to assess robustness and
generalization capabilities of the approach training
models on various combinations of the available time
series data.
Different CatBoost models were created and
tested for different sets of hyperparameters, using
Optuna Python library (Optuna: A Hyperparameter
Optimization Framework — Optuna 3.5.0
Documentation, n.d.). A total of 100 trials were used
to create and compare 100 different models.
The chosen objective function to be optimized
for each training set was the validation loss, used to
quantify the performance of machine learning models
on a validation dataset during hyperparameter
optimization. The last 24 hours of the training set
were used for validating the model.
Walk-forward validation method was
implemented as a validation technique. This
validation method stands out from standard cross-
validation approaches by maintaining the temporal
order of data, making it particularly suitable for
capturing time-dependent patterns in time series data.
The validation process initiates with an initial
training period covering historical time series data
from January to December 16
th
. Subsequently, the
model undergoes iterative phases, where it is
retrained and makes predictions for upcoming time
steps within the sequence. The performance
assessment occurs continuously as predictions are
compared with actual values, mimicking the dynamic
nature of real-world scenarios. This regular retraining
process enables the model to adapt dynamically to
evolving data distributions or patterns over time,
thereby significantly enhancing its practical efficacy.
4 RESULTS
In this section, the authors will present the results and
discuss the outcomes obtained from the clustering and
forecasting phases.
4.1 Clustering
As a result of the clustering process, a specific
configuration emerged, yielding a silhouette score of
0.52. This outcome is favorable, indicating a
reasonably clear distinction between the clusters
formed. Experts in the field have also validated the
effectiveness of the clustering algorithm in grouping
roads that share similar characteristics.
SMARTGREENS 2024 - 13th International Conference on Smart Cities and Green ICT Systems
60
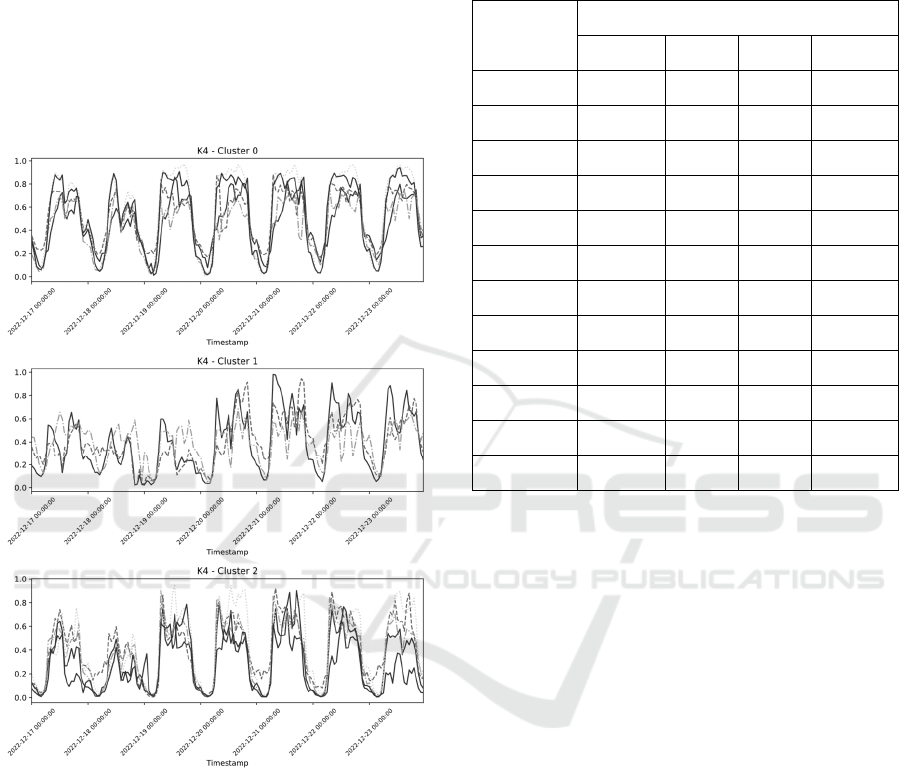
The results of the clustering procedure are
visually depicted in Figure 1. Due to limitations in
space, the figure showcases data collected over just
one week, despite the algorithm utilizing an entire
year of data as input. Upon observation, it becomes
apparent that the first cluster comprises 5 time series,
the second cluster consists of 3 time series, and the
third cluster encompasses 5 time series. The fourth
cluster, comprising only one time series, was omitted
from the visual representation due to its singular
nature.
Figure 1: Time series divided into clusters.
4.2 Models Comparison
Taking as reference clustering results, short-term
forecasting was implemented.
Initially, the authors compared the performances
of different machine learning models to identify the
best performing algorithm.
Two critical hyperparameters had to be set: the
input chunk length fixed at 168 hours (equivalent to 7
days), and the output chunk length was set to 24
hours. Essentially, this configuration means that the
model utilized data from the previous 7 days to
predict the forthcoming 24 hours. All the others
hyperparameters were set to the default values. The
results are documented in Table I.
Table 1: Performances comparison with default
hyperparameters.
Algorithm
Performance Metrics
SMAPE MAE MSE RMSE
LR 33.301 0.082 36.565 0.112
LSTM 199.406 0.571 125.61 0.596
CatBoost 32.985 0.078 28.441 0.013
DLinear 33.915 0.084 31.366 0.014
LightGBM 33.8 0.08 26.767 0.014
N-Hits 34.328 0.084 31.585 0.014
Transf 38.71 0.099 36.165 0.019
N-Beats 34.944 0.087 32.011 0.015
B-RNN 51.067 0.152 68.324 0.034
N-Linear 34.385 0.088 37.116 0.014
TCN 40.699 0.118 39.194 0.022
TiDe 35.631 0.095 49.398 0.015
As can be seen from Table 1, CatBoost emerged
as the best-performing algorithm, leading to its
selection for creating the final models.
Next step of the analysis was the optimization of
the CatBoost model. As explained in Section 3.4,
each time an optimized forecasting model is created
for a cluster, a time series belonging to that group is
excluded from the training to be used as a test.
It is important to note that upon examining the
resulting optimized models for the three clusters, it is
evident that the longest duration needed to generate
forecasts is 383 hours, equivalent to approximately 16
days, a minimal number of observations.
4.3 Forecasting
As previously said in Section 3.5, the CatBoost model
was tested on two weeks comprising data from 17th,
to 31
st
December, 2022. This choice was dictated by
the fact that in Italy last week of December is
Christmas week, during which traffic flow is different
from the normal.
Table 2 and Table 3 show the results obtained for
each sensor in the three clusters, for the roads
included in the training of the model.
AI-Powered Urban Mobility Analysis for Advanced Traffic Flow Forecasting
61
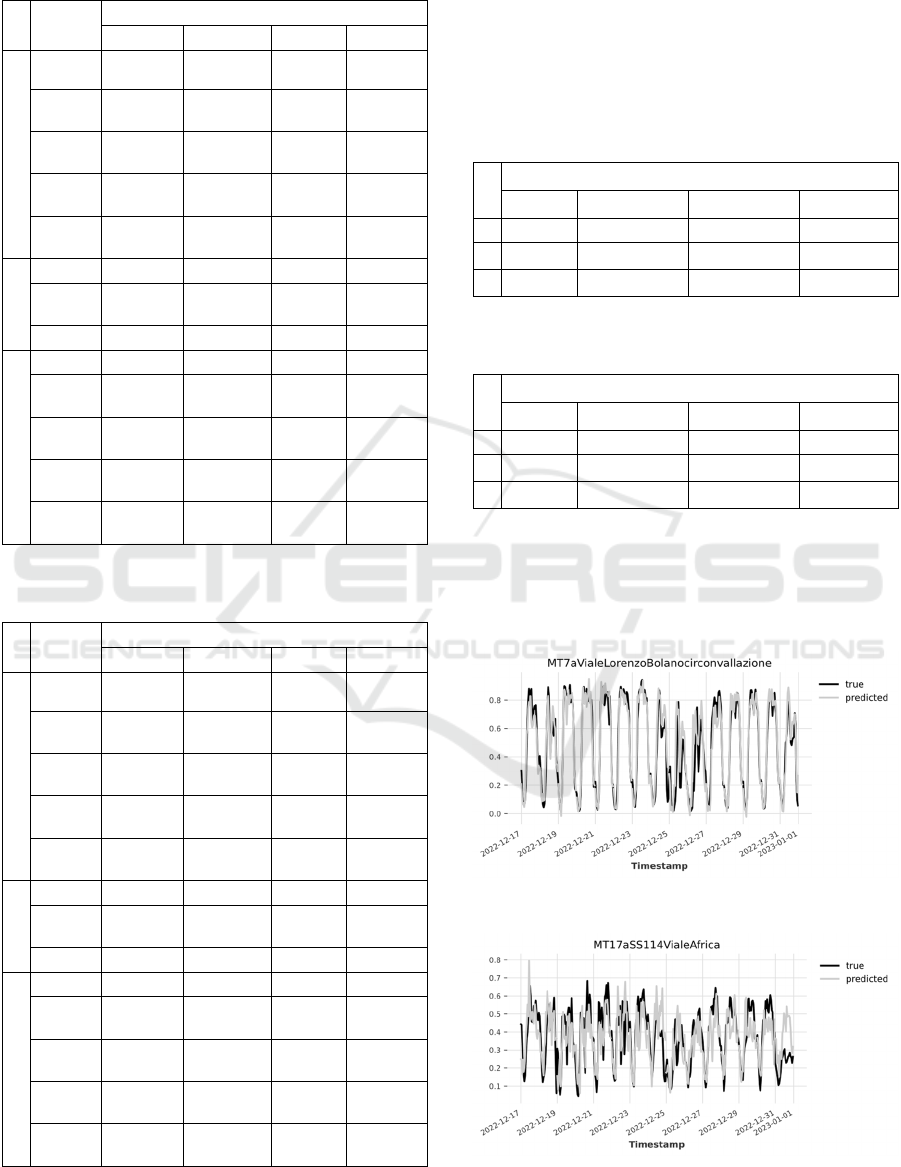
Table 2: Performances test week from 17th to 23rd Dember
2022 for roads included in the training.
C
Sensor
ID
Performance Metrics
MAE SMAPE MSE RMSE
1
MT10a 0.0519 16.7697
0.0044 0.0133
MT10
b
0.0483 9.9464 0.0047 0.0124
MT6
a
0.0568 18.5326 0.0061 0.0139
MT6
b
0.0451 14.1015 0.0040 0.0115
MT7
a
0.0481 14.4138 0.0042 0.0138
2
MT13a 0.1258 37.1682 0.0322 0.0416
MT13
b
0.1223 41.9823 0.0273 0.0425
MT17a 0.0963 31.4148 0.0163 0.0333
3
MT14a 0.0423 25.3374 0.0056 0.0134
MT14
b
0.0878 34.5072 0.0123 0.0265
MT18
b
0.0473 19.2189 0.0064 0.0194
MT9
a
0.0732 24.1288 0.0124 0.0218
MT9
b
0.0981 44.1747 0.0185 0.0343
Table 3: Performances test week from 24th to 31st
December 2022 for roads included in the training.
C
Sensor
ID
Performance metrics
MAE SMAPE MSE RMSE
1
MT10a 0.0705 20.5463 0.0093 0.0342
MT10
b
0.0568 13.6693 0.0081 0.0287
MT6
a
0.0654 20.0405 0.0088 0.0345
MT6
b
0.0555 17.7132 0.0064 0.0306
MT7
a
0.0704 26.9439 0.0114 0.0438
2
MT13a 0.0980 27.7650 0.0144 0.0503
MT13
b
0.1015 32.6417 0.0187 0.0544
MT17a 0.1116 38.1443 0.0178 0.0500
3
MT14a 0.0531 36.9480 0.0082 0.0246
MT14
b
0.0764 30.1027 0.0112 0.0337
MT18
b
0.0682 32.9566 0.0128 0.0365
MT9
a
0.0811 36.6931 0.0168 0.0399
MT9
b
0.0865 52.2013 0.0164 0.0376
The next step of the analysis was to test optimized
models each time on the excluded time series.
Table 4 and 5 report the average performance
metrics computed each time a time series was
excluded from the three clusters, for the two test
weeks going from 17
th
to 31
st
December, 2022.
Table 4: Average performances test week from 17th to 23rd
December 2022 for roads excluded in the training.
C
Performance Metrics
MAE SMAPE MSE RMSE
1 0.0557 17.6324 0.0059 0.0169
2 0.1209 36.8653 0.0259 0. 0388
3 0.0740 31.6346 0.0116 0.2333
Table 5: Average performances test week from 24th to 31st
December 2022 for roads excluded in the training.
C
Performance Metrics
MAE SMAPE MSE RMSE
1 0. 0673 21.6607 0.0093 0.0298
2 0. 1110 34.3332 0.0190 0.0560
3 0. 0732 39.9600 0.0131 0.3142
Figures 2-4 display the true traffic values versus
the traffic flow predicted by CatBoost models during
the two test weeks from 17
th
to 31
st
December 2022,
on sensors that were excluded from the training
dataset.
Figure 2: Test excluded sensor cluster 1.
Figure 3: Test excluded sensor cluster 2.
SMARTGREENS 2024 - 13th International Conference on Smart Cities and Green ICT Systems
62
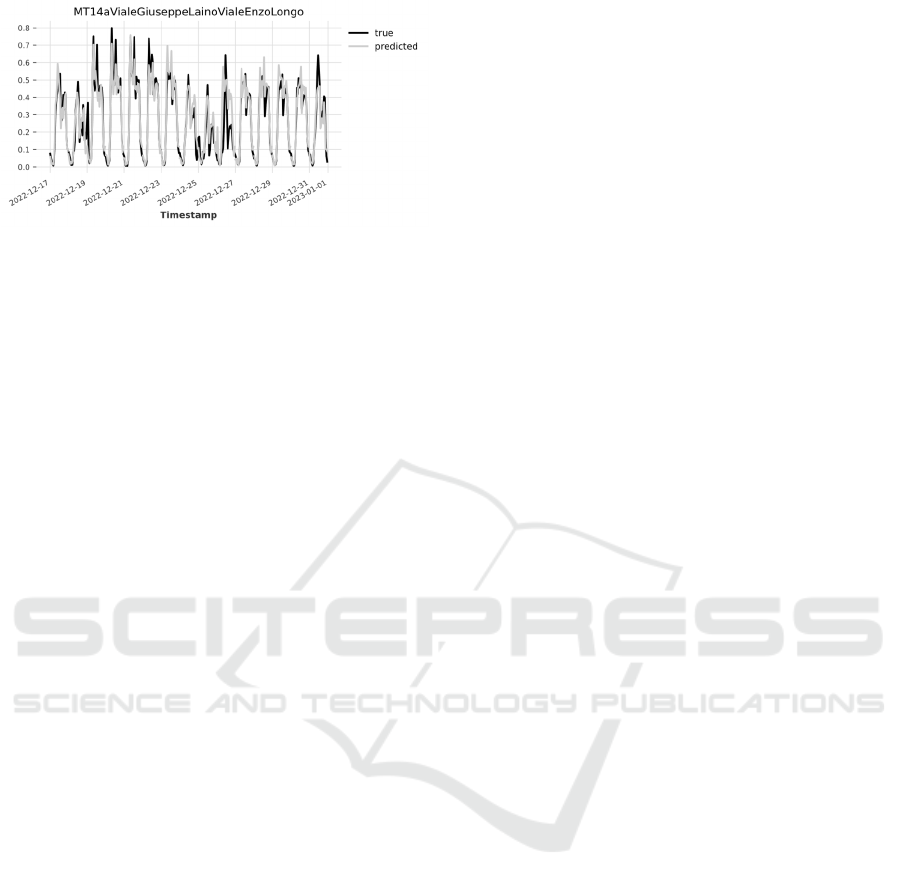
Figure 4: Test excluded sensor cluster 3.
As can be seen, the optimized CatBoost models
tested for each cluster show relatively low SMAPE
values as concerns the tested week from 17
th
to 23
rd
December, 2022. Instead, for the second tested week
which is the Christmas week, SMAPE tends to
increase suggesting that the predictions of the models
have some degree of error.
Results obtained depend on a model that has been
trained for one year. Thus, the model has never seen
during the training traffic flow patterns generated in
every street during the Christmas week. Moreover,
the only variable considered is the traffic flows.
Knowing such a limited time range, the results must
be considered impressive.
5 CONCLUSIONS
In this study, the authors propose a solution for a
traffic flow prediction both for roads where sensors
data are available and roads lacking from data for cost
and practicality reasons of sensors’ deployment on
every road. The authors address it with a novel two-
level machine learning approach, involving clustering
and forecasting models. The city of reference is
Catania, because of its complex transportation
network.
Using TSKMeans algorithm, time series were
divided into different clusters, highlighting not only
roads with similar patterns but also roads with similar
physical characteristics, as confirmed by domain
experts.
The forecasting process, where a distinct model
was generated for each cluster, yielded outstanding
outcomes when applied to the time series used in
training, employing the CatBoost algorithm.
Moreover, a tailored parameter optimization process
for each cluster facilitated the customized
configuration of hyperparameters.
Finally, this approach enables predictions for
roads lacking sensor data by utilizing a really small
subset of these new data, needing in input ranges
between 199 and 383 hours.
Future works plan to repeat this study with a
greater time range of data, to make the CatBoost
model more accurate in making predictions in the
presence of traffic flow patterns different from
normal, as it could happen during Christmas week.
Moreover, the authors plan to increase the number of
sensors considered in the analysis. Furthermore, data
from different sources (e.g. weather data, road
conditions as traffic jams and road works) will be
collected and given to the model to improve
forecasting.
ACKNOWLEDGEMENTS
The results presented in this paper have been
achieved under the research project of the Spoke 9
“Digital Society & Smart Cities” inside the “National
Centre for HPC, Big Data and Quantum Computing”
(Code CN00000013, CUP E63C22001000006). This
research project is currently running and is funded
under PNRR M4C2 Line 1.4, by Italian Ministry for
Research.
Data analyzed in the paper were provided by the
“ITS Laboratory” of the Department of Civil and
Architecture Engineering of Catania. Specifically, the
laboratory created within the project RE.S.E.T, is a
traffic monitoring, estimation and short-term
forecasting system, equipped with radar sensor and a
central control station for traffic data elaborations.
REFERENCES
Abouaïssa, H., Fliess, M., and Join, C. (2016). On short-
term traffic flow forecasting and its reliability. IFAC-
PapersOnLine, 49(12), 111–116. https://doi.org/10.101
6/j.ifacol.2016.07.559
Berlotti, M., Di Grande, S., Cavalieri, S., Torrisi, V., and
Inturri, G. (2023). Proposal of an AI based approach for
Urban Traffic Prediction from Mobility Data. IEEE
International Conference on Big Data (Big Data),
Sorrento, Italy. In press.
Chen, T., and Guestrin, C. (2016). XGBoost: A Scalable
Tree Boosting System. Proceedings of the 22nd ACM
SIGKDD International Conference on Knowledge
Discovery and Data Mining, 785–794. https://doi.org/
10.1145/2939672.2939785
Dorogush, A. V., Ershov, V., and Gulin, A. (2018).
CatBoost: Gradient boosting with categorical features
support (arXiv:1810.11363). arXiv. https://doi.org/
10.48550/arXiv.1810.11363
AI-Powered Urban Mobility Analysis for Advanced Traffic Flow Forecasting
63

Guo, S., Lin, Y., Feng, N., Song, C., and Wan, H. (2019).
Attention Based Spatial-Temporal Graph
Convolutional Networks for Traffic Flow Forecasting.
Proceedings of the AAAI Conference on Artificial
Intelligence, 33(01), Article 01. https://doi.org/10.16
09/aaai.v33i01.3301922
Herzen, J., Lässig, F., Piazzetta, S. G., Neuer, T., Tafti, L.,
Raille, G., Van Pottelbergh, T., Pasieka, M., Skrodzki,
A., Huguenin, N., Dumonal, M., Kościsz, J., Bader, D.,
Gusset, F., Benheddi, M., Williamson, C., Kosinski,
M., Petrik, M., and Grosch, G. (2023). Darts: User-
friendly modern machine learning for time series. The
Journal of Machine Learning Research, 23(1),
124:5442-124:5447.
Huang, X., Ye, Y., Xiong, L., Lau, R. Y. K., Jiang, N., and
Wang, S. (2016). Time series k-means: A new k-means
type smooth subspace clustering for time series data.
Information Sciences, 367–368, 1–13. https://doi.org/
10.1016/j.ins.2016.05.040
Ke, G., Meng, Q., Finley, T., Wang, T., Chen, W., Ma, W.,
Ye, Q., and Liu, T.-Y. (2017). LightGBM: A Highly
Efficient Gradient Boosting Decision Tree. Advances
in Neural Information Processing Systems, 30.
https://papers.nips.cc/paper_files/paper/2017/hash/644
9f44a102fde848669bdd9eb6b76fa-Abstract.html
Li, Y., Huang, J., and Chen, H. (2020). Time Series
Prediction of Wireless Network Traffic Flow Based on
Wavelet Analysis and BP Neural Network. Journal of
Physics: Conference Series, 1533(3), 032098.
https://doi.org/10.1088/1742-6596/1533/3/032098
Lin, S.-L., Huang, H.-Q., Zhu, D.-Q., and Wang, T.-Z.
(2009). The application of space-time ARIMA model
on traffic flow forecasting. 2009 International
Conference on Machine Learning and Cybernetics, 6,
3408–3412. https://doi.org/10.1109/ICMLC.2009.5212
785
Liu, J., and Guan, W. (2004). A Summary of Traffic Flow
Forecasting Methods. Journal of Highway and
Transportation Research and Development, 21(3),
Article 3.
Liu, Y., Liu, C., and Zheng, Z. (2020). Traffic Congestion
and Duration Prediction Model Based on Regression
Analysis and Survival Analysis. Open Journal of
Business and Management, 8(2), Article 2.
https://doi.org/10.4236/ojbm.2020.82059
Ma, X., Tao, Z., Wang, Y., Yu, H., and Wang, Y. (2015).
Long short-term memory neural network for traffic
speed prediction using remote microwave sensor data.
Transportation Research Part C: Emerging
Technologies, 54, 187–197. https://doi.org/10.1016/
j.trc.2015.03.014
Majumdar, S., Subhani, M. M., Roullier, B., Anjum, A., and
Zhu, R. (2021). Congestion prediction for smart
sustainable cities using IoT and machine learning
approaches. Sustainable Cities and Society, 64, 102500.
https://doi.org/10.1016/j.scs.2020.102500
Medina-Salgado, B., Sánchez-DelaCruz, E., Pozos-Parra,
P., and Sierra, J. E. (2022). Urban traffic flow
prediction techniques: A review. Sustainable
Computing: Informatics and Systems, 35, 100739.
https://doi.org/10.1016/j.suscom.2022.100739
ONU. (2019). World Population Prospects 2019:
Highlights. United Nations Department for Economic
and Social Affairs, New York (US).
Optuna: A hyperparameter optimization framework—
Optuna 3.5.0 documentation. (n.d.). Retrieved 12
December 2023, from https://optuna.readthedocs.io/en/
stable/index.html
Prokhorenkova, L., Gusev, G., Vorobev, A., Dorogush, A.
V., and Gulin, A. (2019). CatBoost: Unbiased boosting
with categorical features (arXiv:1706.09516). arXiv.
https://doi.org/10.48550/arXiv.1706.09516
Swarnamugi, M., and Chinnaiyan, R. (2018). IoT Hybrid
Computing Model for Intelligent Transportation
System (ITS). 2018 Second International Conference
on Computing Methodologies and Communication
(ICCMC), 802–806. https://doi.org/10.1109/ICCMC.2
018.8487843
Time Series Made Easy in Python—Darts documentation.
(n.d.). Retrieved 16 October 2023, from
https://unit8co.github.io/darts/
Vijayalakshmi, B., Ramar, K., Jhanjhi, Nz., Verma, S.,
Kaliappan, M., Vijayalakshmi, K., Vimal, S., Kavita,
and Ghosh, U. (2021). An attention-based deep learning
model for traffic flow prediction using spatiotemporal
features towards sustainable smart city. International
Journal of Communication Systems, 34(3), e4609.
https://doi.org/10.1002/dac.4609
Xu, T., Han, G., Qi, X., Du, J., Lin, C., and Shu, L. (2020).
A Hybrid Machine Learning Model for Demand
Prediction of Edge-Computing-Based Bike-Sharing
System Using Internet of Things. IEEE Internet of
Things Journal, 7(8), 7345–7356. https://doi.org/
10.1109/JIOT.2020.2983089
Zantalis, F., Koulouras, G., Karabetsos, S., and Kandris, D.
(2019). A Review of Machine Learning and IoT in
Smart Transportation. Future Internet, 11(4), 94.
https://doi.org/10.3390/fi11040094
Zhang, J., Zheng, Y., and Qi, D. (2017). Deep Spatio-
Temporal Residual Networks for Citywide Crowd
Flows Prediction (arXiv:1610.00081). arXiv.
https://doi.org/10.48550/arXiv.1610.00081
Zhang, Y., Cheng, Q., Liu, Y., and Liu, Z. (2023). Full-
scale spatio-temporal traffic flow estimation for city-
wide networks: A transfer learning based approach.
Transportmetrica B: Transport Dynamics, 11(1), 869–
895. https://doi.org/10.1080/21680566.2022.2143453
Zhou, J., Yang, Q., Zhang, X., Han, C., and Sun, L. (2020).
Traffic Prediction Method for GEO Satellites
Combining ARIMA Model and Grey Model. Journal of
Shanghai Jiaotong University (Science), 25(1), 65–69.
https://doi.org/10.1007/s12204-019-2152-9
SMARTGREENS 2024 - 13th International Conference on Smart Cities and Green ICT Systems
64
