
Adaptation in Learning Analytics Dashboards: A Systematic Review
R
´
emi Barb
´
e
1 a
, Beno
ˆ
ıt Encelle
1 b
and Karim Sehaba
2 c
1
Univ. Lyon, UCBL, CNRS, INSA Lyon, Centrale Lyon, Univ. Lyon 2, LIRIS, UMR5205, F-69622 Villeurbanne, France
2
Univ. Lyon, Univ. Lyon 2, CNRS, INSA Lyon, UCBL, Centrale Lyon, LIRIS, UMR5205, F-69676 Bron, France
Keywords:
Learning Analytics Dashboards, Systematic Review, Adaptation, Learning Indicators.
Abstract:
Although learning analytics dashboards (LAD) grow in numbers, they often fail to improve learner awareness
as they lack adaptation capabilities. This paper presents a systematic review following the PRISMA statement,
about the adaptation capabilities of LADs based on new definitions for LADs and learning indicators. A
detailed analysis of 23 articles selected among 426 articles retrieved from databases was conducted based on
a coding scheme, centered on adaptation and its dimensions, namely: to whom, what, to what, who, and how.
The main result of this study is that there is more evidence of adaptable LADs than adaptive LADs. As a result,
the road to adaptivity is worth exploring. The analysis of LAD’s common features led us to distinguish mainly
4 adaptable capabilities and 2 adaptive ones. Most of the adaptable capabilities consist of giving exploration
power to the user and providing him with data filtering, zooming, or selection functionalities. In contrast,
users have limited options when it comes to selecting indicators, their visualizations, and organization on
the dashboard. Providing more flexible LADs could enhance their usability and increase learner awareness.
Furthermore, the few adaptive features involve adaptations based on “if-then” rules and there are no reports of
advanced computing techniques such as machine learning that could empower LAD’s adaptation.
1 INTRODUCTION
Since the past years, the rise of hybrid learning activi-
ties and the higher disponibility of learning data have
reinforced interest in learning analytics (LA) which
is the measurement, collection, analysis, and report-
ing of data about learner and their contexts (Siemens,
2011), resulting from users’ interactions with educa-
tional and information technologies (Ga
ˇ
sevi
´
c et al.,
2015). Learning analytics dashboards, defined as
a “single display that aggregates different indicators
about learner (s), learning process(es) and/or learn-
ing context(s) into one or multiple visualizations”
(Schwendimann et al., 2016, p. 37) are the most com-
mon tools used to report the results of learning an-
alytics to many stakeholders such as teachers, learn-
ers or researchers. One of the major limitations of
LADs is that they fail to improve learner awareness as
they lack adaptation capabilities, resulting in less ac-
tionability (Jørnø and Gynther, 2018). This refers to
some challenges pointed out in (Verbert et al., 2020)
such as “one-size-does-not-fit-all” and the need to
a
https://orcid.org/0009-0008-4484-8878
b
https://orcid.org/0000-0002-0734-6480
c
https://orcid.org/0000-0002-6541-1877
deal with data literacy. The adaptation capabilities we
refer to have been in particular specified in the field of
Adaptive Hypermedia Systems (AHS) (Brusilovsky,
2001), with Oppermann (2017) emphasizing the dif-
ference between adaptable systems (adaptability) and
adaptive systems (adaptivity), saying that “Systems
that allow the user to change certain system parame-
ters, and thereby adapt the behavior of these systems,
are called adaptable. Systems that adapt to users au-
tomatically based on monitoring the users’ interaction
during runtime are called adaptive”.
Our main research goal is to explore the state of
the art regarding adaptation capabilities of LADs. We
identified two systematic reviews that are similar to
what we propose. The first is from 2019 and re-
ports on the tailoring capabilities of information dash-
boards (V
´
azquez-Ingelmo et al., 2019), while the sec-
ond is from 2021 and is a replication of the previous
one, centered on performance dashboards (Kruglov
et al., 2021). The main similarity of these reviews
with our study is the shared focus on the adapta-
tion of the dashboards. However, this study focuses
on LADs and analyzes LADs adaptation dimensions
with a finer granularity, while the other studies adopt
a more general analysis framework, not centered on
Barbé, R., Encelle, B. and Sehaba, K.
Adaptation in Learning Analytics Dashboards: A Systematic Review.
DOI: 10.5220/0012628600003693
Paper published under CC license (CC BY-NC-ND 4.0)
In Proceedings of the 16th International Conference on Computer Supported Education (CSEDU 2024) - Volume 2, pages 75-86
ISBN: 978-989-758-697-2; ISSN: 2184-5026
Proceedings Copyright © 2024 by SCITEPRESS – Science and Technology Publications, Lda.
75

learning. Moreover, in these studies a large range
of vocabulary is employed knowing that there is in
general a lack of agreement when speaking of adapta-
tion: terms used do not always refer to the same con-
cepts. For V
´
azquez-Ingelmo et al. (2019), ”A gen-
eral term is necessary, because using “customizable,”
“personalized” or “adaptive” indistinctly to refer to
these solutions, could lead to misconceptions around
these last terms, which, in the end, have different nu-
ances”. In our study, we precise the terms we refer to,
in connection with historical definitions grounded in
the field of adaptive hypermedias.
We tackle the aforementioned challenges and re-
trieve research that focuses on the adaptation of
LADs. First, we define the concepts of learning indi-
cator, LAD, and adaptation dimensions before precis-
ing our analysis framework. Then, using a systematic
review, we provide insights about the implementation
of adaptable and/or adaptive learning dashboards.
In line with what we found in similar works, we
map out such adaptation mechanisms with a level of
detail allowing us to get a proper understanding of
what has been made yet. As a result, this study ad-
dresses the following research questions:
• RQ1: What LADs since 2017 feature adaptability
or adaptivity mechanisms?
• RQ2: What adaptation mechanisms are imple-
mented into LAD, for what purposes?
The remainder of the article is organized as fol-
lows. Firstly, we provide an overview of existing def-
initions for the key concepts of the study before de-
riving our own, to precise the theoretical background
of the review. Secondly, we describe the method we
applied to lead a systematic literature review, follow-
ing the PRISMA statement (Page et al., 2021). We
then jointly present and discuss the findings for each
research question. Finally, we report the known limi-
tations of our study before concluding.
2 KEY STUDY CONCEPTS
DEFINITIONS AND RELATED
LITERATURE
2.1 Learning Indicators (LI)
The term ”indicator” is commonly used across vari-
ous scientific disciplines. Nonetheless, there is lim-
ited literature defining this term in the field of educa-
tion. According to Muslim et al. (2017), an indicator
can be defined as “a specific calculator with corre-
sponding visualizations, tied to a specific question”.
Ahmad et al. (2022) provided a comprehensive def-
inition: “an indicator is the result of the analysis of
one or multiple metrics and gives a more comprehen-
sive picture of a particular (abstract) learner status, for
example, student engagement and so forth [...]”. For
Dimitracopoulou (2004):
The application of ‘data processing methods’
produces one or more ‘indicators’, that indi-
cate something’ related to the ‘quality’ of in-
dividual activity, the mode or the quality of
the collaboration, the quality of the collabora-
tive product, or the appropriateness of its pro-
duction process. These variables interpreted,
taking into account, the learning activity, the
profile of the participants and the context of
interaction could support interaction partici-
pants on the level of awareness, or of the (self)
assessment.
According to these definitions, we suggest that a
learning indicator is a metric or latent variable that re-
sults from the analysis of data associated with a learn-
ing activity. To elaborate, we distinguish, in line with
the metric concept defined by Ahmad et al. (2022),
low-level indicators which are observable and calcu-
lated from the raw data of a learning activity, from
higher-level indicators which are abstract variables
derived from raw data and/or lower-level indicators.
2.2 Learning Analytics Dashboard
(LAD)
Various fields integrate dashboards into their practices
(e.g. Business Intelligence, Logistics, Healthcare).
Few says that “A dashboard is a visual display of the
most important information needed to achieve one or
more objectives; consolidated and arranged on a sin-
gle screen so the information can be monitored at a
glance.” (Few, 2006). For Brouns et al. (2015), it’s
”An easy to read, often single page, real-time user in-
terface, showing a graphical presentation of the cur-
rent status (snapshot) and historical trends of an or-
ganization’s key performance indicators (KPIs) to en-
able instantaneous and informed decisions to be made
at a glance.”. In the field of learning, LAD definitions
share similarities with the previous ones. A recent
definition is: “a learning dashboard is a single dis-
play that aggregates different indicators about learner
(s), learning process(es) and/or learning context(s)
into one or multiple visualizations.” (Schwendimann
et al., 2016). Yoo et al. (2015) consider a dashboard
as “a display which visualizes the results of educa-
tional data mining in a useful way”. Others see them
as “visualisations of learning traces” (Steiner et al.,
2014) and Podgorelec and Kuhar (2011) consider that
CSEDU 2024 - 16th International Conference on Computer Supported Education
76

“the Learning Analytics Dashboard (LAD) is an inter-
active, historical, personalized, and analytical moni-
toring display that reflects students’ learning patterns,
status, performance, and interactions. The outlook of
LAD includes visual elements such as charts, graphs,
indicators and alert mechanisms.”.
Taking a closer look at each definition, it’s notice-
able that their authors do not place equal emphasis
on dashboard characteristics. Some definitions com-
plement each other, while others share traits such as
the central concept of visualization, the use of learn-
ing traces, usability, and the objective of supporting
awareness and decision-making. However, the con-
cept of a single screen and/or display is to our mind
ambiguous (e.g. is a window with several tabs con-
sidered as a single display or multiple display(s) ? Is
a window split on multiple monitors considered as a
single or multiple display(s) ?). To capitalize on these
previous definitions and to clarify our study terms, we
suggest a formal yet flexible definition of a LAD. We
propose dropping the single display aspect and con-
sidering a LAD as an ordered aggregation of indica-
tors - usually represented using visualizations - which
support awareness, and decision-making in relation to
one or more objectives related to learning.
2.3 Insights About Adaptation and Its
Dimensions
In addition to adaptability and adaptivity, systems
adaptation also refers to the development of systems
tailored to meet specific user profiles. This study will
not cover adapted LADs, as there is already exten-
sive research utilizing participatory designs or user-
centered methods during the conception of LADs.
The focus of this study is primarily on adaptable
and adaptive dashboards. Park et al. (2023) de-
fined an adaptive learning analytics dashboard as “a
specific learning environment where learners’ learn-
ing progress, performance, and adaptive recommen-
dations were provided on a real-time basis through
their LAD.”. In contrast, our study does not con-
sider adaptive environments in general, but rather the
adaptation capabilities of LADs themselves. Start-
ing from the definitions given in (Brusilovsky, 2001;
Brusilovsky and Mill
´
an, 2007; Oppermann, 2019), a
reformulation is proposed to make these definitions,
initially taken from AHS, applicable to LADs:
• Adaptable learning dashboard (adaptability): the
adaptation of the dashboard is triggered by the
user, following some of his interactions with the
LAD
• Adaptive learning dashboard (adaptivity): the
adaptation of the dashboard is automatically trig-
gered by the system itself, without any user inter-
vention
The adoption of the Five W’s (Who, What, Where,
When, Why) is a common practice in many fields to
overview a system. In this study, we analyze the adap-
tation dimensions we want to describe by adapting
and combining these questions:
• To whom (Who is the target of the adaptation ?):
in most cases, the user is either a learner, a teacher,
or a researcher.
• Who (Who initiates the adaptation ?): in adapt-
able cases, the user initiates the adaptation while
in adaptive cases, the system itself triggers the ad-
justments.
• To what (on what data and/or knowledge about
users are adaptations based ?): it’s only relevant
to monitor data involved in adaptive cases since it
is always a user input in adaptable cases.
• What (What is adapted in LAD): describing the
effects and changes occurring on the LADs.
• How (Which methods are involved in the adapta-
tion process ?): from a system perspective, what
are the steps in the decision-making process that
lead to adapting one thing over another?
3 METHODS
This section describes the steps and methods used to
conduct the review. A systematic review method-
ology was chosen due to its well-formalized frame-
work outlined by the PRISMA statement (Page et al.,
2021), and because this approach is becoming in-
creasingly popular, not only in the LA research field.
It consists of identifying academic databases to search
into, formulating queries to effectively address our re-
search questions, adding constraints to filter the abun-
dant records collected, and then describing the pro-
cess of analyzing the reports included in the study.
3.1 Identification of Databases
We first identified suitable databases for our study us-
ing previous systematic reviews which are grounded
in the field of LA such as (Matcha et al., 2019;
Bodily et al., 2018; Jivet et al., 2018; Papamitsiou
and Economides, 2014). Then, we ranked our in-
sights by popularity and compared the most fre-
quently used databases (IEEE Xplore, ACM Digital
Library, SpringerLink, ScienceDirect, ERIC) with the
findings of Gusenbauer and Haddaway (2020), re-
porting well-suited academic search systems for sys-
Adaptation in Learning Analytics Dashboards: A Systematic Review
77
tematic reviews. Lastly, we retained ACM Digi-
tal Library (ACM DL) as our principal data source
and complemented it with IEEE Xplore (IEEE) and
Web of Science (WoS). To complete records identi-
fication, we also searched specifically in conference
proceedings and journals related to the LA research
field. We scanned LAK (Learning Analytics and
Knowledge) and L@S (Learning at Scale) proceed-
ings because such conferences are related to learning,
we also looked at UMAP (User Modeling, Adapta-
tion and Personalization) proceedings for its focus on
adaptation and personalization and we investigated in
the Journal of Learning Analytics.
3.2 Search Terms and Requests
To answer our research questions, we designed a
query to question the search engines and gather
records in connection with LAD built around learner’s
data and any adaptation techniques. In a similar way
to the academic databases identification, we selected
relevant keywords from previous reviews. Then, we
supplemented these with keywords we found through
our readings to either restrict or extend the results to
what interests us most. After iterative adjustments,
we conducted searches within each database in the
corpus using data from titles, abstracts, and keywords,
structured around a query comprising four parts:
• (A) (dashboard OR visual*): restrict to papers ex-
plicitly mentioning a dashboard or something re-
lated to visualization.
• (B) (”LA” OR “learning analytics” OR “learning
analytic” OR “educational data mining” OR “edu-
cational datamining”): restrict the application do-
main to learning analytics. We also included key-
words for data mining because the boundary with
the LA is thin.
• (C) (tailor* OR adapt* OR custom* OR intel-
ligent OR individual* OR personal* ): restrict
to the main topic of our study, by including the
words related to adaptation that are very often
used by authors.
• (D) (learner OR student): restrict results to works
based on learner data. We included “student” be-
cause it’s a term often used in the field of educa-
tion.
The resulting query combines all expressions and is
adapted to the specifications of each search engine at
search time. Finally, for searching in conferences and
journals dedicated to learning, knowing that LA key-
words are not necessarily employed, we used a sim-
pler query by removing part (B) from Formula 1.
Query = (A) and (B) and (C) and (D) (1)
3.3 Delimiting the Search
As we intend to complete the map of the exist-
ing adaptable or adaptive LADs, we take 2017 as
a starting point, in line with the results achieved
by (V
´
azquez-Ingelmo et al., 2019). We filtered the
records by date using search engines’ built-in func-
tionalities. In addition, we systematically excluded
records for which we were unable to obtain the re-
port (it’s a “document (paper or electronic), supply-
ing information about a particular study. It could
be a journal article, preprint, conference abstract,
study register entry, clinical study report, disserta-
tion, unpublished manuscript, government report, or
any other document providing relevant information”
(Page et al., 2021, p. 3)). A two-step filtering process
was conducted on the resulting records, based on in-
clusion criteria (see Table 1). The first step involved
excluding records after reading titles, abstracts, and
keywords. The second step involved reading the en-
tire texts of the remaining records.
Table 1: Inclusion criteria.
We added IC (inclusion criterion) 1-2-3 as cri-
teria to guarantee a minimum quality of the
publications to be included in our analysis
IC1 The paper must be written in English
IC2 The paper must have been peer-reviewed
IC3 The paper must be a complete study, ie. we
exclude everything which is a short paper
(less than 5 pages), a review, a poster, an ab-
stract, a work in progress, etc.)
We added IC4-5-6 to keep only records that
could answer our topics
IC4 The paper must describe a learning analytics
dashboard (it must relate to learners)
IC5 The paper must describe one or more adap-
tation mechanisms of the dashboard
IC6 The paper must show evidence of an evalua-
tion of the dashboard
We added IC7-8 to make sure we only study
unique solutions or the most mature ones
IC7 The paper must be the most mature solution
of a series of research (duplicates removal)
IC8 The paper must not present an existing dash-
board without proposing new features
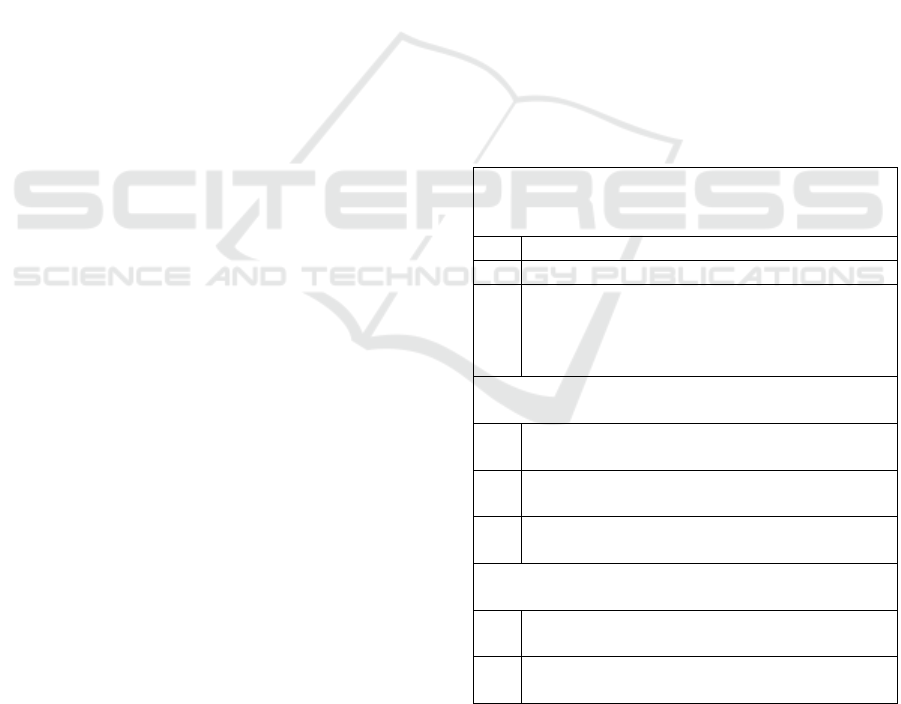
The process up to the selection of the final pool
of articles is illustrated in the PRISMA flow diagram
(see Figure 1).
CSEDU 2024 - 16th International Conference on Computer Supported Education
78
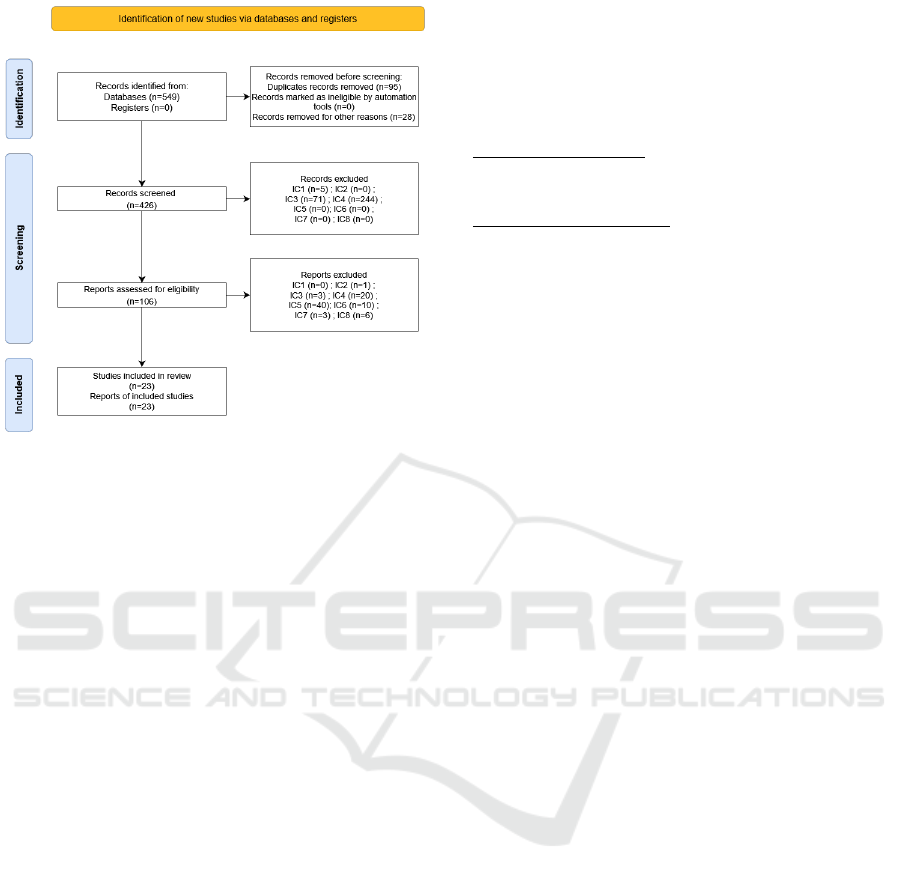
Figure 1: PRISMA inspired flow diagram.
3.4 Coding Scheme
The initial coding objective is to provide an overview
of each LAD by identifying its target (to whom:
learner, teacher, adviser, institutional. . . ) and of the
type of learning analytics presented by the indicators.
The indicators are classified using the terms presented
by Gartner, (2014) and the definitions in (Susnjak
et al., 2022; Sirje Virkus, 2023):
Descriptive Indicators: indicators showing data
about learner past actions. e.g. An indicator show-
ing how many modules a learner has completed yet
Diagnostic Indicators: indicators giving in-depth in-
sights about identified learner/learning state. e.g. The
dashboard shows that the learner didn’t pass his year
because of his lack of regularity
Predictive Indicators: indicators showing estimation
of future outcomes based on current and past data
analysis. e.g. An indicator showing the probability
a student will pass a test
Prescriptive Indicators: indicators aiming to rec-
ommend future actions. e.g. An indicator showing a
list of recommended learning material to work on to
improve a point of weakness
Note that we won’t describe the nature of the data
used to calculate the indicators, but the nature of the
indicators themselves: whereas descriptive data are
required to compute predictive data, there are no such
relations for the indicators, which means that a dash-
board can present predictive indicators only, without
any descriptive ones.
The second coding goal is to describe the adap-
tation mechanisms present in the papers according
to 4 dimensions of adaptation: “Who”, “To what”,
“What”, “How”. As a result, we expanded our
coding scheme for describing each dimension with
the following codes:
Dimension 1 - Who ? Who initiated the adaptation
process ? It’s either the user or the system itself.
Dimension 2 - To what ? What data/knowledge about
users are used to perform the adaptation ?
User’s Configuration: user actions to trigger a spe-
cific system behavior. e.g. The user selects a date
range or some data to “zoom in/out”. The user mod-
ifies the font size.
Prior Knowledge, Knowledge Growth: any data re-
lated to a learner model that can be used to report
on its progress in terms of knowledge or skills. e.g.
The history of what a learner has learned or mastered
since he enrolled in the online course.
Learning Paths: any data reporting the learning
paths or sequences of a learner within a learning ap-
plication e.g. The learner first read the course mate-
rials and then tried the quizzes.
Performance: any data related to an evaluation
and/or an assessment task which indicates a learner’s
performance at a given time. e.g. The learner’s
grades for the semester.
Engagement, Motivation: any data or data aggrega-
tion which can be used to monitor the engagement
of a learner (activity logs, emotional or expressive
data. . . ). e.g. The learner’s engagement is in line with
his login frequency.
Metacognition: any data related to the learner’s
metacognitive state such as his self-regulated learning
level, the learning strategies or the methods he uses to
learn or solve problems. . . e.g. Learning objectives
formulated by the learner.
Collaboration: any data that highlights collabora-
tion or interactions between the stakeholders during
a learning activity/process. e.g. The number of times
a specific learner asked his teacher for help.
Socio-Demographic Data: any data related to the
socio-demographic profile of a learner. e.g. The
learner is twenty years old and he is funded by a
scholarship.
Data Availability: when the data usually used to
compute some indicator is not available yet. It is sim-
ilar to a cold start. eg. The dashboard can’t compute
Adam performance metrics because he hasn’t passed
any test yet.
User’s Preferences: any data inferred from previous
user configurations and/or log analysis. These data
Adaptation in Learning Analytics Dashboards: A Systematic Review
79

are a product of past user-system interactions. e.g.
The system has learned from the logs that the user
has a preference for line charts
Dimension 3 - What ? Which elements of the LAD
are adapted ?
Indicators Set: the combination of indicators within
the LAD is changed. In particular, indicators can be
added, removed, or re-calculated to change the mean-
ing of the feedback conveyed by the dashboard. e.g.
A new indicator appears in the LAD
Indicators Importance: an indicator or a sub-set
of indicators can be highlighted. The degree of im-
portance could be modified using for instance visual
tricks or by changing indicator relative positions. e.g.
Indicator 1 is now the most important and its visual-
ization size increased.
Indicators Visualization: a visualization can be as-
sociated with one or more learning indicators. Some-
times, visualizations can change while the indicators
remain the same. e.g. The data are now presented
with a bar chart instead of a pie chart.
Indicators Timing: an indicator can be presented af-
ter a delay or at a given time, which can be configured.
e.g. The feedback was presented after each learning
session but is now presented only one session out of
two.
Indicators Source Data: when the data used to
compute the indicator is changed (filtered, modi-
fied. . . ), the indicator remains the same as long as the
data model is unchanged. e.g. The indicator is now
showing Adam’s grades instead of Collin’s grades.
Dimension 4 - How ?
How is the adaptation decided ?
Rules Engine: the adaptation is realized following
simple ‘if-then” rules. e.g. The alert box is shown
only if the learner underperformed his test.
Algorithms: the adaptation is realized following
more advanced programming concepts which are
more complex than ‘if-then” rules (e.g. loops). e.g.
Heavy calculation is needed before deciding if the
dashboard must include a particular indicator.
Machine Learning: to go further than “if-then” rules
and advanced programming concepts, the adaptation
is realized using machine learning. e.g. A prediction
machine learning algorithm is used to decide whether
or not it’s good to visualize a set of indicators with a
bar chart instead of a pie chart.
How is the adaptation performed ?
Activation/Deactivation: action to activate or deac-
tivate an indicator, to make a component appear or
not. . . e.g. A new indicator is now shown in the dash-
board.
Refine Data: action often associated with the fact to
filter, select, or brush the data. The output value of
the indicator is actualized but the indicator remains
the same. e.g. The indicator showing Adam’s grades
for week 2 is now showing Adam’s grades for week 5.
This coding scheme is the result of several iterations
of analysis of samples of articles and associated dis-
cussions. Each iteration enabled us to refine/improve
the previous version of the coding scheme until we
obtained a coding scheme that we consider stable and
complete. Finally, coding was carried out by a unique
coder to ensure homogeneity.
4 RESULTS & DISCUSSIONS
In this part, we jointly present the analysis results and
discuss them regarding our research questions. Raw
data, resulting from our analysis, are shown in Table
2 where we conveniently removed empty columns for
visualization purposes. The systematic process we
followed led us to review 426 papers to determine
if they described adaptable or adaptive LADs. Af-
ter two screening steps and applying inclusion crite-
ria, we ended up with 23 papers integrating adapta-
tion mechanisms to analyze (see Figure 1). As there
is only one LAD per report read, we assume that say-
ing report, publication, LAD, or paper refers to the
same thing.
4.1 RQ1: What Dashboards Since 2017
Feature Adaptability or Adaptivity
Mechanisms?
As shown in Figure 2, we reported publications in-
cluding adaptable features every year since 2017, with
a total of 19 LADs. In contrast, publications embed-
ding adaptive features were only found in 2018 (n=1),
2019 (n=3), 2020 (n=2), and 2021 (n=1), with a total
of 7 LADs. As a result, we have found more evidence
of adaptability than evidence of adaptivity (19 against
7). We assume our sample size is too limited to dis-
cuss any trend. We report and discuss below the na-
ture of indicators involved in adaptable and adaptive
LADs respectively. Descriptive indicators are found
in all papers and are the most commonly used (n=19;
n=7), followed by diagnostic indicators (n=8; n=6),
then predictive and prescriptive indicators (n=1; n=2).
Table 3 shows for each adaptation category the per-
centage ratio of the number of LADs including de-
scriptive, diagnostic, predictive, and prescriptive in-
dicators respectively, over the number of LADs re-
CSEDU 2024 - 16th International Conference on Computer Supported Education
80
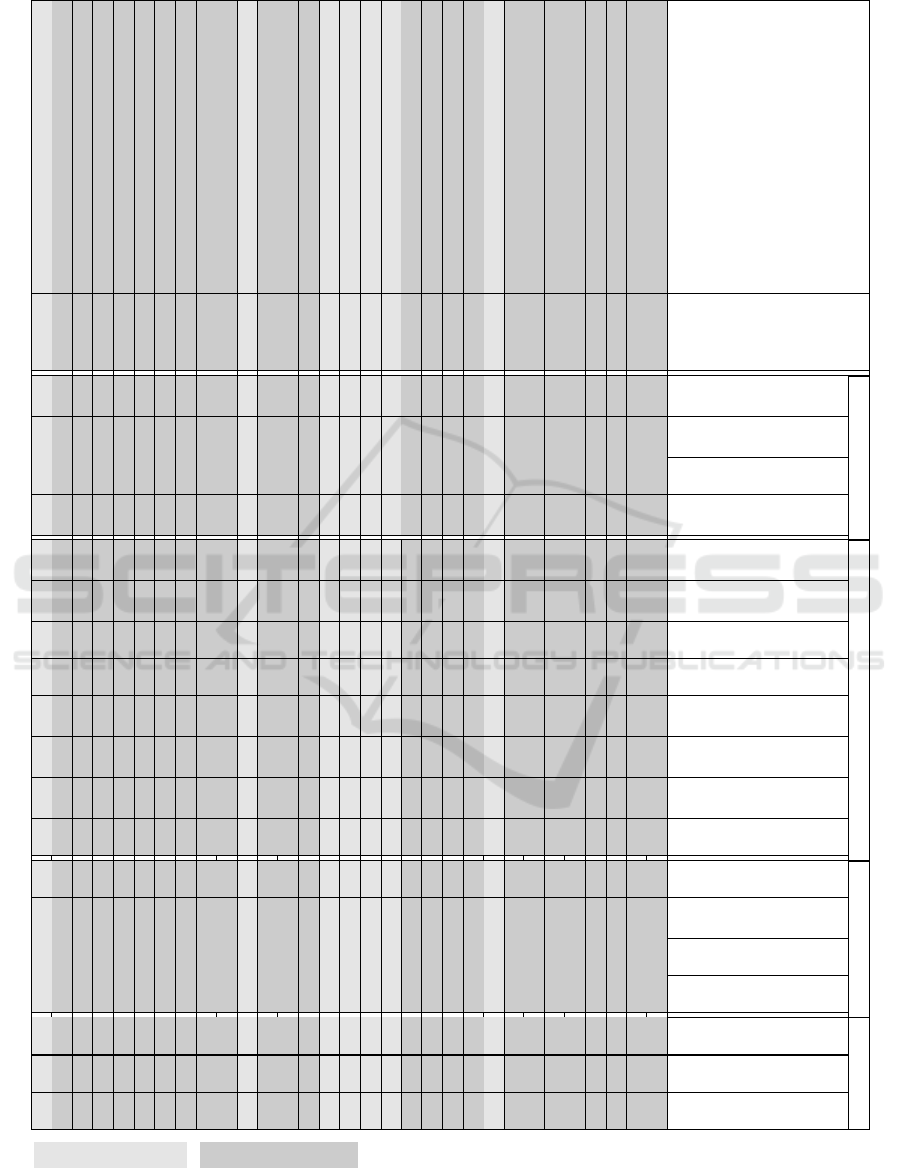
Table 2: Analysis findings.
Authors
End user
Indicators nature To what What How
Descriptive
Diagnostic
Predictive
Prescriptive
User’s configuration
Knowledge
Paths
Performance
Engagement, motivation
Metacognition
Data availability
Preferences
Selection
Importance
Visualization
Source data
Rules
Activation
Refine
• • •
(Hasnine et al., 2023) T • •
• • •
(Hou et al., 2022) L • • • •
(J. A. Ruip
´
erez-Valiente et al., 2021) T • • • • •
• • •
(Al-Doulat et al., 2020) A •
• • •
• • •
(Mohseni et al., 2022) T • •
• • •
• • • •
(Chaudy and Connolly, 2018) T, D, R • •
• • •
(Zamecnik et al., 2022) L • • • • •
(van der Stappen, 2018) I • • • • • • •
• • •
(D. P
´
erez-Berenguer et al., 2020) L, T • •
• • • • •
(S¸ahin and Yurdug
¨
ul, 2019) L • • • • • • •
(Aslan et al., 2019) T • • • • • •
(Molenaar et al., 2020) L • • • • • • • •
(Jivet et al., 2021) L • • • •
• • • •
(de Quincey et al., 2019) L • • • •
• • •
(T. Rohloff et al., 2019) L • • • • • • •
• • •
(Chen et al., 2018) T •
• • •
(Scheffel et al., 2017) L • • • •
(Jonathan et al., 2017) L • • • •
(Smith, 2020) L • • • •
(Taibi. et al., 2018) L • • • •
(Ez-zaouia and Lavou
´
e, 2017) T • • • • •
(Torre et al., 2020) P • • • •
• • •
(Dickler, 2021) T • •
• • •
Light gray = Adaptive ; Dark gray = Adaptable
L=Learner; T=Teacher; A=Advisor; R=Researcher ; D=Developer; I=Institutional; P=Practitioner.
Adaptation in Learning Analytics Dashboards: A Systematic Review
81
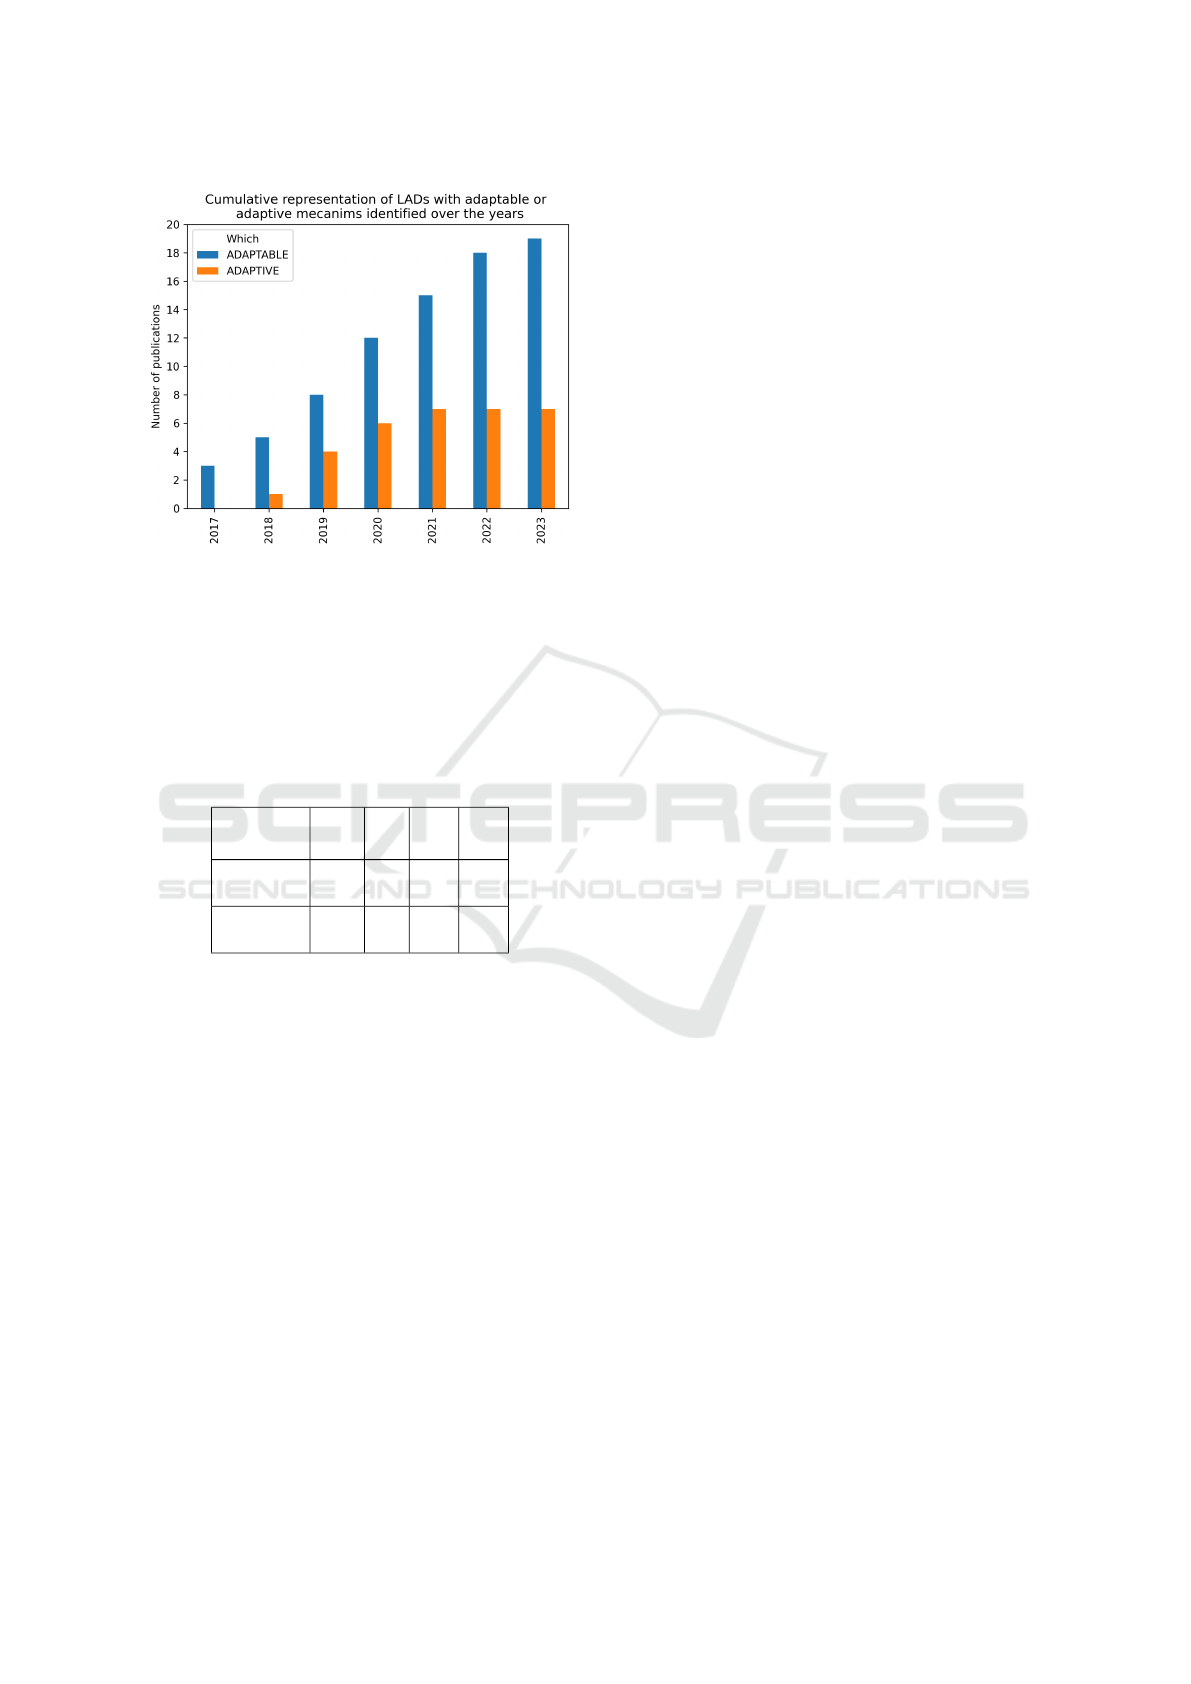
Figure 2: Cumulative publications since 2017.
spectively. As a result, there are always descriptive
indicators in both adaptable and adaptive LADs and
the ratio is increasing between adaptable and adap-
tive LADs for other types of indicators. Based on this
analysis, we hypothesize that adaptive LADs embed
more complex indicator natures, such as diagnostic,
predictive, and prescriptive than adaptable LADs.
Table 3: Indicator’s nature ratio.
%
Desc.
Diag.
Pred.
Pres.
Adaptable
(n=19)
100 42 5.2 5.2
Adaptive
(n=7)
100 86 29 29
Last but not least, we mostly report dashboards for
learners (n=11) and teachers (n=8), one targeting both
learners and teachers and three others for advisers, in-
stitutional, and practitioners. There is no noticeable
trend or evolution of the targeted end users over time.
4.2 RQ2: What Adaptation
Mechanisms Are Implemented into
LAD, for What Purposes?
4.2.1 Adaptive LADs
Most of the expected data types have been found,
except for collaboration data and socio-demographic
data. Additionally, during the adaptive process, two
out of seven LADs use two types of data instead
of one. The adaptive capabilities can be grouped
into two main categories, based on similarities shared
across “What” and “How” dimensions.
The first category (n=5) concerns LADs that can
activate and/or deactivate certain indicators on their
own, thereby altering the resulting set of indicators.
Two publications include “all or nothing” indicators
as contextual notifications are displayed to the user.
For instance, in (Molenaar et al., 2020), indicators
are added to the screen to notify the learner that he
has completed the learning goals he set. In (Aslan
et al., 2019), a red bell appears on the correspond-
ing learner’s avatar when he is highly disengaged,
indicating that he is off the learning platform. In
(de Quincey et al., 2019) the authors insist on the
use of empty states to enhance the learning process:
some indicators are replaced with other learning ma-
terials, such as basic recommendations, when there is
not enough data to compute them. Replacement indi-
cators show personalized recommendations or various
descriptive data. The LAD of D. P
´
erez-Berenguer
et al. (2020) is adaptive due to the dynamic selection
of the indicators displayed on the screen. The deci-
sion process is based on rules that can be edited by
the teacher and the rule engine can be fed either by
performance or event sequences data of the learners.
Finally, the LAD in (S¸ahin and Yurdug
¨
ul, 2019) can
complement the set of indicators by activating addi-
tional feedback to learners who have been classified
as poor performers by the system.
The second adaptivity category includes LADs
that automatically update their indicators when the
corresponding source data is changing (n=2). In
(Chaudy and Connolly, 2018), the LAD automati-
cally restricts the data accessible to a user based on
their role upon login. Teachers are limited to moni-
toring their students while administrators of the sys-
tem, such as developers or researchers, have access
to data from all the students. In (Dickler, 2021), the
LAD computes and triggers alerts from student data.
We consider this LAD to be adaptive because each
alert, whether it’s focused on a student in particular
or a group of students, pre-defines the data that the
teacher can consult after clicking on one of the noti-
fications. The teacher navigates through the data au-
tomatically selected by the LAD and doesn’t know in
advance what he will be able to monitor.
Table 2 data highlights that the use of rules pre-
dominates to activate or deactivate learning indica-
tors. It’s important to notice that no complex al-
gorithms or machine learning were reported in the
adaptation/decision process, leaving research on these
questions open. As previously reported, the two adap-
tivity capabilities only involve changes in the set of in-
dicators of the LAD or changes in the available source
data. Our analysis didn’t reveal any adaptation from
the system that focuses on changing the relative im-
portance (order) of indicators, visualizations that sup-
CSEDU 2024 - 16th International Conference on Computer Supported Education
82

port the reporting of data, or any delay that could be
considered before presenting one or more indicators
to a user.
4.2.2 Adaptable LADs
There is not much to discuss regarding the “To what”
dimension as all reported functionalities correspond
to a user input (User’s configuration). In this section,
we organize and discuss the results according to the
“What” and “How” dimensions. Adaptable capabili-
ties are grouped into four categories based on shared
configurations.
Most of the LADs (n=15) are featured with the
functionality that consists in updating the dashboard
indicators when the user selects a new subset of data,
such as changing the date range (Hou et al., 2022;
Zamecnik et al., 2022; Scheffel et al., 2017; Mohseni
et al., 2022; Taibi. et al., 2018), subgroup or sub-
data to monitor (Hasnine et al., 2023; J. A. Ruip
´
erez-
Valiente et al., 2021; Torre et al., 2020; Chaudy and
Connolly, 2018; Chen et al., 2018; Al-Doulat et al.,
2020; Dickler, 2021; Jonathan et al., 2017; Taibi.
et al., 2018; Ez-zaouia and Lavou
´
e, 2017; Smith,
2020). This functionality mainly corresponds to filter,
select, and zoom actions. It is worth noting that the
codes “Refine data” and “Indicator data” are strongly
correlated. Note that the nature of the indicators re-
mains the same, even if the values they return change.
This is because the indicators still answer the same
initial question.
It seems that some LADs (n=4) allow the user to
change/choose the indicators presented in the dash-
board through activation/deactivation. Among them,
two LADs enable the user to select their visualiza-
tions. Jivet et al. (2021) allowed learners to se-
lect up to six indicators from a choice of twelve to
be displayed on a radar chart. The learners could
change their choices at any time. Three distinct
functionalities were identified in the LAD developed
by de Quincey et al. (2019). The first allows the
learner to choose between a professional visualiza-
tion with common charts and diagrams or a per-
sonified theme that represents indicators with visual
metaphors: icons and images representing the con-
cepts are used instead of bar, line, or pie charts. The
second allows the learner to select the indicators he
prefers to monitor. The third consists of displaying
a contextual indicator (a tooltip) when the learner re-
quests it, providing additional explanations on how
the current score is calculated. The LAD presented
in (Hasnine et al., 2023) enables the user to access
a session summary on demand. It presents a more
general set of learning indicators than the real-time
indicators presented during the session. The analysis
dashboard, as presented in (Chen et al., 2018) allows
the teacher to progressively drill down into student
data, and some actions or specific inputs of the teacher
will result in the apparition of contextual indicators.
The following LADs (n=2) seem to feature adap-
tation capabilities, which involve recomputing the in-
dicators to fit a new subset of data, along with other
effects on the set of indicators or their relative impor-
tance. In (Zamecnik et al., 2022), the learner has
filtering functionalities, but the indicator set is also
likely to change since the learner can remove certain
types of information, which alters the nature of the
indicators. In (van der Stappen, 2018) the authors
propose a customizable LAD. It’s mentioned that the
users can personalize the order in which visualiza-
tions are displayed.
Finally, there are two dashboards (n=2) that al-
low the user to configure the indicators he wishes
based on the edition of rules. The design proposed by
van der Stappen (2018) includes adaptation mecha-
nisms, such as the capability for the user to customize
the indicators on the LAD using SQL queries and se-
lect their associated visualizations. Similarly, teach-
ers can set adaptation rules using a specific domain
language as presented in (D. P
´
erez-Berenguer et al.,
2020) to determine which indicators will be present
at execution time, depending on the input learning
traces.
Neither algorithms nor machine learning power
the adaptability mechanism after the user triggers the
adaptation. It’s important to note that we are refer-
ring to the decision step of the adaptation and not to
the steps used to compute the learning indicators. Ad-
ditionally, as reported for adaptivity mechanisms, no
features allow the user to configure a delay that the
LAD should respect before presenting one or more
indicators.
5 LIMITATIONS
The study has some limitations. Firstly, we examined
the proceedings of specialized conferences, namely
LAK, L@S, and UMAP but we were unable to do so
for the Educational Data Mining conference (EDM)
due to restrictions upon the EDM proceedings search
engine. Secondly, our study could benefit from the in-
tegration of more data sources, notably LADs identi-
fied by other means than academic databases. Thirdly,
it could be difficult to deal with the analysis step as
adaptation mechanisms were not always clearly de-
scribed by the authors. Concerned papers have been
discussed by experts until a consensus was reached.
To improve the analysis step, it could be beneficial
Adaptation in Learning Analytics Dashboards: A Systematic Review
83

to involve multiple coders and calculate an inter-rater
reliability metric.
6 CONCLUSIONS
A systematic review was conducted to investigate the
adaptation capabilities of LADs in terms of adaptabil-
ity and adaptivity. An analysis framework was de-
signed to reduce the diversity of the vocabulary used
when reporting on adaptation capabilities. Our find-
ings highlighted less work on adaptive dashboards
than on adaptable dashboards since 2017. Our de-
tailed coding scheme helped us to identify categories
of adaptation capabilities and gave us more insights
about the learner data used for adaptivity. There
is currently little focus on the adaptation function-
alities of LADs, and there is likely insufficient evi-
dence to support their benefits at this time. Going fur-
ther, it could be profitable to investigate the effects of
such adaptations on user’s perception, behavior, and
learning in future research. Additionally, the analysis
has pointed out paths that could be explored further.
These include the utilization of advanced computing
techniques in the adaptation process, adaptive capa-
bilities that could be based on more, or new types of
data, and functionalities that show up differently on
the dashboard, such as the adaptation of the indica-
tor’s relative importance or time-delayed presentation
of indicators according to learners’ needs.
To nuance this review, we have identified sev-
eral papers that were not included in the analysis
but which are representative of some of the work on
LADs. One body of research focuses on the develop-
ment of intelligent learning indicators (e.g. (Khos-
ravi et al., 2021)) which could be associated by tran-
sition with work on intelligent LAD. Another body
of research, such as (Dabbebi et al., 2017; V
´
azquez-
Ingelmo et al., 2020), focuses on the development of
“meta dashboards” instead of a particular intelligent
LAD.
ACKNOWLEDGEMENTS
This research is funded by TOKATAB SAS, the
French Agency of Research and Technology [ANRT,
grant number 2022/0171] and the LABEX ASLAN,
Universit
´
e de Lyon, within the framework of the
French program ”Investissements d’Avenir” managed
by the ”Agence Nationale de la Recherche” (ANR).
REFERENCES
Ahmad, A., Schneider, J., Griffiths, D., Biedermann, D.,
Schiffner, D., Greller, W., and Drachsler, H. (2022).
Connecting the dots–a literature review on learning
analytics indicators from a learning design perspec-
tive. Journal of Computer Assisted Learning.
Al-Doulat, A., Nur, N., Karduni, A., Benedict, A., Al-
Hossami, E., Maher, M. L., Dou, W., Dorodchi, M.,
and Niu, X. (2020). Making sense of student success
and risk through unsupervised machine learning and
interactive storytelling. In Artificial Intelligence in Ed-
ucation: 21st International Conference, AIED 2020,
Ifrane, Morocco, July 6–10, 2020, Proceedings, Part I
21, pages 3–15. Springer.
Aslan, S., Alyuz, N., Tanriover, C., Mete, S. E., Okur, E.,
D’Mello, S. K., and Arslan Esme, A. (2019). Inves-
tigating the impact of a real-time, multimodal student
engagement analytics technology in authentic class-
rooms. In Proceedings of the 2019 chi conference on
human factors in computing systems, pages 1–12.
Bodily, R., Kay, J., Aleven, V., Jivet, I., Davis, D., Xhakaj,
F., and Verbert, K. (2018). Open learner models and
learning analytics dashboards: a systematic review.
In Proceedings of the 8th international conference on
learning analytics and knowledge, pages 41–50.
Brouns, F., Zorrilla, M.,
´
Alvarez Saiz, E. E., Solana-
Gonz
´
alez, P., Cobo, A., Rocha, R., Via
˜
na, M., Hoyos,
C., Silva, M., Lazo, C., Barroso, J., Arranz, P., Garc
´
ıa,
L., Silva, A., S
´
aez-L
´
opez, J.-M., Exp
´
osito, P., Torre,
M., Mar
´
ıa, F., and Vi
˜
nuales, J. (2015). ECO D2.5
learning analytics requirements and metrics report.
Brusilovsky, P. (2001). Adaptive hypermedia. 11(1):87–
110.
Brusilovsky, P. and Mill
´
an, E. (2007). User models for
adaptive hypermedia and adaptive educational sys-
tems. In Brusilovsky, P., Kobsa, A., and Nejdl, W.,
editors, The Adaptive Web, volume 4321, pages 3–
53. Springer Berlin Heidelberg. Series Title: Lecture
Notes in Computer Science.
Chaudy, Y. and Connolly, T. (2018). Specification and eval-
uation of an assessment engine for educational games:
Empowering educators with an assessment editor and
a learning analytics dashboard. Entertainment Com-
puting, 27:209–224.
Chen, Q., Yue, X., Plantaz, X., Chen, Y., Shi, C., Pong,
T.-C., and Qu, H. (2018). Viseq: Visual ana-
lytics of learning sequence in massive open online
courses. IEEE transactions on visualization and com-
puter graphics, 26(3):1622–1636.
D. P
´
erez-Berenguer, M. Kessler, and J. Garc
´
ıa-Molina
(2020). A Customizable and Incremental Process-
ing Approach for Learning Analytics. IEEE Access,
8:36350–36362.
Dabbebi, I., Sebastien, I., Jean-Marie, G., Madeth, M., and
Serge, G. (2017). Towards adaptive dashboards for
learning analytic - an approach for conceptual design
and implementation. pages 120–131.
de Quincey, E., Briggs, C., Kyriacou, T., and Waller, R.
(2019). Student Centred Design of a Learning An-
CSEDU 2024 - 16th International Conference on Computer Supported Education
84

alytics System. In Proceedings of the 9th Interna-
tional Conference on Learning Analytics & Knowl-
edge, LAK19, pages 353–362, New York, NY, USA.
Association for Computing Machinery.
Dickler, R. (2021). Using innovative methods to explore the
potential of an alerting dashboard for science inquiry.
Journal of learning analytics, 8(2).
Dimitracopoulou, A. (2004). State of the art on interaction
and collaboration analysis.
Ez-zaouia, M. and Lavou
´
e, E. (2017). EMODA: a tutor
oriented multimodal and contextual emotional dash-
board. In Proceedings of the Seventh International
Learning Analytics & Knowledge Conference, LAK
’17, pages 429–438, New York, NY, USA. Associa-
tion for Computing Machinery.
Few, S. (2006). Information dashboard design: The effec-
tive visual communication of data. O’Reilly Media,
Inc.
Ga
ˇ
sevi
´
c, D., Dawson, S., and Siemens, G. (2015). Let’s
not forget: Learning analytics are about learning.
TechTrends, 59:64–71.
Gusenbauer, M. and Haddaway, N. R. (2020). Which aca-
demic search systems are suitable for systematic re-
views or meta-analyses? evaluating retrieval qualities
of google scholar, PubMed, and 26 other resources.
11(2):181–217.
Hasnine, M. N., Nguyen, H. T., Tran, T. T. T., Bui,
H. T., Akc¸apınar, G., and Ueda, H. (2023). A real-
time learning analytics dashboard for automatic de-
tection of online learners’ affective states. Sensors,
23(9):4243.
Hou, X., Nagashima, T., and Aleven, V. (2022). Design
a dashboard for secondary school learners to sup-
port mastery learning in a gamified learning environ-
ment. In European Conference on Technology En-
hanced Learning, pages 542–549. Springer.
J. A. Ruip
´
erez-Valiente, M. J. Gomez, P. A. Mart
´
ınez, and
Y. J. Kim (2021). Ideating and Developing a Visu-
alization Dashboard to Support Teachers Using Ed-
ucational Games in the Classroom. IEEE Access,
9:83467–83481.
Jivet, I., Scheffel, M., Specht, M., and Drachsler, H.
(2018). License to evaluate: Preparing learning an-
alytics dashboards for educational practice. In Pro-
ceedings of the 8th international conference on learn-
ing analytics and knowledge, pages 31–40.
Jivet, I., Wong, J., Scheffel, M., Valle Torre, M., Specht, M.,
and Drachsler, H. (2021). Quantum of choice: How
learners’ feedback monitoring decisions, goals and
self-regulated learning skills are related. In LAK21:
11th international learning analytics and knowledge
conference, pages 416–427.
Jonathan, C., Tan, J. P.-L., Koh, E., Caleon, I. S., and
Tay, S. H. (2017). Enhancing students’ critical
reading fluency, engagement and self-efficacy using
self-referenced learning analytics dashboard visual-
izations.
Jørnø, R. L. and Gynther, K. (2018). What constitutes an
‘actionable insight’in learning analytics? Journal of
Learning Analytics, 5(3):198–221.
Khosravi, H., Shabaninejad, S., Bakharia, A., Sadiq, S.,
Indulska, M., and Gasevic, D. (2021). Intelligent
learning analytics dashboards: Automated drill-down
recommendations to support teacher data exploration.
Journal of Learning Analytics, 8(3):133–154.
Kruglov, A., Strugar, D., and Succi, G. (2021). Tailored
performance dashboards—an evaluation of the state
of the art. 7:e625. Publisher: PeerJ Inc.
Matcha, W., Ga
ˇ
sevi
´
c, D., Pardo, A., et al. (2019). A sys-
tematic review of empirical studies on learning ana-
lytics dashboards: A self-regulated learning perspec-
tive. IEEE transactions on learning technologies,
13(2):226–245.
Mohseni, Z., Martins, R. M., and Masiello, I. (2022). Sbg-
tool v2. 0: An empirical study on a similarity-based
grouping tool for students’ learning outcomes. Data,
7(7):98.
Molenaar, I., Horvers, A., Dijkstra, R., and Baker, R. S.
(2020). Personalized visualizations to promote young
learners’ SRL: the learning path app. In Proceedings
of the Tenth International Conference on Learning An-
alytics & Knowledge, LAK ’20, pages 330–339, New
York, NY, USA. Association for Computing Machin-
ery.
Muslim, A., Chatti, M. A., Mughal, M., and Schroeder, U.
(2017). The goal - question - indicator approach for
personalized learning analytics:. In Proceedings of the
9th International Conference on Computer Supported
Education, pages 371–378. SCITEPRESS - Science
and Technology Publications.
Oppermann, R. (2017). Adaptive user support: ergonomic
design of manually and automatically adaptable soft-
ware. Routledge.
Oppermann, R. (2019). Adaptive User Support: Ergonomic
Design of Manually and Automatically Adaptable
Software. Routledge. Google-Books-ID: WtRBD-
wAAQBAJ.
Page, M. J., McKenzie, J. E., Bossuyt, P. M., Boutron, I.,
Hoffmann, T. C., Mulrow, C. D., Shamseer, L., Tet-
zlaff, J. M., Akl, E. A., Brennan, S. E., et al. (2021).
The prisma 2020 statement: an updated guideline for
reporting systematic reviews. International journal of
surgery, 88:105906.
Papamitsiou, Z. and Economides, A. A. (2014). Learn-
ing analytics and educational data mining in prac-
tice: A systematic literature review of empirical ev-
idence. Journal of Educational Technology & Society,
17(4):49–64.
Park, E., Ifenthaler, D., and Clariana, R. B. (2023).
Adaptive or adapted to: Sequence and reflexive the-
matic analysis to understand learners’ self-regulated
learning in an adaptive learning analytics dashboard.
British Journal of Educational Technology, 54(1):98–
125.
Podgorelec, V. and Kuhar, S. (2011). Taking advantage of
education data: Advanced data analysis and reporting
in virtual learning environments. Elektronika ir Elek-
trotechnika, 114(8):111–116.
S¸ahin, M. and Yurdug
¨
ul, H. (2019). An intervention engine
design and development based on learning analyt-
Adaptation in Learning Analytics Dashboards: A Systematic Review
85

ics: The intelligent intervention system (in2s). Smart
Learning Environments, 6(1):1–18.
Scheffel, M., Drachsler, H., Kreijns, K., de Kraker, J., and
Specht, M. (2017). Widget, widget as you lead, i am
performing well indeed! using results from an ex-
ploratory offline study to inform an empirical online
study about a learning analytics widget in a collabora-
tive learning environment. In Proceedings of the Sev-
enth International Learning Analytics & Knowledge
Conference, LAK ’17, page 289–298, New York, NY,
USA. Association for Computing Machinery.
Schwendimann, B. A., Rodriguez-Triana, M. J., Vozniuk,
A., Prieto, L. P., Boroujeni, M. S., Holzer, A., Gillet,
D., and Dillenbourg, P. (2016). Perceiving learning
at a glance: A systematic literature review of learning
dashboard research. IEEE Transactions on Learning
Technologies, 10(1):30–41.
Siemens, G. (2011). 1st international conference on learn-
ing analytics and knowledge 2011. Technology En-
hanced Knowledge Research Institute (TEKRI).
Sirje Virkus, Sigrid Mandre, E. U. (2023). Guide-
book on learning analytics and dashboards.
https://teach4edu4-project.eu/sites/default/files/
2023-05/IO4%20Guidebook%20on%20Learning%
20Analytics%20and%20Dashboards.pdf, Accessed:
1-2-2024.
Smith, P. (2020). Engaging online students through peer-
comparison progress dashboards. Journal of Applied
Research in Higher Education, 12(1):38–56.
Steiner, M., C., Kickmeier-Rust, M. D., and Albert, D.
(2014). Learning analytics and educational data min-
ing: An overview of recent techniques. learning ana-
lytics for and in serious games.
Susnjak, T., Ramaswami, G. S., and Mathrani, A. (2022).
Learning analytics dashboard: a tool for providing
actionable insights to learners. International Jour-
nal of Educational Technology in Higher Education,
19(1):12.
T. Rohloff, D. Sauer, and C. Meinel (2019). Student Percep-
tion of a Learner Dashboard in MOOCs to Encourage
Self-Regulated Learning. In 2019 IEEE International
Conference on Engineering, Technology and Educa-
tion (TALE).
Taibi., D., Bianchi., F., Kemkes., P., and Marenzi., I. (2018).
Learning analytics for interpreting. In Proceedings of
the 10th International Conference on Computer Sup-
ported Education - Volume 2: CSEDU, pages 145–
154. INSTICC, SciTePress.
Torre, M. V., Tan, E., and Hauff, C. (2020). edX log
data analysis made easy: introducing ELAT: An open-
source, privacy-aware and browser-based edX log data
analysis tool. In Proceedings of the Tenth Interna-
tional Conference on Learning Analytics & Knowl-
edge, LAK ’20, pages 502–511, New York, NY, USA.
Association for Computing Machinery.
van der Stappen, E. (2018). Workplace learning an-
alytics in higher engineering education. In 2018
IEEE Global Engineering Education Conference
(EDUCON), pages 15–20. IEEE.
Verbert, K., Ochoa, X., De Croon, R., Dourado, R. A., and
De Laet, T. (2020). Learning analytics dashboards:
the past, the present and the future. In Proceedings of
the tenth international conference on learning analyt-
ics & knowledge, pages 35–40.
V
´
azquez-Ingelmo, A., Garcia-Pe
˜
nalvo, F. J., and Ther
´
on,
R. (2019). Information dashboards and tailoring ca-
pabilities - a systematic literature review. 7:109673–
109688. Conference Name: IEEE Access.
V
´
azquez-Ingelmo, A., Garc
´
ıa-Pe
˜
nalvo, F. J., Ther
´
on, R.,
Amo Filv
`
a, D., and Fonseca Escudero, D. (2020).
Connecting domain-specific features to source code:
towards the automatization of dashboard generation.
23(3):1803–1816.
Yoo, Y., Lee, H., Jo, I.-H., and Park, Y. (2015). Educational
dashboards for smart learning: Review of case stud-
ies. In Chen, G., Kumar, V., Kinshuk, Huang, R., and
Kong, S. C., editors, Emerging Issues in Smart Learn-
ing, Lecture Notes in Educational Technology, pages
145–155. Springer.
Zamecnik, A., Kovanovi
´
c, V., Grossmann, G., Joksimovi
´
c,
S., Jolliffe, G., Gibson, D., and Pardo, A. (2022).
Team interactions with learning analytics dashboards.
Computers & Education, 185:104514.
CSEDU 2024 - 16th International Conference on Computer Supported Education
86
