
Advancing Educational Analytics Using Machine Learning in Romanian
Middle School Data
Ioan Daniel Pop
a
and Adriana Mihaela Coroiu
b
“Babes-Bolyai” University, Department of Computer Science, 400084, Cluj-Napoca, Romania
Keywords:
Educational Data Mining, Extreme Gradient Boosting, Support Vector Machine, Performance Prediction,
Classification.
Abstract:
This paper aims to present the results achieved after a series of experiments regarding the prediction of the
academic performance of Romanian middle school students. A unique data set that was first collected by the
authors from 24 pre-university educational units in Romania was used for this study. The dataset contains
both rural and urban students, respectively both students with high academic performance and students with
low performance. In the experiments, two machine learning methods were used: extreme gradient boosting
and support vector machine, along with feature engineering techniques. The obtained results are satisfactory,
resulting in an accuracy of 94.18%.
1 INTRODUCTION
The educational field plays an important role in the
development of society, the foundations of all systems
are built on a functional educational system. Edu-
cational Data Mining (EDM) is a research area that
combines data mining with machine learning to ob-
tain information from different data sets. EDM can be
used to detect problems at an early level. This paper
aims to present the creation of models for predicting
the academic performance of students in secondary
schools in Romania, using machine learning methods.
The Romanian educational system presents an in-
triguing case study for analyzing the predictive power
of machine learning techniques in predicting stu-
dents’ academic achievement, given its unique po-
tential and challenges. As the country strives to
improve the quality of education and allocate re-
sources as efficiently as possible, stakeholders, politi-
cians, and educators can all benefit from accurate pro-
jections of children’s academic performance. This
will make targeted interventions and evidence-based
decision-making possible. This study uses extensive
datasets covering a variety of student profiles, aca-
demic records, and environmental factors in an at-
tempt to identify patterns and correlations that might
be utilized as predictors of academic achievement.
a
https://orcid.org/0000-0002-3740-6579
b
https://orcid.org/0000-0001-5275-3432
Considering the importance of the educational
system and the large-scale advantages that come with
the improvement of this system, it was expected that
the research environment would try to build models
that would help improve this system, exactly what is
being tried in this paper.
In this work, two models will be created for pre-
dicting the academic performance of students from
secondary schools in Romania. Machine learning
models combined with feature engineering techniques
will be used to create powerful tools to accomplish the
proposed goal of the paper.
The structure of the paper follows the standard
outline: first, we have the review of the existing pa-
pers in the scientific literature on the topic; second
we have the theoretical background in which we sum-
mary present the used methods and the computed
metrics; next we continue with the presentation of our
particular approach based on the new proposed work-
ing pipeline, then we present the computational ex-
periments results and finally, we end the paper high-
lighting the results and propose future work steps.
2 THE LITERATURE REVIEW
EDM has four main (Bachhal et al., 2021) objectives:
Predicting future learning patterns for students, In-
vention / improvement of domain models, Advanc-
230
Pop, I. and Coroiu, A.
Advancing Educational Analytics Using Machine Learning in Romanian Middle School Data.
DOI: 10.5220/0012628800003693
Paper published under CC license (CC BY-NC-ND 4.0)
In Proceedings of the 16th International Conference on Computer Supported Education (CSEDU 2024) - Volume 2, pages 230-237
ISBN: 978-989-758-697-2; ISSN: 2184-5026
Proceedings Copyright © 2024 by SCITEPRESS – Science and Technology Publications, Lda.

ing scientific knowledge of students and instructors
and Studying the impact of learning support. When
it comes to applications created using EDM, most
of them aim to predict academic performance. Of
course, along with the creation of prediction systems,
recommendation systems can also be created to be
used by instructors/teachers to help the learner dis-
cover the best ways to learn, or why not, to identify
where there are gaps in the academic process (Bach-
hal et al., 2021).
Jalota et. al (Jalota and Agrawal, 2019) have cre-
ated 5 models for predicting the level of academic per-
formance: J48 algorithm, Support Vector Machine,
Naive Bayes, Random Forest and Multilayer Percep-
tron. The data set used in the paper Kalboard 360
containing 480 students was used for the experiments.
Each recording has 16 features grouped into 3 cat-
egories: demographic features (gender, nationality),
educational features (educational stage, section, grade
level) and psychological features (school satisfaction,
raised hand on class, answering survey by parents).
to compare the results obtained with each model, the
chosen performance matrix was accuracy. The best
result presented in (Jalota and Agrawal, 2019) was an
accuracy of 76.07%.
A useful work when it comes to the current state of
specialty literature is (Batool et al., 2023).A system-
atic review of works that address subjects from the
subjects within EDM, such as the prediction of aca-
demic performance using regression, classification,
association rule or clustering techniques. From this
review we can see that the most used algorithms for
solving the problems mentioned above in the last five
years were: Artificial neural network, random for-
est, support vector machine and decision trees (Batool
et al., 2023).
A paper that tests how well some machine learn-
ing models can predict academic performance is by
(Pallathadka et al., 2023). In the work, four classifi-
cation methods were tested: Naive Bayes, ID3, C4.5
and Support Vector Machine, on a data set with 33
attributes and 649 of recordings. For testing and vali-
dating the models, the performance metric taken into
account was accuracy. The best model for the data set
used was SVM with an accuracy of 87%.
Extreme gradient boosting is an increasingly pop-
ular method used for both classification and regres-
sion. The authors of the work (Asselman et al., 2023)
showed that this method is much more efficient when
it comes to predicting academic performances than
other more established methods.
A recent paper presents the performance of three
automatic learning techniques applied in the predic-
tion of academic performance. (Karale et al., 2022)
uses Random Forest, Artificial Neural Network and
XGBoost, obtaining a spot accuracy of 80% for the
best model.
Another reference work (Ya
˘
gcı, 2022), ap-
proaches the subject of EDM in an engaging manner.
The authors proposed a new model based on machine
learning algorithms to predict the final grade of some
students, taking into account the grades obtained by
them in the midterm.
(Nabil et al., 2021) have experienced how well
several machine learning and deep learning tech-
niques can predict students’ academic performance,
such as: Deep Neural Network, Random Forest, Gra-
dient Boosting, Logistic Regression, Support Vector
Classifier and K-nearest Neighbor. The best accuracy
presented in the paper is 91%, while the worst accu-
racy is 87%. All experiments were performed on a
data set collected by the authors. The data set con-
tains 4266 anonymous instances with 12 features re-
garding the achievements of students in the first two
years of college. All features are graded and obtained
by students.
The subject addressed in this paper is part of large
experiments that we are working on, therefore an-
other paper based on the same subject of predicting
the academic performance of Romanian students was
accepted for publication at the ICAART 2024 confer-
ence. In the card of the previous work, good results
were achieved in comparison with the specialized lit-
erature. Regression and classification models were
created using ANN and Random Forest algorithms.
The best result, from the perspective of accuracy, was
91.18% (Pop, 2024).
In a future subsection, a comparison will be made
between the results presented in the aforementioned
works, respectively the results obtained in this paper.
3 THEORETICAL BACKGROUND
3.1 Machine Learning Methods
Supervised learning in artificial intelligence attempts
to provide an accurate output for a novel input by us-
ing a collection of previously examined input-output
pairs. Regression and classification are the two issue
categories that supervised learning can be used to deal
with. From a mathematical perspective, both prob-
lems involve figuring out an unknown relationship
between a system’s inputs and outputs (Jiang et al.,
2020). The process of determining a relationship be-
tween dependent and independent variables is called
regression (Jiang et al., 2020). The algorithm’s goal
is to forecast an outcome for current input data. The
Advancing Educational Analytics Using Machine Learning in Romanian Middle School Data
231

outcome is continuous and can be expressed as a real
number (Jiang et al., 2020). Since the classification
process involves labeling new input, the output is dis-
crete and belongs to a predetermined set.
Numerous methods have been established for each
of the aforementioned challenges; however, some are
unique to the problem, while others may be applied to
both problems with just minor adjustments. Extreme
Gradient Boosting and artificial neural networks are
outstanding instances of this.
Several supervised learning models have been
suggested in the paper. The design that was utilized
for the classification model and the regression model
for every single model will be detailed.
XGBoost, which stands for ”Extreme Gradient
Boosting,” is a strong machine learning algorithm
noted for its outstanding performance in a variety of
applications, notably supervised learning. XGBoost
is an ensemble approach for creating a strong pre-
dictive model by combining the predictions of nu-
merous weak predictive models, often decision trees
(Bent
´
ejac et al., 2021). To improve its performance,
XGBoost employs a number of significant strate-
gies. Regularization to prevent over-fitting, manag-
ing missing values, and parallel processing capabili-
ties make it very efficient and scalable (Bent
´
ejac et al.,
2021).
An efficient machine learning technique, support
vector machines (SVM) are renowned for their excep-
tional performance across a wide range of applica-
tions, most notably supervised learning (Pisner and
Schnyer, 2020). SVM are flexible and useful for
applications involving both classification and regres-
sion. By finding the ideal hyperplane to divide classes
or forecast continuous outcomes, SVM are used to
build strong predictive models. How the SVM is set
up and the kind of problem it is used on determine the
nature of its application (Pisner and Schnyer, 2020).
Similar to XGBoost, SVM uses techniques to im-
prove performance. These include using kernel func-
tions for complex relationships, handling support vec-
tors effectively, and regularizing data to avoid overfit-
ting. SVM is well-known for being scalable and ef-
fective in a variety of machine learning applications
(Pisner and Schnyer, 2020).
3.2 Performance Evaluation
Grid search, a well-liked hyperparameter optimiza-
tion technique in machine learning, including AI
models, was applied to determine the optimal param-
eter values. It involves meticulously looking over a
preset list of hyperparameters to find the configura-
tion that provides the best results for a specific model.
Hyperparameters regulate the model’s performance as
well as its behaviour. After this method was used, all
of the parameters listed below were determined.
Considering that both classification models and
regression models are discussed, methods specific to
each type of approach were used for performance
evaluation: methods such as Mean Squared Error,
Root Mean Squared Error, Mean Absolute Error, Ex-
plained Variance Score and R-Squared for regression
and techniques such as Accuracy, Precision, Recall
and F1 Score for classification.
The following abbreviations will be used in the pa-
per: Accuracy - acc, Precision - pre, Recall - rc, F1
Score - f1, Root Mean Squared Error - RMSE, Mean
Absolute Error - MAE, Explained Variance Score -
EVS and R Squared - R2.
4 OUR APPROACH FOR
PREDICTING THE ACADEMIC
PERFORMANCE OF MIDDLE
SCHOOL STUDENTS
4.1 Data Collection
The authors gathered the original data set from 24
rural and urban educational institutions in Romania.
There are 26.143 instances in the data collection, and
each record has 69 features. Three categories can be
used to group the 69 features: environmental and so-
cial factors, grades in particular academic areas and
characteristics of high school admission.
The 69 features are as follows: the educational
environment, the gender of the child, grades for all
subjects studied during middle school in the Roma-
nian public system, grade in the Romanian language
and literature exam and also grade in the mathematics
exam. The last three features are related to the high
school admission: high school profile, brunch and en-
vironment.
There are text and numeric components in the data
set. Exam grades are represented by positive real val-
ues from [1, 10], whereas all other grades during the
years of study are represented by integer values from
the range [1, 10].
The distribution of females and males in the data
set is balanced. Therefore, 46.45% of the data set is
made up of males. There is no longer the same degree
of balance between the urban and rural populations,
although the differences are still quite small: 36,89%
of the data set’s participants are from rural areas, and
63.11% are from urban areas.
CSEDU 2024 - 16th International Conference on Computer Supported Education
232
4.2 Proposed Architectures
The Romanian system for classifying grades accord-
ing to their value was used to divide the data set
into different classes in order to make a classification
based on the form of data. In the context of classi-
fication, the data set is slightly modified as follows:
the output variable, initially a grade from the interval
[1, 10], is transformed into a class from the set in-
sufficient, sufficient, good and very good. The grades
were categorized as follows: insufficient are in the in-
terval [1.0,4.5], sufficient grades are in the interval
(4.5, 6.5], good class grades are in the interval (6.5,
8.5] and very good class grade are in the interval (8.5,
10.0]. Every single classification model that was de-
veloped used this division of classes.
4.2.1 Support Vector Machine
As previously mentioned, both regression and classi-
fication models with distinctive architectures were de-
veloped in this paper. For both exam subjects, each of
the models predicts grades with success. To predict
grades for the two study subjects, two SVMs were
created, the only difference between the two models
being the target variable. Table 1 shows the values
of the parameters for which the best results were ob-
tained for the regression model.
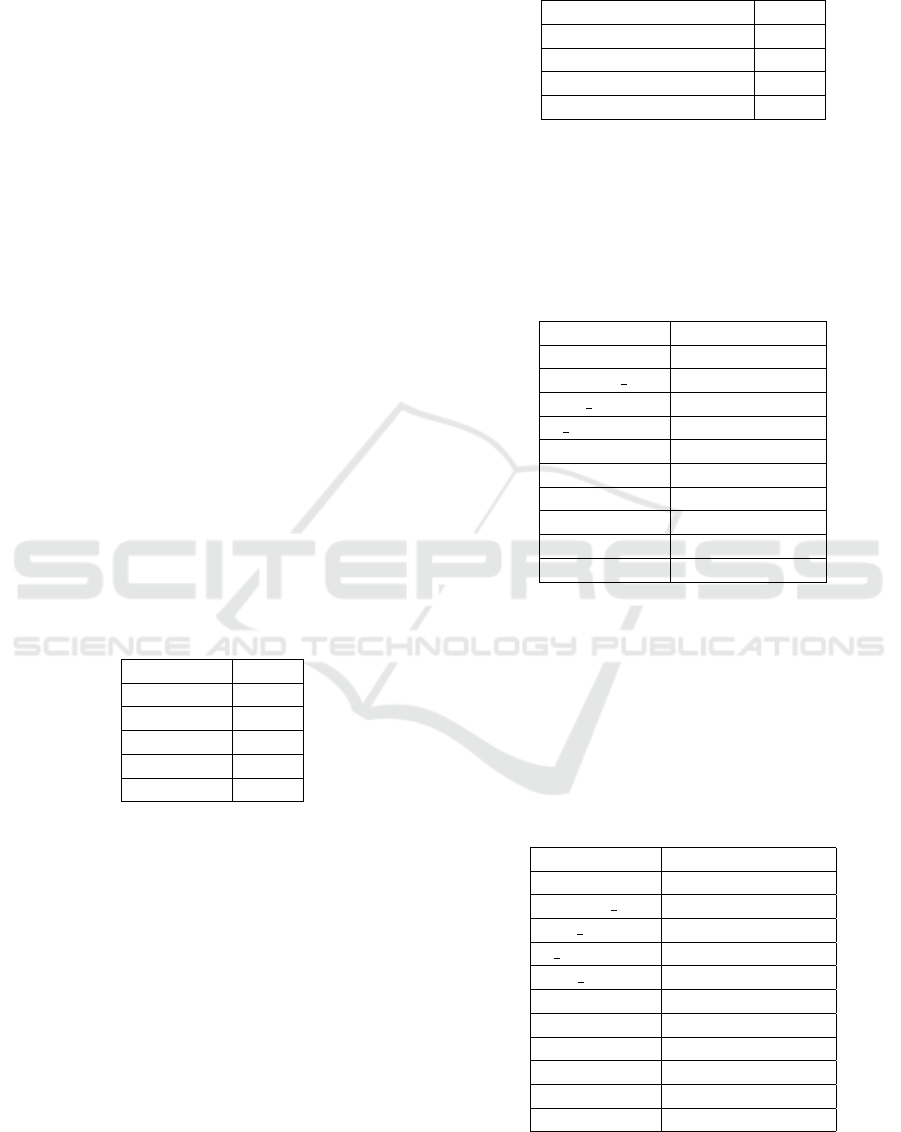
Table 1: The set of values for the parameters of the SVM
Regression Model.
Parameter Value
kernel poly
C 1
epsilon 0.15
degree 3
gamma 0.1
SVMs were originally designed for binary clas-
sification, but there are strategies to extend them for
multi-class classification. There a two main strate-
gies for extending SVMs to handle multi-class classi-
fication: One vs One (OvO) and One vs. Rest (OvR)
(Jiang et al., 2020). Just like it was done for regres-
sion and classification, we created two models, one
for each exam topic.
The best results for classification were obtained
with the OvR strategy, and parameters from the model
are presented in the Table 2.
4.2.2 Extreme Gradient Boosting
Two architectures were developed for xgboost in this
work, similar to the model that was previously high-
lighted. The regression architecture will be discussed
Table 2: The set of values for the parameters of the SVM
Classification Model.
Parameter Value
kernel rbf
C 1
gamma 0.1
decision function shape ovr
first in the following, before proceeding to the classi-
fication architecture. For the regression problem, only
one model was used, and for classification, two mod-
els were used (for classification, the only difference
between the two models is the target variable).
Table 3: The set of values for the parameters of the XG-
Boost Regression Model.
Parameter Value
booster gblinear
learning rate 0.1
max depth 6
n estimators 150
subsample 1
objective reg:squarederror
seed 123
alpha 0
lambda 1
gamma 0
Table 1 illustrates the parameter values for which
we were able to get the most desirable regression
model results 3.
The parameters for regression model and the clas-
sification model are not the same, so below in the Ta-
ble 4 you can see the values of the parameters for
which we obtained the best performance for classi-
fication model.
Table 4: The set of values for the parameters of the XG-
Boost Classification Model.
Parameter Value
booster gbtree
learning rate 0.1
max depth 3
n estimators 150
num class 3
subsample 0.8
objective reg: multi-softmax
seed 123
alpha 0
lambda 1
gamma 0.1
Advancing Educational Analytics Using Machine Learning in Romanian Middle School Data
233
5 EXPERIMENTAL RESULTS
5.1 Data Analysis
Machine learning techniques require the creation of
data analysis. It involves several steps that aid in data
analysis, prepare it for modeling, and gather informa-
tion to build strong machine learning models. The
first step in the data analysis section was to gather
the data and compile it into a distinct data set. This
involved multiple steps that were followed from the
start. The data set utilized in this paper is unique, as
it was previously stated.
In the data analysis section, several feature selec-
tion and feature extraction techniques were used. In
feature selection, a subset of the original features from
the data set is chosen, and any redundant or irrelevant
features are removed. Feature extraction uses meth-
ods like Principal Component Analysis (PCA), linear
discriminant analysis and autoencoders to convert the
original features into a new set of features, usually for
dimensionality reduction.
The following methods were used for the fea-
ture selection part Thresholding Numerical Feature
Variance and Handling Highly Correlated Features.
While for feature extraction the methods used were
Reducing Features Using Principal Components, Re-
ducing Features by Maximizing Class Separability
and Reducing Features Using Matrix Factorization
(Albon, 2018).
In parallel with the use of feature engineering
techniques, the level of correlation between the input
and output data was checked separately. In the ta-
ble 5 you can see the correlation index between each
study subject and the grades from the final exams.
Spearman’s rank correlation coefficient was used to
establish the correlation index. The non-parametric
Spearman’s rank correlation coefficient, or ρ (rho),
indicates the direction and strength of a monotonic
relationship between two variables. It evaluates how
well a monotonic function can capture the relation-
ship between two variables. The value of ρ is found
in the range [-1, 1], where -1 means perfectly de-
creasing monotonic relationship, 0 represents there is
no monotonic relationship, and 1 means perfectly in-
creasing monotonic relationship. This type of corre-
lation check was chosen because, unlike Pearson, it
is much more robust to outlier values and does not
assume a specific distribution for the variables.
In the table below, R stands for Romanian Lan-
guage and Literature, and M for Mathematics.
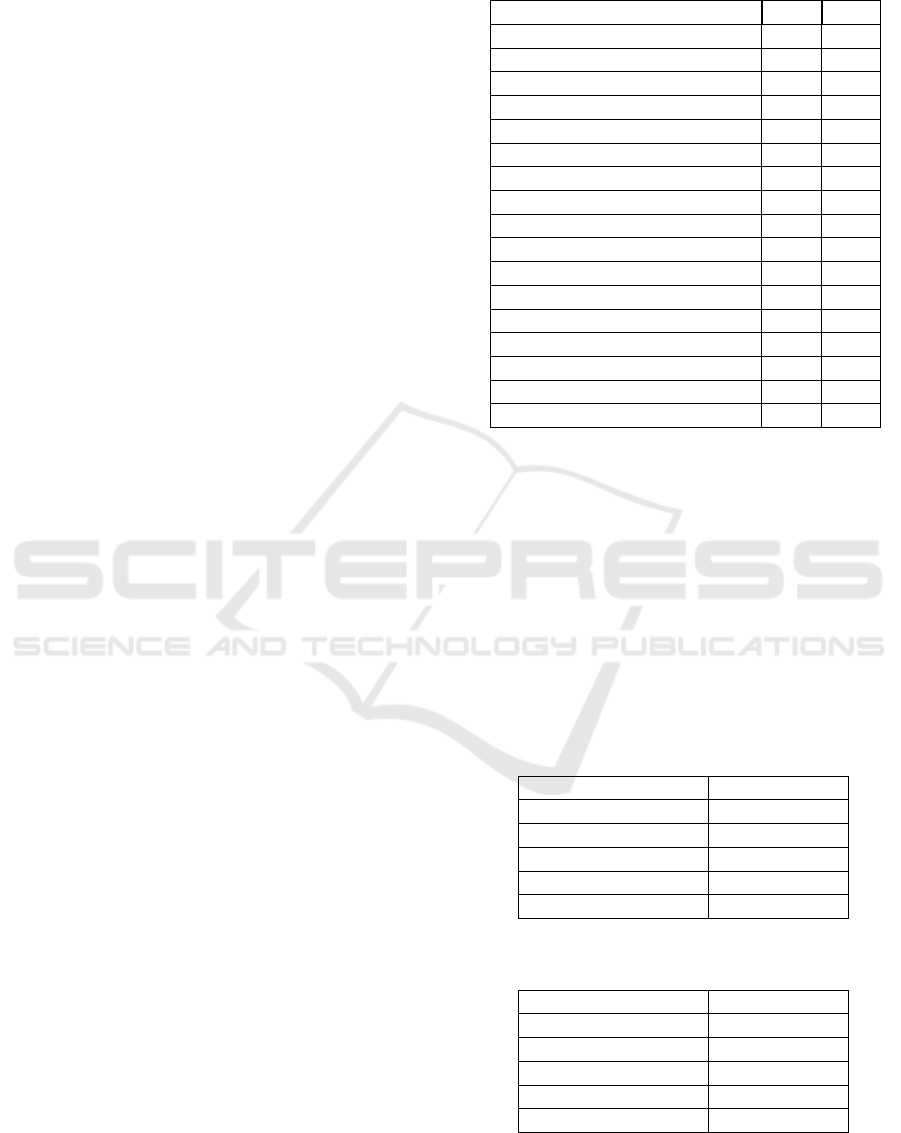
Table 5: Spearman’s rank correlation coefficient values be-
tween the features and the target output.
Course R M
Romanian Language 0.97 0.88
First Modern Language 0.91 0.85
Second Modern Language 0.90 0.86
Latin Language 0.84 0.81
Mathematics 0.87 0.95
Physics 0.87 0.90
Chemistry 0.84 0.89
Biology 0.87 0.87
Social Education 0.89 0.87
History 0.88 0.84
Geography 0.90 0.85
Music 0.40 0.39
Arts 0.39 0.41
Sports and Physical Education 0.40 0.40
Technological Sciences 0.86 0.91
Communication Technology 0.87 0.89
Academic Conduct 0.68 0.66
5.2 Results and Discussion
The part that followed after the data analysis and the
creation of the models consists in the validation and
evaluation of the performances.
In Table 6 we can see the performances obtained
with the SVM technique for the regression model.
The XGBoost model’s results are shown in Table
7. When comparing the regression models among all
of the results, the XGBoost architecture produced the
best results.
Table 6: Performance of the SVM Model for Regression.
95% CIs are used for the mean performance.
Performance Metric Value
MSE 0.199 ± 0.021
RMSE 0.457 ± 0.028
MAE 0.268 ± 0.022
R2 0.902 ± 0.023
EVS 0.917 ± 0.023
Table 7: Performance of the XGBoost Model for Regres-
sion. 95% CIs are used for the mean performance.
Performance Metric Value
MSE 0.194 ± 0.023
RMSE 0.440 ± 0.025
MAE 0.253 ± 0.026
R2 0.914 ± 0.021
EVS 0.922 ± 0.022
Unlike the approach to the regression problem,
to solve the classification problem we decided to de-
CSEDU 2024 - 16th International Conference on Computer Supported Education
234
velop a separate model for each exam grade, so we
developed two SVM architectures and two XGBoost
architectures, below we can see the tables showing
the performances of each model from the perspective
of the performance metrics presented in the previous
chapter.
In Table 8 are presented the results obtained for
the classification models where we used SVM archi-
tectures, while in Table 9 we can see the results for
XGboost.
The better results were obtained with xgboost,
which is not necessarily surprising considering the
fact that this type of method is generally more robust.
Overall, the performance differences are easily
noticeable, when it comes to the values of the four
performance metrics checked, all three types of ap-
proaches provided satisfactory results.
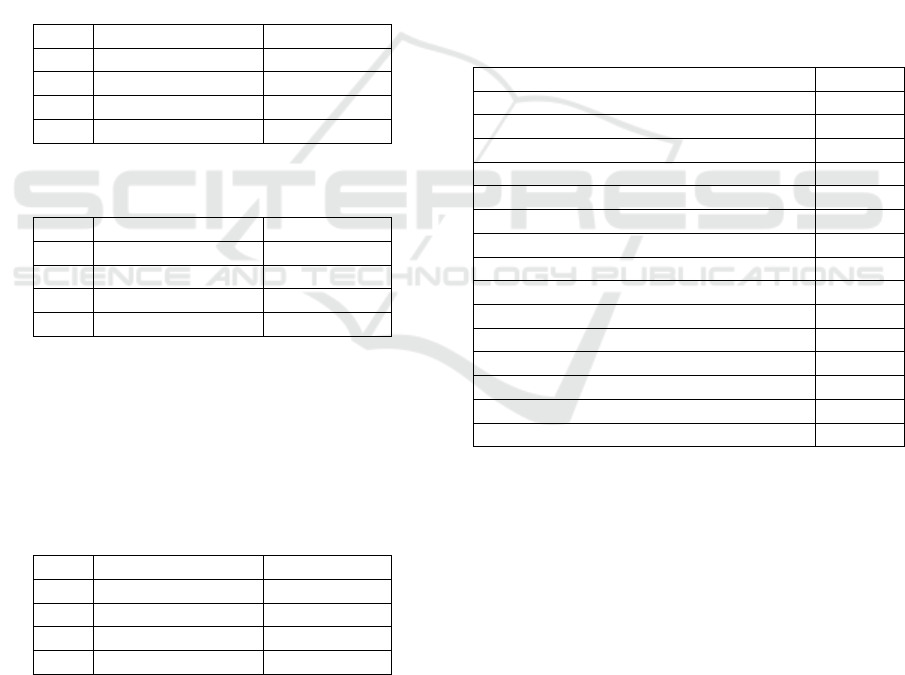
Table 8: Performance of the SVM Model for Classification.
MetricRomanian ClassifierMath Classifier
Acc 0.9017 ± 0.001 0.9001 ± 0.001
Pre 0.9217 ± 0.002 0.9141 ± 0.001
Rc 0.9121 ± 0.002 0.9077 ± 0.002
F1 0.9168 ± 0.001 0.9108 ± 0.001
Table 9: Performance of the XGBoost Model for Classifi-
cation.
MetricRomanian ClassifierMath Classifier
Acc 0.9171 ± 0.002 0.9029 ± 0.002
Pre 0.9301 ± 0.002 0.9175 ± 0.002
Rc 0.9149 ± 0.001 0.9028 ± 0.002
F1 0.9193 ± 0.001 0.9059 ± 0.001
As mentioned in the previous sections, feature en-
gineering techniques were applied to obtain results.
The best results obtained using these techniques were
for the classification problem using XGBoost. The
best results from this study are presented in the Table
10.
Table 10: Performance of the best XGBoost Model for
Classification.
MetricRomanian ClassifierMath Classifier
Acc 0.9418 ± 0.001 0.9234 ± 0.001
Pre 0.9587 ± 0.001 0.9398 ± 0.001
Rc 0.9634 ± 0.002 0.9288 ± 0.002
F1 0.9610 ± 0.001 0.9342 ± 0.001
5.3 Comparison with Related Work
As previously indicated, the achieved results are suf-
ficiently good and to illustrate this, a comparison of
our results with related work will be provided in this
subsection.
Given that the majority of the papers and research
in the relevant works concentrate on the method of
classification, the comparisons were made using the
output of the classification models. The best re-
sults shown in related work and the best results we
achieved with the classification model are included in
Table 11.
The performances given in the related work are
presented in Table 11, with the data arranged in ac-
cordance with the accuracy value.
Since this was the only performance measure that
showed up in every study, we decided to use this met-
ric exclusively in the paper. The results of this study
were compared with the results obtained by the au-
thors in another study of the authors (Icaart, 2024).
Therefore, the table 11 illustrates how well our re-
sults compare to the literature.
Table 11: The accuracy of our models and the models from
the studies presented in related work.
Machine Learning Approach Acc
Our XGBoost model 94.18%
Random Forest (Rai et al., 2021) 94.00%
Our ANN model (Pop, 2024) 91.18%
DNN (Nabil et al., 2021) 91.00%
Our SVM model 90.17%
Random Forest (Chen and Zhai, 2023) 89.08%
BKP (Sekeroglu et al., 2019) 87.78%
SVM (Pallathadka et al., 2023) 87.00%
XGB (Nuankaew and Nuankaew, 2022) 80.70%
Random Forest (Karale et al., 2022) 80.29%
ANN (Mengash, 2020) 79.22%
MP (Jalota and Agrawal, 2019) 76.07%
AutoML (Zeineddine et al., 2021) 75.90%
Random Forest (Ya
˘
gcı, 2022) 74.60%
Naive Bayes (Sudais et al., 2022) 63.70%
In the table above, we used the following abbrevi-
ations: BKP for Backpropagation, and XGB for XG-
Boost.
6 CONCLUSIONS
This study concluded with some notable findings af-
ter a series of experiments were conducted to predict
Romanian middle school students’ academic perfor-
mance:
• Dataset collection and creation: The authors col-
lected a unique dataset from 24 pre-university
schools in Romania, which included a varied mix
of students from both urban and rural areas, as
Advancing Educational Analytics Using Machine Learning in Romanian Middle School Data
235

well as those with both high and low academic
performance levels.
• Adequate predictive accuracy based on new pro-
posed pipeline formed from standard Machine
Learning methods: Using complex feature en-
gineering techniques in conjunction with current
machine learning methodologies like support vec-
tor machines and extreme gradient boosting pro-
duced encouraging results in predicting academic
performance. As a result of these efforts, a re-
markable accuracy rate of 94.18% was obtained,
demonstrating the strength and effectiveness of
the predictive models created with the dataset pro-
vided.
• Available implications for educational practices:
This study’s results have a significant impact on
education in our country because they raise the
possibility of using machine learning algorithms
to predict middle school students’ academic suc-
cess. This could lead to more focused interven-
tions and individualized learning plans, especially
if we initiate collaborations between our schools
but also other country schools.
In summary, the study’s findings highlight the poten-
tial of machine learning methods for predicting mid-
dle school students’ academic performance in Roma-
nia. This provides a strong basis for further research
projects and the advancement of educational analytics
in comparable settings.
Despite reaching a remarkable accuracy rate, there
are still opportunities for investigation, such as im-
proving predictive models, taking into account other
variables, and applying this strategy to various educa-
tional contexts.
Specifically, as future work directions, we can
mention investigating the inclusion of more compre-
hensive and nuanced features within the dataset, such
as socio-economic factors, student engagement met-
rics, or behavioral patterns, to create more robust pre-
dictive models and examine whether the developed
models can be applied to other educational systems
or nations, modifying the approaches to fit different
student populations and educational structures. More-
over, work together with researchers or international
partners to carry out comparative studies that assess
the efficacy of predictive models based on machine
learning in various educational contexts.
REFERENCES
Albon, C. (2018). Machine learning with python cookbook:
Practical solutions from preprocessing to deep learn-
ing. ” O’Reilly Media, Inc.”.
Asselman, A., Khaldi, M., and Aammou, S. (2023). En-
hancing the prediction of student performance based
on the machine learning xgboost algorithm. Interac-
tive Learning Environments, 31(6):3360–3379.
Bachhal, P., Ahuja, S., and Gargrish, S. (2021). Educa-
tional data mining: A review. In Journal of Physics:
Conference Series, volume 1950, page 012022. IOP
Publishing.
Batool, S., Rashid, J., Nisar, M. W., Kim, J., Kwon, H.-
Y., and Hussain, A. (2023). Educational data min-
ing to predict students’ academic performance: A sur-
vey study. Education and Information Technologies,
28(1):905–971.
Bent
´
ejac, C., Cs
¨
org
˝
o, A., and Mart
´
ınez-Mu
˜
noz, G. (2021).
A comparative analysis of gradient boosting algo-
rithms. Artificial Intelligence Review, 54:1937–1967.
Chen, Y. and Zhai, L. (2023). A comparative study on stu-
dent performance prediction using machine learning.
Education and Information Technologies, pages 1–19.
Icaart (2024). https://icaart.scitevents.org/, b conference ac-
cording to cs core.
Jalota, C. and Agrawal, R. (2019). Analysis of educational
data mining using classification. In 2019 Interna-
tional Conference on Machine Learning, Big Data,
Cloud and Parallel Computing (COMITCon), pages
243–247. IEEE.
Jiang, T., Gradus, J. L., and Rosellini, A. J. (2020). Su-
pervised machine learning: a brief primer. Behavior
Therapy, 51(5):675–687.
Karale, A., Narlawar, A., Bhujba, B., and Bharit, S. (2022).
Student performance prediction using ai and ml. Inter-
national Journal for Research in Applies Science and
Engineering Technology, 10(6):1644–1650.
Mengash, H. A. (2020). Using data mining techniques to
predict student performance to support decision mak-
ing in university admission systems. Ieee Access,
8:55462–55470.
Nabil, A., Seyam, M., and Abou-Elfetouh, A. (2021). Pre-
diction of students’ academic performance based on
courses’ grades using deep neural networks. IEEE Ac-
cess, 9:140731–140746.
Nuankaew, P. and Nuankaew, W. S. (2022). Student per-
formance prediction model for predicting academic
achievement of high school students. European Jour-
nal of Educational Research, 11(2):949–963.
Pallathadka, H., Wenda, A., Ramirez-As
´
ıs, E., As
´
ıs-L
´
opez,
M., Flores-Albornoz, J., and Phasinam, K. (2023).
Classification and prediction of student performance
data using various machine learning algorithms. Ma-
terials today: proceedings, 80:3782–3785.
Pisner, D. A. and Schnyer, D. M. (2020). Support vector
machine. In Machine learning, pages 101–121. Else-
vier.
Pop, I.-D. (2024). Prediction in Pre-University education
system using machine learning methods. Proceedings
of the 16th International Conference on Agents and
Artificial Intelligence, 3:430–437.
Rai, S., Shastry, K. A., Pratap, S., Kishore, S., Mishra, P.,
and Sanjay, H. (2021). Machine learning approach for
CSEDU 2024 - 16th International Conference on Computer Supported Education
236

student academic performance prediction. In Evolu-
tion in Computational Intelligence: Frontiers in Intel-
ligent Computing: Theory and Applications (FICTA
2020), Volume 1, pages 611–618. Springer.
Sekeroglu, B., Dimililer, K., and Tuncal, K. (2019). Student
performance prediction and classification using ma-
chine learning algorithms. In Proceedings of the 2019
8th International Conference on Educational and In-
formation Technology, pages 7–11.
Sudais, M., Safwan, M., Khalid, M. A., and Ahmed, S.
(2022). Students’ academic performance prediction
model using machine learning.
Ya
˘
gcı, M. (2022). Educational data mining: prediction
of students’ academic performance using machine
learning algorithms. Smart Learning Environments,
9(1):11.
Zeineddine, H., Braendle, U., and Farah, A. (2021). En-
hancing prediction of student success: Automated ma-
chine learning approach. Computers & Electrical En-
gineering, 89:106903.
Advancing Educational Analytics Using Machine Learning in Romanian Middle School Data
237
