Regime Analysis with Numerical Modelling of Wave Dynamics and
Determination of Potential Flood Zones in Chancay Bay, Peru
Jose Soto
a
, Emanuel Guzman
b
and Carmela Ramos
c
Facultad y Escuela de Ingeniería Civil, Universidad Peruana de Ciencias Aplicadas, Av. Prolongación Primavera 2390,
Santiago de Surco, Lima, Peru
Keywords: Chancay Bay, Wave Dynamics, Dihidronav, Delft3d Wave, Wave Modeling.
Abstract: The wave dynamics in Chancay Bay is represented by the Delft3D numerical model, whose application is
referred to the propagation and calibration of the waves in the WAVE module through the Copernicus ERA5
database and comparison with field measurements of the hologram of the Directorate of Hydrography and
Navigation. (DIHIDRONAV) for medium and maximum regime conditions, in order to determine the Run
Up of waves in areas of human development with the Van Der Meer and Stem methodology. In this sense,
the topography of the ALOS PALSAR sentinel was extracted to determine the flood zones within the coast,
whose representation is given by the length and height of the wave reached.
1 INTRODUCTION
The study of wave dynamics in coastal areas is carried
out through numerical models whose interest is
multipurpose decision-making management. This is
why characterizing the waves in coastal areas is a
mandatory task, but one that is frequently limited due
to its complexity of execution and lack of information
from field and/or satellite measurements.
This is reflected in many investigations that,
through statistical adjustments, calibrate the numerical
models until a reliable approximation is obtained
through data collection and is compared with in situ
measurements to be adjusted using correction models
(Wang et al., 2022). On the other hand, within coastal
studies, understanding the interactions of waves, tides
and currents in coastal regions has become a fundamen-
tal aspect to develop best practices in numerical
modeling methodology (Pinault et al., 2020) (Prakash
et al., 2021). Likewise, there are different quasi-3D
models, of which Delft3D, Mike21, TELEMAC and
SWAN stand out. These 4 models are commonly used
by researchers to perform analysis of wave behavior. Of
those mentioned, Delft3D presents good results, since
this software allows the coupling of modules that allow
establishing an expansion in the analysis and reducing
or optimizing modeling time (Villagrán et al., 2022).
a
https://orcid.org/0009-0002-6315-0228
b
https://orcid.org/0000-0001-8381-4509
c
https://orcid.org/0000-0002-4269-2944
Therefore, it is feasible to establish a before and after
that allows generating warnings or effective solutions
to coastal hazards (Leach et al., 2021).
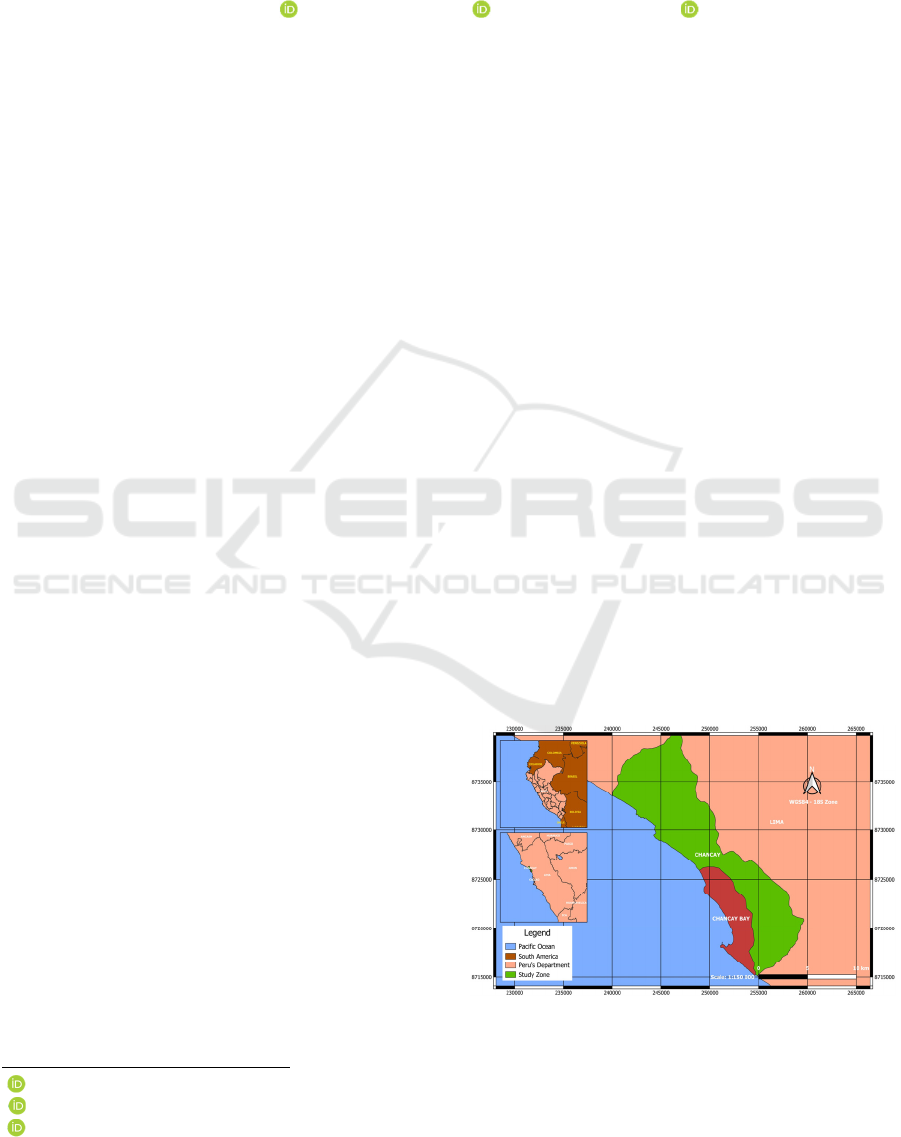
Therefore, in this article the wave characterization
will be carried out with the medium regime method of
Chancay Bay, Figure 1, for three numerical modeling
scenarios in the Delft3D software using satellite
information from the current year and nautical chart of
Chancay Bay in its latest version, as well as data from
Copernicus ERA5 over a period of 30 years and field
measurements requested from the Directorate of
Hydrography and Navigation (DIHIDRONAV) in its
latest version.
Figure 1: Study Zone of Chancay.
Soto, J., Guzman, E. and Ramos, C.
Regime Analysis with Numerical Modelling of Wave Dynamics and Determination of Potential Flood Zones in Chancay Bay, Peru.
DOI: 10.5220/0012631700003696
Paper published under CC license (CC BY-NC-ND 4.0)
In Proceedings of the 10th International Conference on Geographical Information Systems Theory, Applications and Management (GISTAM 2024), pages 51-61
ISBN: 978-989-758-694-1; ISSN: 2184-500X
Proceedings Copyright © 2024 by SCITEPRESS – Science and Technology Publications, Lda.
51
Likewise, this article aims to determine the
potential flood zones through a numerical model and
compare its results with data taken in the field, as well
as a tentative location of coastal structures.
2 METHODOLOGY
2.1 Tools
Delft3D is a numerical modeling software widely used
in coastal zone research, since very good results are
obtained, and it is easy to acquire through educational
licenses valid for up to one year. Likewise, Delft3D
has the WAVE module which simulates the evolution
of waves generated by wind in coastal areas (Deltares,
2023). This module models the propagation of waves
and waves generated by wind, which in turn considers
the effects generated by wave diffraction and
refraction. As input values, the bathymetry of the area
in UTM coordinates and height, period and wave
direction data are assigned.
2.2 Materials
To carry out numerical modeling in the medium
regime, in situ information from DIHIDRONAV for
the years 2008 and 2009 from the ADCP Nortek AS
(R) has been used, as well as oceanographic data from
Copernicus ERA 5.
In the case of bathymetric information, the nautical
chart of Chancay Bay was acquired in .TIF format
from DIHIDRONAV and updated satellite
information of the coastline from Google Earth.
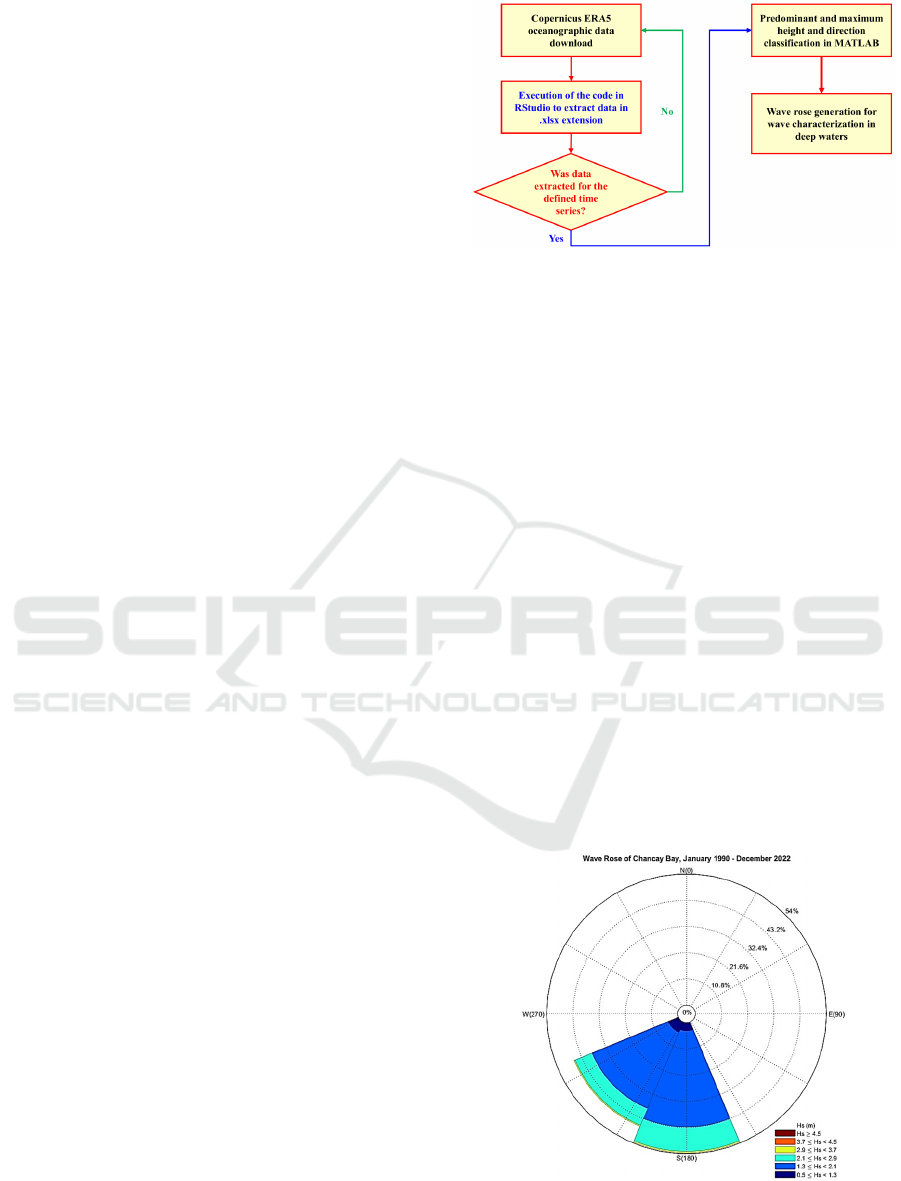
2.3 Method
The mean regime method is used to statistically
classify the highest and average values of a time series
for each cardinal direction of wave propagation,
Figure 2. This is possible by programming in RStudio
and MATLAB. As it is encrypted information, the
data is extracted in RStudio in .xlsx format and in
MATLAB the classification is provided as a result
with the configuration indicated in the code.
2.4 Data Used
The nautical chart of Chancay Bay is digitized the
depths and coastline, while the current satellite
information is digitized the coastline. Likewise, with
the data collected for a period of more than 30 years
of Copernicus ERA5, the extraction and classification
Figure 2: Processing flow diagram and obtaining medium
regime classification.
procedure are carried out with the medium regime
method. On the other hand, the ADCP's in situ data
was already classified. With the information available,
three modelling cases are classified in different
conditions for Chancay Bay, as a result, they are the
following.
The first case is a regime analysis for a wave of
more than 30 years with bathymetric data from the
nautical chart of Chancay Bay.
Then, a regime analysis for a wave from the years
2008 and 2009 with bathymetric data from the
Chancay nautical chart.
Finally, a regime analysis for a wave of more than
30 years with satellite bathymetric data to date.
2.5 Wave Characterization in Deep
Waters
The general characteristics such as cardinal direction
and wave height in shallow waters, Figure 3, that
predominate in Chancay Bay are coming from the
south with an average height of between 1.3 and 2.1
Figure 3: Wave rose in shallow water of Chancay bay
(S11°34'17" W77°16'1.99").
GISTAM 2024 - 10th International Conference on Geographical Information Systems Theory, Applications and Management
52
meters, and less frequently, but of greater height
between 2.9 and 3.7 meters. There are also wave
heights of between 3.7 to 4.5 meters and higher, which
are not visible due to their low frequency, but are not
non-existent.
Now that the general characteristics are known, in
Table 1, the classified wave data for the 1st and 3rd
modeling case is observed, while in Table 2, the
classified wave data for the 2nd modeling case is
observed. In both, the average and maximum cases are
handled for each cardinal direction.
Table 1: Average regime for wave data for a period of more
than 30 years from Copernicus ERA5.
Case
Dir
Hs (m) Tp (s)
Case
Dir
Hs (m) Tp (s)
1
WSW
1.54 10.82 5
SW
1.69 11.12
2 1.97 12.00 6 3.48 16.04
3
S
1.92 8.66 7
SSW
1.76 10.12
4 3.71 13.21 8 4.23 16.09
Table 2: Average regime for wave data from the
DIHIDRONAV ADCP for the years 2008 and 2009.
Case Dir Hs (m) Tp (s)
1
S
1.92 8.81
2 2.66 13.21
3
SW
1.71 10.89
4 3.06 14.13
5
SSW
1.69 9.99
6 2.83 14.46
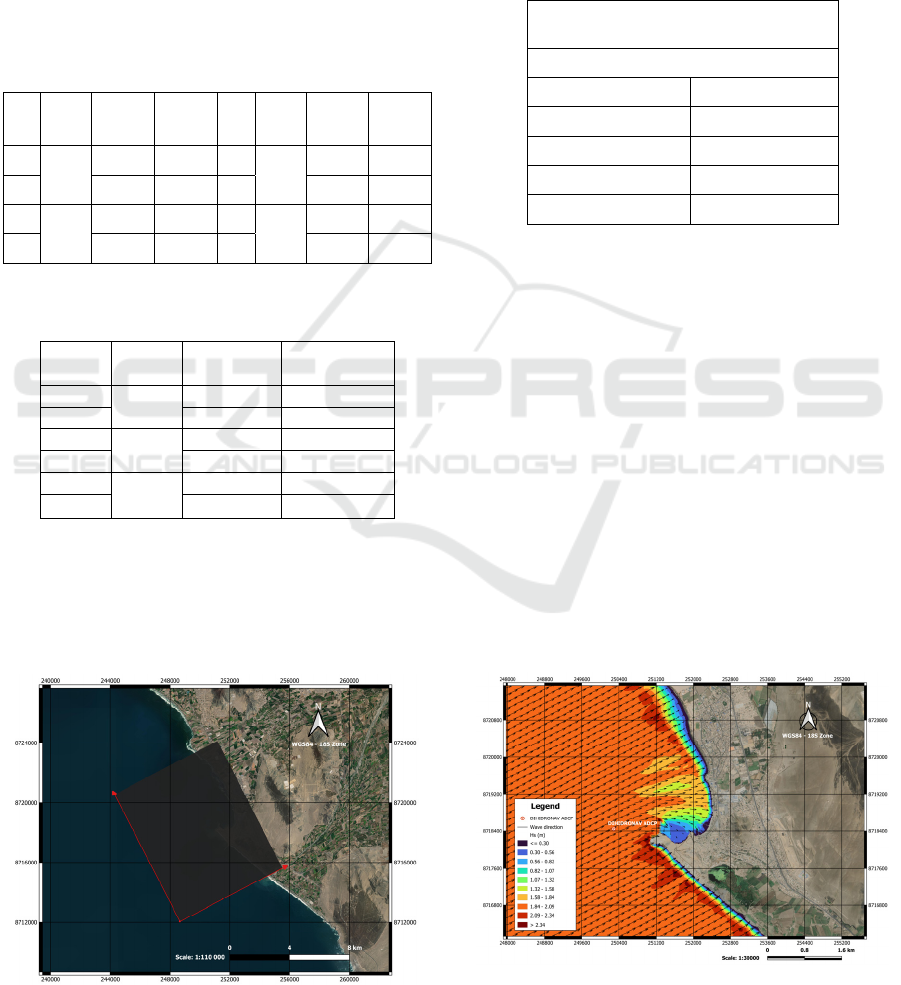
2.6 Numerical Modeling
The Delft3D model operates within a discrete domain,
defining a particular calculation region through a
computational mesh. The RGFGRID module prepares
Figure 4: Computational mesh calculation in Chancay Bay.
this mesh, and the QUICKIN module uses triangular
interpolation to determine depths based on digitized
bathymetry.
Likewise, Figure 4 shows the computational
domain for numerical modelling. On the other hand,
Table 3 presents the geometric characteristics of said
domain.
Table 3: Average regime for wave data from the
DIHIDRONAV ADCP for the years 2008 and 2009.
Shallow waters
Computational grid
Long (km) 9.53
Width (km) 7.72
dx (m) 15.00
dy (m) 20.00
Angle (°) 24.00
Finally, in the WAVE module, the input values of
height, period, and direction from Tables 1 and 2 are
entered according to the direction of wave
propagation.
3 RESULTS AND DISCUSSIONS
Of the three modeling cases, the first case, according
to Table 1, gives 8 results for the west-southwest,
south, southwest, and south-southwest directions in its
predominant and maximum conditions. Of which, the
maxims will be highlighted, as they are most relevant
to the knowledge of potential flood zones.
Figure 5, Figure 6, Figure 7 and Figure 8 show the
results for the maximum wave conditions of Chancay
Bay from the first modeling case. For the west-
southwest direction the following result was obtained.
Figure 5: Maximum condition in west-southwest direction
in Chancay Bay.
Regime Analysis with Numerical Modelling of Wave Dynamics and Determination of Potential Flood Zones in Chancay Bay, Peru
53
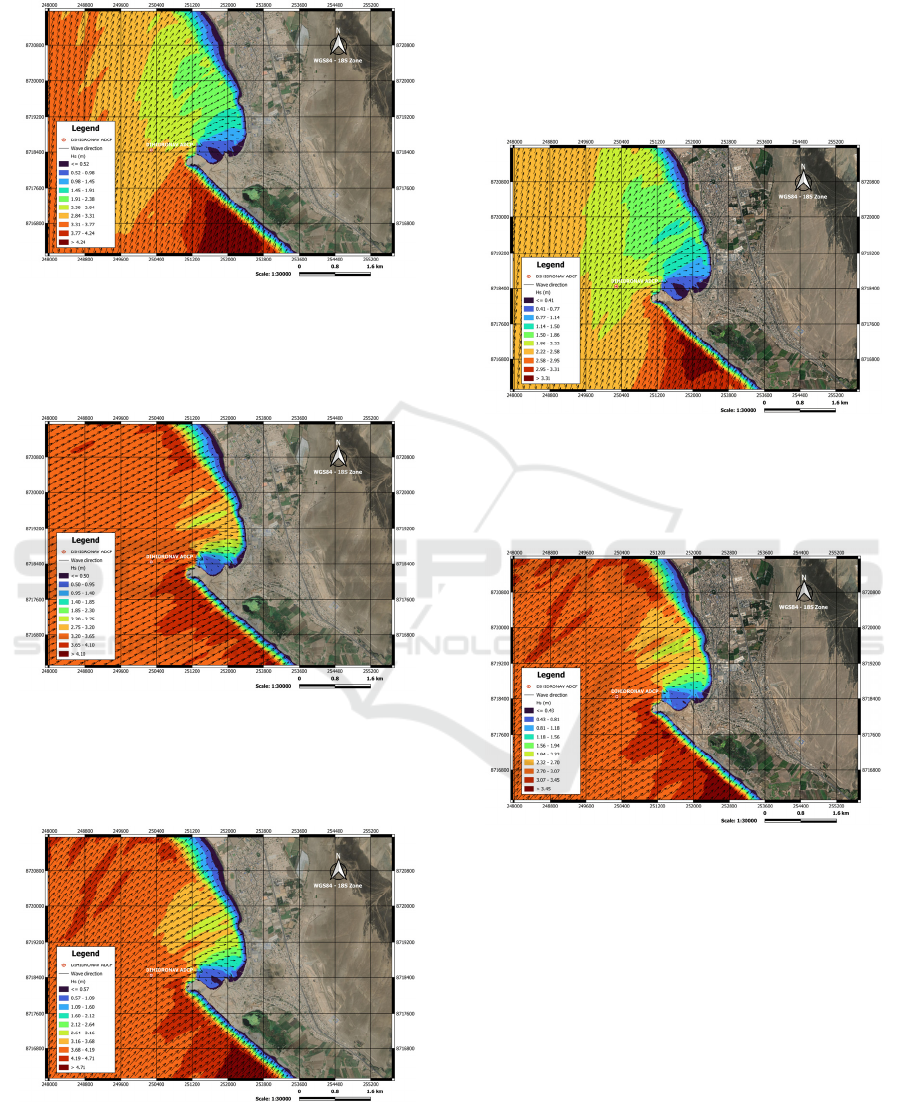
For the south direction in maximum wave
conditions of Chancay Bay.
Figure 6: Maximum condition in south direction in Chancay
Bay.
Likewise, for the southwest direction in maximum
wave conditions of Chancay Bay.
Figure 7: Maximum condition in southwest direction in
Chancay Bay.
Also, for the south-southwest direction in
maximum wave conditions in Chancay Bay.
Figure 8: Maximum condition in a south-southwest
direction in Chancay Bay.
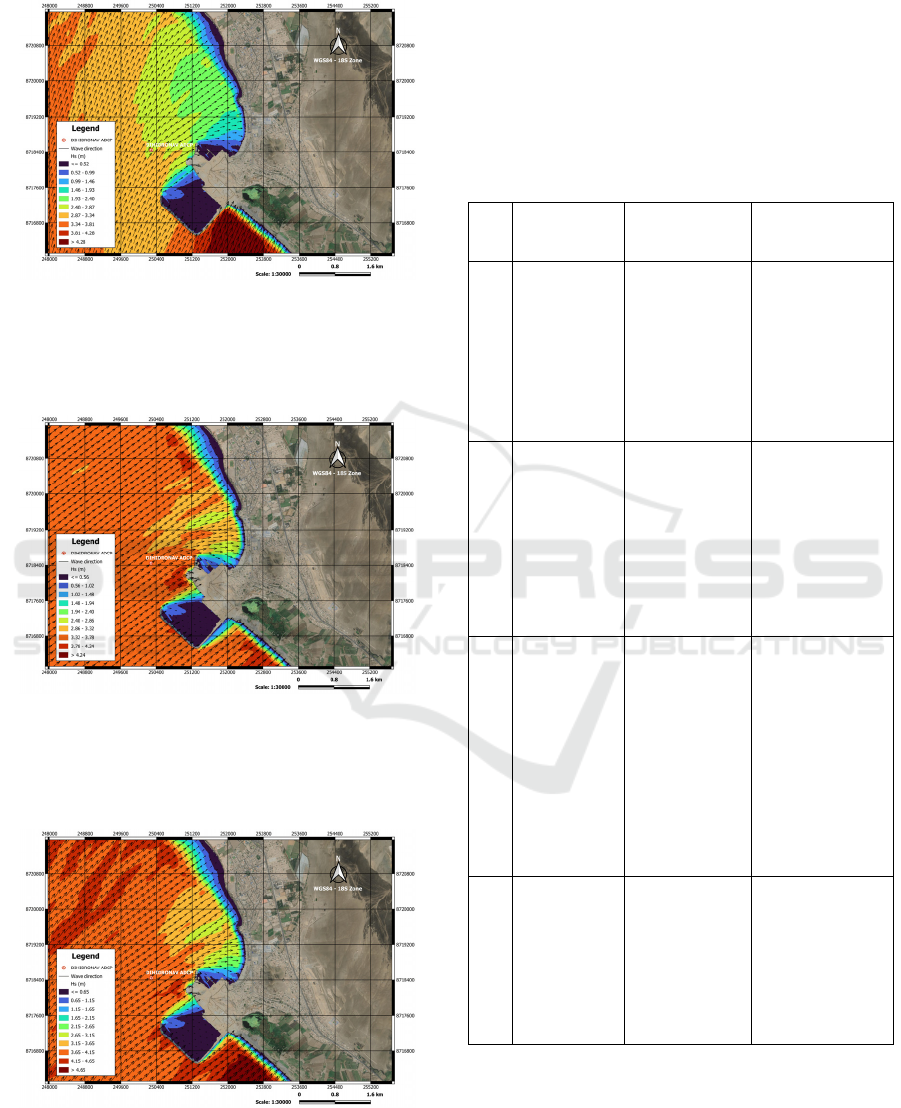
The second case, according to Table 2, gives 6
results for the south, southwest, south-southwest
directions. Of which, the maxims will be highlighted;
Figure 9, Figure 10 and Figure 11 for what was
previously said, to know the potential flooding zones.
Then, for the south direction in maximum wave
conditions of Chancay Bay, the following result was
obtained.
Figure 9: Maximum condition in a southerly direction in
Chancay Bay.
Additionally, for the southwest direction in
maximum wave conditions of Chancay Bay.
Figure 10: Maximum condition in southwest direction in
Chancay Bay.
Also, for the south-southwest direction in
maximum wave conditions of Chancay Bay.
This second modeling case, since it does not have
an updated bathymetry and current in situ wave data,
except for the ADCP whose measurement is valid
until 2009, which can be validated through ERA5 data
from 2008 to 2009, is calibrated in function of the
bottom friction coefficient of the model until
obtaining approximate results.
Based on the results of the second modeling case,
the wave Run Up is estimated for three points in the
GISTAM 2024 - 10th International Conference on Geographical Information Systems Theory, Applications and Management
54
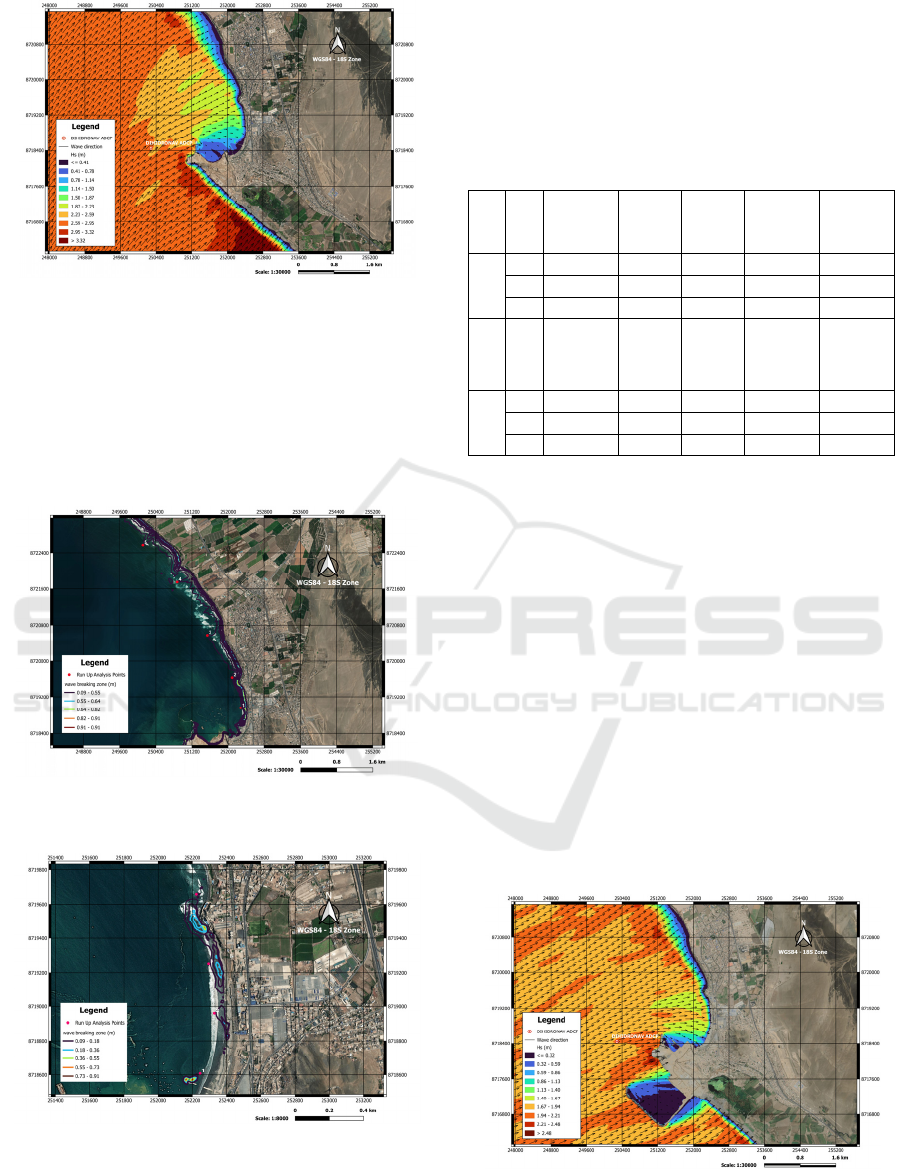
Figure 11: Maximum condition in a south-southwest
direction in Chancay Bay.
area that are within or close to the surf zones. These
areas were chosen because they have the highest
concentration of human activity, such as commerce
and fishing. Of the analysis points mentioned, only the
first three that are presented in Figure 12 and Figure
13 are considered.
Figure 12: Analysis points to estimate the Run Up of the
wave in the south direction.
Figure 13: Analysis points to estimate the Run Up of the
wave in the south-southwest direction.
The following Table 4 displays the parameters
obtained for said calculation, which are a function of
the bathymetry depth, height, and wave distance at
said point with respect to the coast from the surf zone,
which can be seen in Figure 12-13 and summarized in
Table 4.
Table 4: Summary of distances, depth, and heights of the
points of interest of the Run Up calculation under maximum
conditions.
Dir
Poin
ts
Model
Distance
(m)
Model
Depth
(m)
Model
Hs (m)
Regime
Analysis
Hs (m)
Regime
Analysis
T
p
(s)
S
1 362.40 2.90 1.88 2.66 13.21
2 217.71 2.90 1.70 2.66 13.21
3 135.42 2.90 1.25 2.66 13.21
SW
- - - - - -
SSW
1 80.90 1.40 0.46 2.83 14.46
2 78.00 1.40 0.85 2.83 14.46
3 84.02 1.40 0.74 2.83 14.46
Finally, the third case, based on Table 1, gives, like
the first modeling scenario, 8 results for the west-
southwest, south, southwest, and south-southwest
directions. This will also highlight the results of the
maximum conditions, as they are more relevant to the
knowledge of potential flood zones.
The difference between the first and third
modeling cases is the change in the bathymetry and
coastline used. The first specifies the use of the
nautical chart until its last update, which dates to 2005,
while the third uses the same bathymetry of the
nautical chart with the current coastline provided by
Google Earth.
In Figure 14, Figure 15, Figure 16, and Figure 17
the results of the third case of numerical modeling for
Chancay Bay in maximum conditions will be seen.
So, for the west-southwest direction in maximum
wave conditions of Chancay Bay.
Figure 14: Maximum condition in west-southwest
direction in Chancay Bay.
Regime Analysis with Numerical Modelling of Wave Dynamics and Determination of Potential Flood Zones in Chancay Bay, Peru
55
For the south direction in maximum wave
conditions of Chancay Bay.
Figure 15: Maximum condition in a southerly direction in
Chancay Bay.
For the southwest direction in maximum wave
conditions of Chancay Bay.
Figure 16: Maximum condition in southwest direction in
Chancay Bay.
For the south-southwest direction in maximum
wave conditions of Chancay Bay.
Figure 17: Maximum condition in a south-southwest
direction in Chancay Bay.
Although the results presented are from scenarios
with conditions that vary the bathymetry, coastline
and wave reanalysis of ERA5, the advantages and/or
disadvantages of these range from modeling in context
to not having many in situ measurements. Table 5
presents the comparison between these modeling
scenarios according to the mentioned conditions.
Table 5: Summary of the characteristics and usefulness that
it would have in a future numerical modeling of Chancay
Bay.
Desc
Case 1 Case 2 Case 3
Bathymetry
Nautical
chart
outdated
compared to
the year in
which this
research was
carried out.
Nautical chart
outdated
compared to
the year in
which this
research was
carried out.
Outdated nautical
chart, but with an
updated coastline
compared to the
year in which
this research was
carried out.
In situ measurements
Outdated in
situ
measurement
s compared
to the year in
which this
research was
carried out.
In situ
measurements
updated with
the bathymetric
information of
the model
made.
In situ
measurements
outdated with
respect to the
year in which
this research was
carried out.
Coastal line
Coastline
outdated as
of the year
this research
was
conducted.
Coastline
updated to the
year in which
the bathymetric
and
measurement
information of
the model
carried out was
collected.
Coastline
updated to the
year this research
was carried out.
Utility
It serves as a
model for
validation
only if
satellite
images from
recent years
are available.
It serves as a
model for
validation only
if satellite
images from
recent years are
available.
It serves as a
model for
validation only if
satellite images
from recent years
are available.
In this sense, the advantages of carrying out a
medium regime analysis in Chancay Bay can be traced
back to the validation of future scenarios with the use
of primary information available to date. However,
this limits the information regarding the timing of the
GISTAM 2024 - 10th International Conference on Geographical Information Systems Theory, Applications and Management
56

waves, since in recent years Peru has presented
climatic phenomena such as “Fenómeno El Niño
Costero” and “Ciclón Yaku” that alter the wave
regime. Therefore, future modeling would require
greater computational scope. That is, cover larger
areas for wave propagation in areas that do have
information from later years.
With emphasis on the aforementioned idea, in the
country of Peru, research titled "Simulación de
transporte de sedimentos en la bahía Ferrol,
Chimbote" was carried out, whose numerical model
was based on the concept of selecting the most
representative wave cases, validation of the numerical
model with DIHIDRONAV holograph measurements
and future prediction for the selected conditions
(Ramos, 2017). As a result of its calibration and
validation, it used the same energy dissipation
calibration parameters to obtain a predictive model for
a time of 20 years in the future.
4 ANALYSYS OF RESULTS
For the first modeling case, the following Delft3D
results were obtained referring to the wave height in
Table 6.
Table 6: Summary of results obtained from the medium
regime and ADCP of the first modeling case.
Dir
Measuremen
t
Predominant
Condition
Maximum
Condition
Hs
(m)
Tp (s)
Hs
(m)
Tp (s)
WS
W
In Situ 1.30 12.60 2.10 17.30
Delft3D 1.49 - 1.96 -
Error (%) 14.62 - 6.67 -
S
In Situ 1.30 12.60 2.10 17.30
Delft3D 1.50 - 2.85 -
Error (%) 15.38 - 35.71 -
SW
In Situ 1.30 12.60 2.10 17.30
Delft3D 1.52 - 3.54 -
Error (%) 16.92 - 68.57 -
SSW
In Situ 1.30 12.60 2.10 17.30
Delft3D 1.44 - 3.90 -
Error (%) 10.77 - 85.71 -
As can be seen, there are wave heights that are
above the ADCP in situ measurement data, and some
are even higher than 50% of the real value, which are
the southwest and south-southwest directions.
On the other hand, in the second modeling case,
the following Delft3D results were obtained referring
to the wave height in Table 7.
Table 7: Summary of results obtained from the medium
regime and ADCP of the second modeling case.
Dir Measurement
Predominant
Condition
Maximum
Condition
Hs
(m)
Tp (s)
Hs
(m)
Tp (s)
S
In Situ 1.30 12.60 2.10 17.30
Delft3D 1.50 - 2.05 -
Error (%) 15.38 - 2.38 -
SW
In Situ 1.30 12.60 2.10 17.30
Delft3D 1.53 - 2.92 -
Error (%) 17.69 - 39.05 -
SSW
In Situ 1.30 12.60 2.10 17.30
Delft3D 1.38 - 2.60 -
Error (%) 6.15 - 23.8 -
As can be seen, the wave heights obtained by the
Delft3D model are very close to the in-situ
measurement. Except for the southwest and south-
southwest directions that exceed in a range of 20-40%.
Likewise, in the third modeling scenario, the
following Delft3D results were obtained, also
referring to wave height, Table 7.
Table 8: Summary of results obtained from the medium
regime and ADCP of the third modeling case.
Dir Measurement
Predominant
Condition
Maximum
Condition
Hs (m) Tp (s) Hs (m) Tp (s)
WSW
In Situ 1.30 12.60 2.10 17.30
Delft3D 1.47 - 1.95 -
Error (%) 13.08 - 7.14 -
S
In Situ 1.30 12.60 2.10 17.30
Delft3D 1.47 - 2.79 -
Error (%) 13.08 - 32.86 -
SW
In Situ 1.30 12.60 2.10 17.30
Delft3D 1.50 - 3.52 -
Error (%) 15.38 - 67.62 -
SSW
In Situ 1.30 12.60 2.10 17.30
Delft3D 1.42 - 3.88 -
Error (%) 9.23 - 84.76 -
Based on Table 6, Table 7 and Table 8, exceedance
patterns are observed with respect to the wave height
measured by the ADCP in the southwest and south-
southwest directions, which are greater than 50% with
respect to the actual measurement value.
Although the 3 modeling cases can be calibrated in
the same Delft3d WAVE model, it was decided to
work only with the second case, since it is the one that
works with all the most current data officially, both
bathymetry, measurement, and line coast.
Regime Analysis with Numerical Modelling of Wave Dynamics and Determination of Potential Flood Zones in Chancay Bay, Peru
57
Therefore, the Run Up calculation based on Table
IV and the methodology of Van Der Meer and Stam
gave the following results, Table 9, after having done
the calibration.
Table 9: Wave Run Up calculation with the Van Der Meer
and Stam formulation for maximum wave conditions
considering the tide level.
Method S SW SSW
Van
Der
Meer y
Stam
(1992)
Ru 10%
(m) =
3.70
Ru 10%
(m) =
-
Ru 10%
(m) =
1.60
Ru 5%
(m) =
4.10
Ru 5%
(m) =
-
Ru 5%
(m) =
1.70
Ru 2%
(
m
)
=
4.70
Ru 2%
(
m
)
=
-
Ru 2%
(
m
)
=
1.90
Ru 10%
(
m
)
=
3.40
Ru 10%
(
m
)
=
-
Ru 10%
(
m
)
=
1.20
Ru 5%
(m) =
3.80
Ru 5%
(m) =
-
Ru 5%
(m) =
2.40
Ru 2%
(
m
)
=
4.30
Ru 2%
(
m
)
=
-
Ru 2%
(
m
)
=
2.60
Ru 10%
(
m
)
=
2.80
Ru 10%
(
m
)
=
-
Ru 10%
(
m
)
=
2.00
Ru 5%
(m) =
3.10
Ru 5%
(m) =
-
Ru 5%
(m) =
2.20
Ru 2%
(m) =
3.40
Ru 2%
(m) =
-
Ru 2%
(m) =
2.40
In this Table 9, the wave Run Ups were obtained
for the probability of occurrence of 10%, 5% and 2%
for the 3 selected points in the south and south-
southwest directions. In the southwest there were no
important surf zones, so they are not considered. Of
these, the wave heights with the highest percentage
represent heights in normal conditions, while a lower
percentage represents heights in maximum conditions.
Additionally, the tide level is considered, the
difference between the highest and lowest level being
the result of this, which is added to the Run Up
obtained, which by polling DIHIDRONAV tide tables
gives a value of 0.97 m.
The south direction presents higher waves
compared to the south-southwest direction, despite
this both represent a danger to human activity in
coastal areas, since the heights can exceed terrain
levels greater than 4 meters and a large part of the
shops or points of port activity in the area are located
near the coastline whose elevation is 0 meters.
The wave heights obtained do not mean that they
will enter the coastal zone maintaining the same height
in magnitude, these will be reduced until they reach or
exceed the terrain levels according to the wave height
obtained, but with minimum wave heights that may be
called sheets of water. However, its height may be
minimal, but its extension within the coastal zone may
be wide. This suggests that the impact of the wave
alone should not be underestimated because of its
apparently small size.
In that sense, flood zones are estimated through
interpolation between contour lines of the Alos Palsar
DEM and elevations from Google Earth since the
elevations of the DEM are over scales of the real
height.
Table 10 shows the summary of the interpolation
carried out, from which a proportional ratio was
detected between the Google Earth elevations and the
Alos Palsar DEM.
Table 10: Summary of the elevation interpolation process
between Alos Palsar and Google Earth.
INTERPOLATION TO ALOS PALSAR
Goo
g
le Earth DEM Alos Palsar
Elevation (m)
1.00
Elevation (m)
21.00
2.00 23.00
3.00 25.00
4.00 27.00
5.00 29.00
6.00 31.00
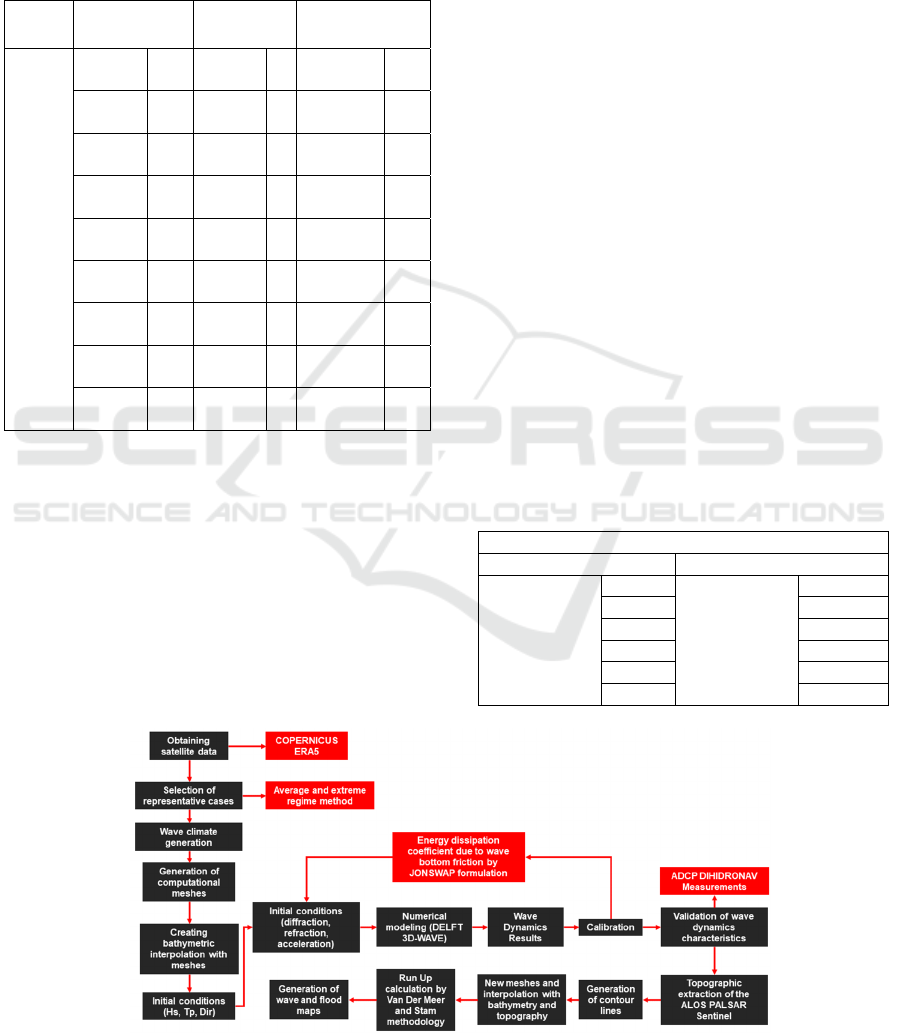
Figure 18: Numerical modeling flowchart of DELFT3D WAVE software to determine flood zones.
GISTAM 2024 - 10th International Conference on Geographical Information Systems Theory, Applications and Management
58
Based on the table shown, the range of the wave
Run Up can be determined in the areas of the coast of
interest.
Additionally, Figure 18 presents a numerical
modeling flowchart for determining flood zones in
the context of Chancay Bay. It can be noted that with
the recent growth in the use of artificial intelligence,
the use of predictive models of artificial neural
networks (ANN), calibration and validation in a
future context would be interesting to carry out.
However, for the present study it would not be useful,
but rather useful for training.
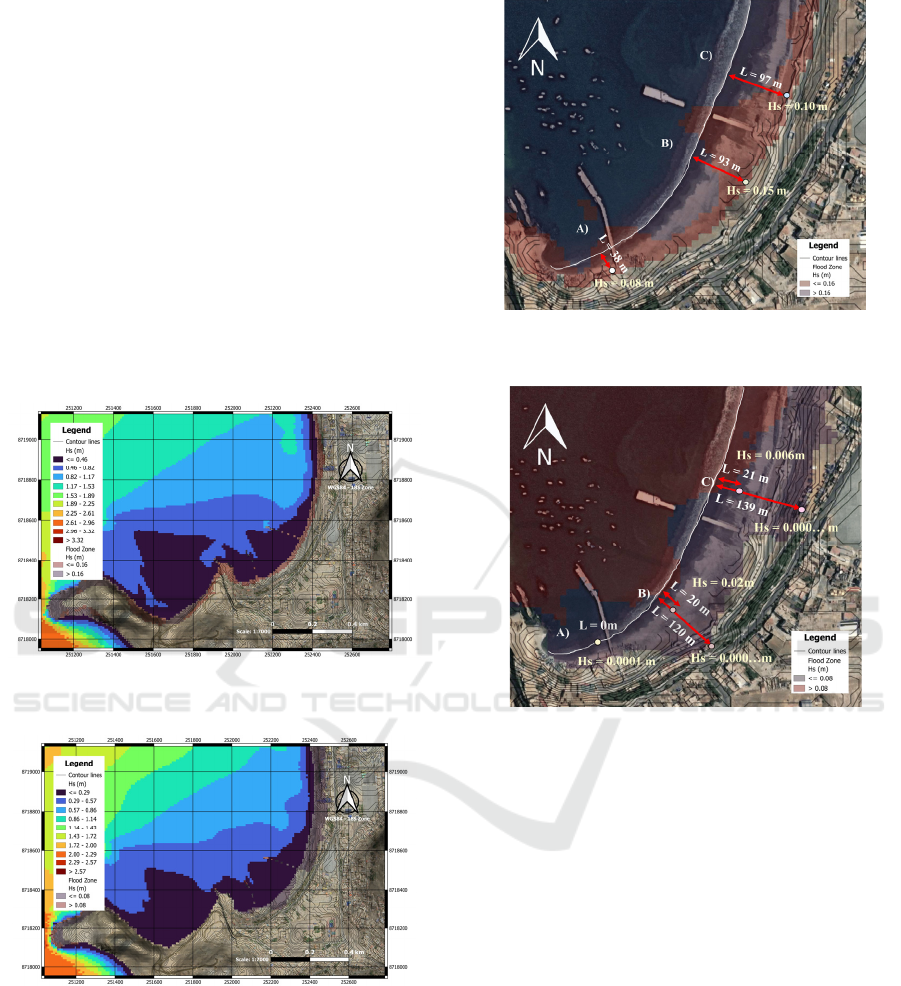
Below, the flood zones obtained from numerical
modeling are presented, which considers the
elevations of the internal coastal zone, in the
maximum conditions for the south and south-
southwest directions, as seen in Fig. 19 and 20.
Figure 19: Flood zones in the coastal area of Chancay for
the maximum condition in the south direction.
Figure 20: Flood zones in the coastal area of Chancay for
the maximum condition in the south-southwest direction.
Based on Figure 19 and 20, it is determined that
the range of the waves extends to levels of 4 and a
maximum of 5 meters in elevation for the south
direction.
The wave at points A), B) and C) of Figure 21 in
a southerly direction travel between levels of 4 to 5
m, with lengths of the order of 38, 93 and 97 m up to
reach wave heights of 0.15 m. That is, from the
Figure 21: Flood zones with representative values for south
direction.
Figure 22: Flood zones with representative values for south-
southwest direction.
estimated elevation of Table 9. Around 92% of it
dissipated during that journey, but with great scope.
On the other hand, based on the flood zone in
Figure 22 in the south-southwest direction, it is
determined that the reach of the waves extends below
levels of 2 m, but that they reach into the coast
between the 20 and 21 m at points B) and C) with
significantly low wave heights. Beyond the coast,
wave heights are close to 0, which indicates that they
dissipate completely beyond 3 m of terrain elevation.
Therefore, the southern direction zones contain
greater relevance than the south-southwest direction
due to its flooding potential due to the longitudinal
reach within the coast and with wave heights of the
order of 0.2 m that exceed that of the south-southwest
by 96%. Therefore, an attempt at coastal protection
structures, Figure 23, can be proposed in this and
other stretches of the coast for future research.
Regime Analysis with Numerical Modelling of Wave Dynamics and Determination of Potential Flood Zones in Chancay Bay, Peru
59
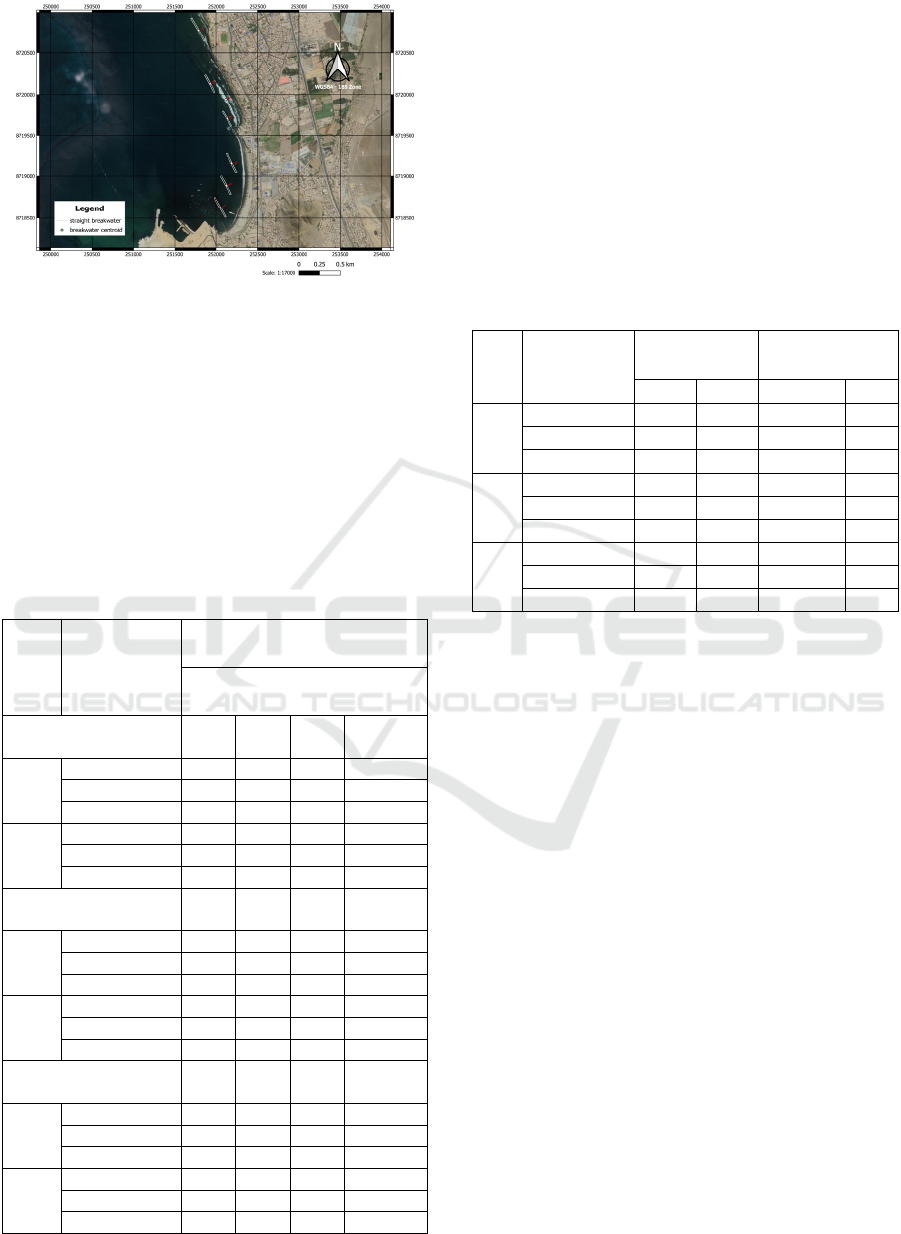
Figure 23: Tentative proposal for coastal protection
structures.
5 VALIDATION
Based on the result of the second modeling case,
calibration was performed with respect to the bottom
friction coefficient of the JONSWAP formulation.
This is one of the terms that condition the dissipation
of wave energy, the other terms are called
Table 11: Summary of results obtained from the calibration
process of the background friction coefficient.
Dir Measurement
Maximum Condition
Hs (m)
Bottom friction
coefficient
0.07 0.08 0.11 0.14
SW
In Situ 2.10 2.10 2.10 2.10
Delft3D 2.92 2.90 2.87 2.84
Error (%) 39.05 38.10 36.67 35.24
SSW
In Situ 2.10 2.10 2.10 2.10
Delft3D 2.60 2.59 2.56 2.53
Error (%) 23.81 23.33 21.90 20.48
Bottom friction
coefficient
0.19 0.23 0.29 0.38
SW
In Situ 2.10 2.10 2.10 2.10
Delft3D 2.80 2.76 2.70 2.63
Error (%) 33.33 31.43 28.57 25.24
SSW
In Situ 2.10 2.10 2.10 2.10
Delft3D 2.49 2.45 2.4 2.33
Error (%) 18.57 16.67 14.29 10.95
Bottom friction
coefficient
0.50 0.71 0.83 1.04
SW
In Situ 2.10 2.10 2.10 2.10
Delft3D 2.53 2.36 2.27 2.13
Error (%) 20.48 12.38 8.10 1.43
SSW
In Situ 2.10 2.10 - -
Delft3D 2.24 2.08 - -
Error (%) 6.67 0.95 - -
Whitecapping and Breaking induced by the change in
depth (Alpha-Gamma). The last mentioned are
limited to the proposed study, due to the scarce
information on wave data.
Table 11 shows the table of bottom friction
coefficient values through the iterations carried out
for calibration. Then, the values are close to those
measured in the field, with the southwest and south-
southwest coefficients being 1.04 m2s-3 and 0.71
m2s-3, respectively. Therefore, the new calibrated
and compared measurement values are as follows.
Table 12: Summary of results obtained from the calibration
process of the background friction coefficient.
Dir Measurement
Predominant
Condition
Maximum
Condition
Hs (m) Tp (s) Hs (m) Tp (s)
S
In Situ 1.30 12.60 2.10 17.30
Delft3D 1.50 - 2.05 -
Error (%)
15.38
-
2.38
-
SW
In Situ 1.30 12.60 2.10 17.30
Delft3D 1.50 - 2.13 -
Error (%)
15.38
-
1.43
-
SS
W
In Situ 1.30 12.60 2.10 17.30
Delft3D 1.42 - 2.08 -
Error (%)
9.23
-
0.95
-
Table 12 shows how the results in maximum
condition for the southwest and south-southwest
directions are in the error range of 0% to 2% with
respect to the ADCP measurement value.
6 CONCLUSIONS
The wave dynamics in Chancay Bay were studied for
a period of 32 years, in which the most notable result
of the research is the flood zones that put the
population at risk.
To this end, modeling cases of the wave
propagation of Chancay Bay were selected to
determine the variational percentages with respect to
the ADCP measurement from the medium regime
technique to calibrate and determine the potential
flooding zones of the Chancay Bay.
The results show that the flood zones reach wave
heights of between 0.10 to 0.15 m, but with a large
extension towards the population in the southern
direction and these even exceed those in the south-
southwest by 96%, thus emphasizing to the
possibility of placing coastal protection structures for
future research.
GISTAM 2024 - 10th International Conference on Geographical Information Systems Theory, Applications and Management
60

Finally, a large amount of data is not required to
carry out the methodology suggested in this article.
To carry out an investigation of this style, it is
sufficient to have the bathymetry of the area through
nautical charts, wave data that can be extracted from
COPERNICUS ERA5 in large time series and short-
term in situ wave measurements that can be used for
calibration and validation of the numerical model.
However, the research results can continue to be
improved through information from oceanographic
buoys from surrounding areas, which covers more
modeling area and more robust scenarios, but with
greater computational cost due to its modeling
extension.
Therefore, the methodology used can be
replicated in coastal areas that do not have much
information on wave measurements, as is the case of
the Peruvian coast and specifically the Chancay Bay
as well as other parts of the world.
REFERENCES
Wang, H., Mouche, A., Husson, R., Grouazel, A., Chapron,
B., & Yang, J. (2022). Assessment of Ocean Swell
Height Observations from Sentinel-1A/B Wave Mode
against Buoy In Situ and Modeling Hindcasts. Remote
Sensing, 14(4), 862. https://doi.org/10.3390/rs140408
62
Pinault, J., Morichon, D., & Roeber, V. (2020). Estimation
of irregular wave runup on intermediate and reflective
beaches using a phase-resolving numerical model.
Journal of Marine Science and Engineering, 8(12), 1–
23. https://doi.org/10.3390/jmse8120993
Prakash, N., Ashly, K. U., Seelam, J. K., Bhaskaran, H.,
Yadhunath, E. M., Lavanya, H. N., Krishnan, R., &
Surisetty, V. V. a. K. (2021). Investigation of near-
shore processes along North Goa beaches: A study
based on field observations and numerical modelling.
Journal of Earth System Science, 130(4).
https://doi.org/10.1007/s12040-021-01755-3
Villagrán, M., Gómez, M., & Martínez, C. (2022). Coastal
Erosion and a Characterization of the Morphological
Dynamics of Arauco Gulf Beaches under Dominant
Wave Conditions. Water, 15(1), 23. https://doi.org/
10.3390/w15010023
Leach, C., Hague, B. S., Kennedy, D. N., Carvalho, R. C.,
& Ierodiaconou, D. (2021). Identifying oceanographic
conditions conducive to coastal impacts on temperate
open coastal beaches. Natural Hazards, 109(1), 499-
521. https://doi.org/10.1007/s11069-021-04845-z
Deltares. (2023). Delft3D-WAVE User Manual, Manuals.
Recovered from https://content.oss.deltares.nl/delf
t3d4/Delft3D WAVE_User_Manual.pdf [Consultation:
March 28, 2023]
Ramos, C. (2017). Simulación de transporte de sedimentos
en la bahía Ferrol, Chimbote. [Tesis de maestría,
Universidad Nacional Mayor de San Marcos, Facultad
de Ciencias Física, Unidad de Posgrado]. Repositorio
institucional Cybertesis UNMSM. https://cybertesis.
unmsm.edu.pe/handle/20.500.12672/6779
Regime Analysis with Numerical Modelling of Wave Dynamics and Determination of Potential Flood Zones in Chancay Bay, Peru
61
