
A Code Distance Approach to Measure Originality in Computer
Programming
Elijah Chou
1 a
, Davide Fossati
1 b
and Arnon Hershkovitz
2 c
1
Computer Science Department, Emory University, Atlanta, GA, U.S.A.
2
Science and Technology Education Department, Tel Aviv University, Tel Aviv, Israel
Keywords:
Originality, Creativity, Educational Data Mining, Tree Edit Distance, Computer Science Education.
Abstract:
We propose a novel approach to measure student originality in computer programming. We collected two
sets of programming problems in Java and Python, and their solutions submitted by multiple students. We
parsed the students’ code into abstract syntax trees, and calculated the distance among code submissions
within problem groups using a tree edit distance algorithm. We estimated each student’s originality as the
normalized average distance between their code and the other students’ codes. Pearson correlation analysis
revealed a negative correlation between students’ coding performance (i.e., the degree of correctness of their
code) and students’ programming originality. Further analysis comparing state (features of the problem set)
and trait (features of the students) for this measure revealed a correlation with trait and no correlation with
state. This suggests that we are likely measuring some trait that a student has, possibly originality, and not
some coincidental feature of our problem set. We also examined the validity of our proposed measure by
observing the agreement between human graders and our measure in ranking the originality of pairs of code.
1 INTRODUCTION AND
RELATED WORK
Creativity is an important quality that has been widely
studied in education (Kupers et al., 2019; Donovan
et al., 2014). However, there is no established way
of measuring creativity in the context of computer
programming. In this study, we propose a method
to quantitatively measure originality, which is one
of the fundamental dimensions of creativity, by com-
paring code written by students with code written by
their peers. Moreover, we evaluate the relationships
between our originality measure and students’ out-
comes. With a consistent, objective measurement of
originality, we could potentially use it to improve pro-
gramming curricula and help people learn this impor-
tant skill.
Creativity Dimensions. Creativity has been rec-
ognized as an important skill for modern citizens
(Said Metwaly et al., 2017) that people can train start-
ing at a young age (Beghetto, 2010; Vygotsky, 2004).
a
https://orcid.org/0000-0002-6272-9601
b
https://orcid.org/0000-0003-3587-8860
c
https://orcid.org/0000-0003-1568-2238
It was suggested to promote academic achievement,
and motivate students in engaging more with learning
in the classroom (Anthony and Frazier, 2009; Davies
et al., 2013). Researchers have studied creativity
extensively through different perspectives (Kaufman
and Beghetto, 2009). Creativity was studied as a pro-
cess (Guilford, 1950), and as a personal trait (Parsons,
1971). It has been assessed through the products of
creativity themselves (Martindale, 1989). While cre-
ativity is widely considered an important trait, there
is still a lot of debate about the definition of creativity
and how it can be measured (Kilgour, 2006).
The general consensus is that creativity is a mul-
tidimensional concept that is composed of four key
characteristics. The first is fluency – the ability to gen-
erate a large number of ideas and directions of thought
for a particular problem. The second is flexibility – the
ability to think about as many uses and classifications
as possible for a particular item or subject. The third
is originality – the ability to think of ideas that are
not self-evident or banal or statistically ordinary, but
rather those that are unusual and even refuted. The
last is elaboration – the ability to expand an existing
idea and to develop and improve it by integrating ex-
isting schemes with new ideas (Martindale, 1989).
Our goal is to explore how creativity is expressed
Chou, E., Fossati, D. and Hershkovitz, A.
A Code Distance Approach to Measure Originality in Computer Programming.
DOI: 10.5220/0012632100003693
Paper published under CC license (CC BY-NC-ND 4.0)
In Proceedings of the 16th International Conference on Computer Supported Education (CSEDU 2024) - Volume 2, pages 541-548
ISBN: 978-989-758-697-2; ISSN: 2184-5026
Proceedings Copyright © 2024 by SCITEPRESS – Science and Technology Publications, Lda.
541

through the learning process, and create a measure
that can accurately capture one’s creativity. Partic-
ularly, we are trying to quantify students’ creativity
through the key characteristic of originality by ana-
lyzing their code (which can be considered as prod-
ucts of their creativity) for ideas that are not statisti-
cally ordinary.
Creativity and Computer Programming. In re-
cent years, creativity was shown to have a signifi-
cant correlation with computational thinking, and it
was acknowledged to have a positive impact on all
fields of study (Romeike, 2007). Studies indicated
that computational problem solving helped inspire
creativity in producing art (Lau and Lee, 2015; Seo
and Kim, 2016), and it was suggested that creativ-
ity can help facilitate the process of solving compu-
tational problems (Kong, 2019). It was also indi-
cated that standardized creativity tests were able to
predict the creativity of computer programming so-
lutions (Liu and Lu, 2002). The reason behind the
strong correlation between creativity and computer
programming was suggested to be that the two share
a set of thinking tools, such as observation, imagina-
tion, visualization, abstraction, and creation (Yadav
and Cooper, 2017). Hershkovitz et al. found positive
associations between computational creativity and the
fluency and flexibility dimensions of creative think-
ing (Hershkovitz et al., 2019), but significant nega-
tive correlations between computational thinking and
the flexibility and originality dimensions of creativity
(Israel-Fishelson et al., 2021).
Previous studies tried to use machine learning and
artificial intelligence to predict creativity scores in
computer programming (Manske and Hoppe, 2014;
Kovalkov et al., 2021b; Kovalkov et al., 2021a). For
example, Kovalkov et al. attempted to predict the
creativity scores of Scratch programs by training a
machine learning model. However, like many of the
other cited studies, their study did not have conclusive
results due to a discrepancy among human experts
when grading the same Scratch programs for creativ-
ity (Kovalkov et al., 2021b). Thus, our ultimate goal
is to define and implement a creativity measure that
does not depend on training data annotated for cre-
ativity by human judges. As different dimensions of
creativity might require different measures, we will
now narrow our focus on the originality dimension of
creativity.
Tree Edit Distance. In order to define a com-
putational approach to assessing student originality
through students’ computer programs, we need to be
able to calculate differences between programs. For-
tunately, computer programs are written with a for-
mal syntax which enables them to be represented in
structures such as abstract syntax trees (ASTs). Rep-
resenting programs with ASTs allows us to quantify
their differences by calculating their tree edit dis-
tance. Tree edit distance is defined as the minimum-
cost sequence of node edit operations that transform
one tree into another. Edit operations are node dele-
tions, node insertion, and label renaming (Zhang and
Shasha, 1989). Tree edit distance was shown to be
useful for applications such as computing text simi-
larities (Sidorov et al., 2015). Zhang and Shasha pro-
posed a recursive solution for calculating tree edit dis-
tance in 1989 (Zhang and Shasha, 1989). Their solu-
tion recursively decomposes trees into smaller sub-
forests. The new subforests are created by either
deleting the leftmost or the rightmost root node of a
given subforest. Algorithms that implement Zhang
and Shasha’s recursive approach are referred to as
Zhang decompositions (Schwarz et al., 2017).
2 MEASURING ORIGINALITY
We propose a practical, data driven definition of orig-
inality in computer programming. We will measure
the amount of originality of a computer programmer
as a function of how much, on average, the code writ-
ten by that programmer differs from the code written
by other programmers to solve the same set of prob-
lems. We tested our approach on two collections of
computer programs written by college students en-
rolled in introductory courses in two major universi-
ties. We calculated code distance measures on those
programs, and then used those distances to calculate
originality scores for each student.
Data Sets. The primary dataset used in this study
includes Java programs written by undergraduate
students in an introductory computer programming
course at Emory University. The dataset includes
five semesters of anonymized code submissions from
2016 to 2018. These programs were originally sub-
mitted as part of proctored quizzes, and had been
manually scored for correctness by the teaching as-
sistants of the course. We have a total of 19,284
unique student programs, each written by one of 867
students. Excluding incorrect programs, there is a
total of 12,475 student submitted programs. These
12,475 programs are those that the teaching assistants
deemed to fulfill all the requirements of their respec-
tive question. Since this data was taken from an intro-
ductory course, the efficiency and elegance of student
code was not considered when grading.
CSEDU 2024 - 16th International Conference on Computer Supported Education
542

We also analyzed a smaller dataset of similar pro-
grams written in Python. These programs were writ-
ten by students in an introductory computer program-
ming course at Carnegie Mellon University in Qatar
between 2013 and 2014. The Python dataset includes
a total of 1,724 anonymized student programs, and a
total of 931 programs after the exclusion of incorrect
ones.
Besides the difference in size, our Python and Java
datasets are quite comparable, as the programs were
written during proctored exams by students of similar
level, in similar courses, taught by the same instructor.
Using two different datasets will allows us to validate
the stability of our originality measure across differ-
ent coding languages.
Data Preprocessing. Student programs were first
exported from their original source as text files that
included all student source codes. These were then
converted into Java files in preparation for JavaParser
processing into abstract syntax trees (ASTs). Once
converted, the Java programs were sorted into sepa-
rate folders according to which coding problem the
program was written to solve.
Within the collection of student code, some pro-
grams were written to correct, or debug, “wrong”
code. For these questions, students were given a com-
mon piece of code that contained a few errors that
students were asked to fix. Since all students would
ultimately submit code that may not differ from one
another that much, we deemed it necessary to exclude
these programs from our analysis.
Another subset of code that was excluded from the
analysis were questions that asked students to answer
theoretical questions in addition to writing code. This
is because students may have earned full points on
the theoretical component of the question, but may
have earned no points on the coding aspect. The origi-
nality measure calculated from these programs would
most likely not have the same correlation with the
final assignment score compared to other code-only
questions.
Due to the implementation of JavaParser, student
code that had any issues with compiling or other syn-
tactical issues were also excluded from the final anal-
ysis. We would not be able to use these programs
especially if ASTs cannot be created for them.
For the Python dataset, we built a Python imple-
mentation with the same logic and calculations used
in the Java implementation of the originality compu-
tation. As such, we did not convert Python code into
Java code. However, the same preprocessing steps
that were outlined above were done on the Python
dataset as well, including the exclusion of programs
that students debugged, programs that included the-
oretical components, and programs that could not be
converted to abstract syntax trees.
Tree Edit Distance Calculation. To compute the
tree edit distance between two ASTs, we used the
Zhang-Shasha algorithm(Zhang and Shasha, 1989),
with some modifications to account for superficial dif-
ferences between programs (such as variable names)
that we want to ignore. For each computer program
in every folder, a tree edit distance was calculated be-
tween the AST of the program and the AST of one
other program in the folder. This was added to a to-
tal distance sum for each computer program, and once
this was repeated for every other computer program in
the folder, a final average is calculated for each com-
puter program. Once these averages were computed,
a comma-separated values (CSV) file was written for
each problem folder, with each row containing meta
data about a computer program and its calculated av-
erage distance. This process was completed for both
Java and Python programs with their respective im-
plementations.
As discussed previously, we needed to normalize
the average distances between programs because dif-
ferent programming problems require varying lengths
of code. Longer code tends to have a greater dis-
tance than shorter code, so directly comparing aver-
ages across different coding problems would not be
accurate. The z-scores of the average tree edit dis-
tances were calculated for each computer program
within their respective coding problem groups. The
CSV files were imported into a Jupyter notebook us-
ing Python and the pandas library, and the z-scores
were calculated using the statistical functions of the
SciPy library. For the purpose of exploring the ef-
fect of including or excluding non-perfect computer
programs from the originality measure for a student,
the above steps were repeated twice: once including
all computer programs available in the data, and the
second including only solutions that earned the maxi-
mum number of points possible.
Aggregate by Student. The z-scores were aggre-
gated according to their corresponding student to find
the average z-score per student. The sum of all points
earned by each student on every computer program
they submitted was also calculated, along with the
sum of all possible points each student could have
earned for each submitted program. With this infor-
mation, a programming performance per student was
derived by dividing the student’s total earned points
by the total maximum points the student could have
earned. We found that there was a total of 867 unique
A Code Distance Approach to Measure Originality in Computer Programming
543

students in the Java dataset. Among these students,
there were 816 students who had at least one submit-
ted program in which they scored the maximum pos-
sible points. This subset of students was used for the
second part of the Pearson correlation analysis.
3 ANALYSIS AND EVALUATION
In this section we present three different types of anal-
ysis and evaluation of our originality measure. First,
we show a negative correlation between our original-
ity measure and the scores reflecting students’ pro-
gramming ability. Second, we show a state-vs-trait
analysis that indicates that our originality measure
likely detects some student’s trait, and not some con-
cidental feature of our problem sets. Third, we show a
comparison between our automated originality mea-
sure and the intuitive judgments of expert program-
mers: here we observed very low agreement among
human judges, but much better agreement between
the automated system and the majority vote of human
judges.
Originality vs. Programming Performance. To
explore the relationship between our originality mea-
sure and the students’ academic performance, we
calculated the Pearson correlation between students’
originality and the average scores earned by the stu-
dents for all the problem they submitted (a very good
indicator of their coding performance in the course).
In our first analysis, all the data that was included af-
ter the initial screening (excluding non-parseable and
theoretical answers) was used in the correlation cal-
culation. This included a total of 867 students in the
Java dataset, and 160 students in the Python dataset.
The results are shown in Table 1 and Figure 1.
To better understand the effect of the inclusion of
programs that did not receive full score on the orig-
inality measure, we repeated the above analysis, but
using only the submissions that earned the maximum
score to calculate originality. Of course, the program-
ming performance score still included all the submis-
sions. We dropped 50 students from the Java dataset
and 10 students from the Python dataset because they
had no submissions that earned the maximum score.
Thus, we recalculated the Pearson correlation using
the originality measures and programming scores of
817 students from the Java dataset and 150 students
from the Python dataset. The results are in Table 1
and Figure 1.
From the table and figures, we can observe a sta-
tistically significant negative correlation between the
students’ originality measure and their coding perfor-
mance score. The negative correlation and statistical
significance persisted both with and without the in-
clusion of incorrect programs in the Java dataset, but
lost significance in the Python dataset after the exclu-
sion of the incorrect programs, possibly because of
the smaller sample size, or possibly because the mea-
sure might not be stable across coding languages – we
will discuss this topic further in the next two sections.
We suggest a couple of possible preliminary inter-
pretations for the negative correlation between origi-
nality and coding performance. On the one hand, it
could be explained by the time-constrained environ-
ment of proctored exams, where students that pursue
more original approaches in one question could have
less time overall to work on other questions. With
less time, students could perform worse on exams
overall compared to other students who submit more
canonical solutions that may be simpler and/or may
take less time to write. On the other hand, we also
observed that several of the more creative solutions,
although technically correct, were more complicated
and/or less elegant solutions, which makes us think
that the students writing them were indeed less pro-
ficient programmers. Both these interpretations have
practical pedagogical implications that warrant future
investigation.
State vs. Trait Analysis. We performed a state vs.
trait analysis (Baker, 2007) to determine whether our
originality measure for each student can be better pre-
dicted by state or trait explanations. State explana-
tions, which in our context are represented by the
specific coding problems, are ones that would sug-
gest that some aspect of a student’s current situation
guided the student to write the solution as they did.
Trait explanations, which are represented by the stu-
dents as nominal variables in our experiment, are ones
that would suggest that specific traits that a student
has (which could be originality) guided a student to
write the solution as they did. If our originality mea-
sure is better explained by traits than state, this would
be a good indication that our measure does indeed
quantitatively assess some trait of a student, and it
may suggest that originality could be one of the traits
it measures.
To create a regression model for the trait explana-
tions of our originality measure, we first consolidated
all results of the tree edit distance calculations to one
location. The total number of computer programs we
had after the preprocessing steps and distance calcu-
lations was 19,284. From here, we generated two
new datasets: one that treated students as nominal
variables and another that treated coding problems as
nominal variables. In both sets, the calculated origi-
CSEDU 2024 - 16th International Conference on Computer Supported Education
544
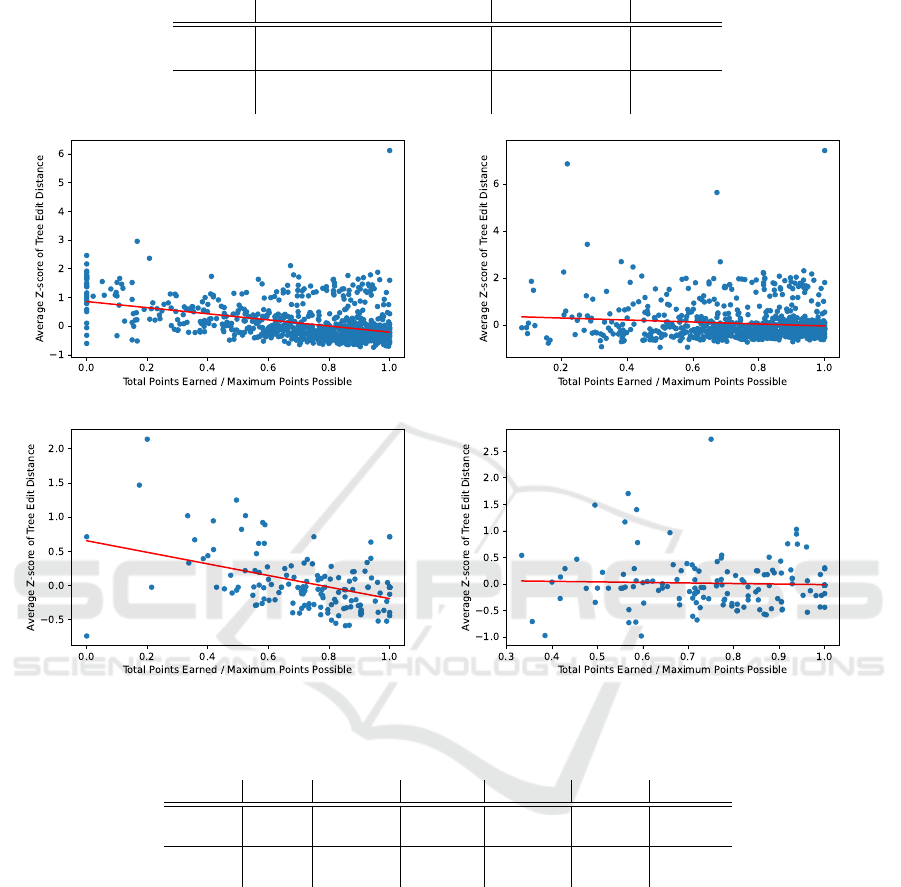
Table 1: Correlation between student originality and coding performance.
Dataset Inclusion Criteria Pearson Coeff. P-value
Java All Programs -0.42 3.44e-38
Only Full-scored Programs -0.11 2.45e-3
Python All Programs -0.43 1.28e-08
Only Full-scored Programs -0.04 0.66
Figure 1: Student originality vs coding performance. Top: Java dataset; bottom: Python dataset. Left: all programs; right:
only full-scored programs.
Table 2: State vs. trait analysis.
Dataset Model R
2
Adj. R
2
F-stat P-val BiC
Java State 1.32e-31 -5.27e-3 2.51e-29 1 55732.1
Trait 0.29 0.26 8.78 2.2e-16 56616.6
Python State 5.30e-31 -0.02 2.56e-29 1 5160.79
Trait 0.15 0.07 1.76 8.92e-8 5807.17
nality scores assigned to each computer program were
included.
In the student dataset, we created a column for ev-
ery unique student ID. If a program was associated
with one student ID, the column corresponding to the
student ID would be given the value of 1, and all other
student ID columns would be set to 0. Essentially, we
one-hot encoded for the student ID variable. The cod-
ing problem dataset was prepared in a similar fash-
ion. This resulted with the student dataset having a
total of 867 predictor columns for the 867 unique stu-
dents and the coding problem dataset having a total
of 101 predictor columns for the 101 unique coding
problems.
Once the datasets were ready, we trained two mul-
tiple regression models using the linear regression
models in R. The R
2
, adjusted R
2
, F-statistic, p-value,
and BiC values were calculated and are summarized
in Table 2.
In this experiment, we observed that the state ex-
planations model failed to fit the data with an ad-
justed R
2
value of -5.27e-3 and had a p-value of 1.
On the other hand, we found that the trait explana-
tions model fit the model better with an adjusted R
2
of
0.26 and a p-value of 2.2e-16. This indicates that the
trait explanations explained our proposed originality
measure better than state explanations and suggests
that the measure assessed a trait (or multiple traits) of
A Code Distance Approach to Measure Originality in Computer Programming
545

the students. Since originality could be one of these
traits, it would be interesting to further evaluate this
originality measure to examine whether it does indeed
measure a student’s originality or some other student
traits.
We repeated this analysis with the Python dataset,
and achieved similar results (Table 2): traits explained
originality better than state. This result suggests that
our originality measure is stable across different pro-
gramming languages.
Validation with Human Judges. For this particular
experiment, we wanted to demonstrate two particular
notions. First, that it is difficult for human judges to
consistently agree on assessing originality. This was
shown in previous works when originality experts had
trouble agreeing with each other on rating the orig-
inality of several Scratch programs (Kovalkov et al.,
2021b); thus we expect to find significant discrepancy
among human judges in our experiment as well. Sec-
ond, we want to check if our proposed automatic com-
putational method agrees (at least in part) with the (al-
beit imperfect) human judgement. If we can observe
a reasonable agreement with human judges, we be-
lieve that our proposed originality measure would be
promising for further experimentation in the future.
We randomly selected 30 separate pairs of pro-
grams, each pair from a different coding problem, and
organized them into a survey for human judges to read
and decide which of each pair was more creative. To
isolate correctness of the program from biasing the
judges, only programs that scored full points were
considered for random selection. 30 coding problems
were randomly selected from the 101 problems we
had in our data, and programs were separated into
three equally sized bins based on their z-score of the
distance measure. From those bins, one program was
randomly selected from the lower group and another
from the higher group to form the pair. Through ran-
dom selection from high and low clusters, we would
more likely select programs with more apparent dif-
ferences to potentially aid and simplify the human
judges’ decisions. If a program with the maximum or
minimum z-score of the coding problem group was
selected, we would randomly re-sample the cluster
again to avoid using an outlier in this experiment.
The chosen pairs of programs were copied onto a
Google Forms survey. Each pair was presented into
a separate section, and the coding question was listed
prior to the two programs. The judges were asked to
choose which student’s program solved the problem
more creatively. The judges were informed that only
programs that earned full points were displayed.
Three experienced human judges (the instructor of
the course, an undergraduate teaching assistant, and
an undergraduate computer science student) submit-
ted their originality rankings for each of the 30 pairs
of programs. We then calculated Fleiss’ kappa inter-
rater agreement coefficient to evaluate the agreement
level among our human raters. We did this using the
“irr” R package. Our findings of this analysis is ar-
ranged in Table 3. Such extremely low kappa value
shows that, even among humans, it is difficult to de-
termine which programs are more creative than oth-
ers. This is similar to the issues that were discussed in
Kovalkov et al.’s works where conclusive evidence of
predicting originality with machine learning models
could not be obtained due to human expert disagree-
ment (Kovalkov et al., 2021b).
In addition, we wanted to evaluate how well our
originality measure agreed with our human judges.
Instead of simply adding the measure’s ranking of
the same 30 program pairs to the previous analysis,
we deemed it more interesting to evaluate the agree-
ment between our proposed measure and the major-
ity vote of the three human judges. We aggregated
the rankings of all human graders to one choice for
every pair, and calculated Cohen’s kappa inter-rater
agreement coefficient to evaluate the level of agree-
ment between our originality measure and the human
judgement as represented by their majority vote. The
results of this analysis is also summarized in Table
3. As discussed in McHugh’s discussion of inter-rater
reliability, we can interpret the 0.533 kappa statistic
value as indicating moderate agreement between our
proposed originality measure and the majority vote
of human graders (McHugh, 2012). This is already
better than the inter-rater agreement found among the
human graders themselves, and this suggests that our
measure, while imperfect, has the potential to be a
good representation of a group’s opinion when rank-
ing programs in programming originality.
4 DISCUSSION AND
CONCLUSIONS
We observed that the originality measure was better
explained through trait explanations rather than state
explanations. In other words, our data showed that
the variation in the originality measure is better under-
stood through the differences in students’ characteris-
tics or traits rather than the differences among the quiz
coding problems that the students needed to solve.
While this finding is derived from a very high-level
view of state or trait explanations, we believe that our
proposed originality measure could indeed measure
student originality.
CSEDU 2024 - 16th International Conference on Computer Supported Education
546
Table 3: Kappa coefficients of agreement between human judges and originality measure.
Experiment Kappa Statistic P-value
Human vs. Human vs. Human -0.0714 0.498
Human (Majority) vs. Originality Measure 0.533 0.00341
Our results reinforced the notion that original-
ity, even in programming, is an intricate, complex
concept that is not easily agreed upon between two
or more humans. We observed that there was poor
agreement among three different human graders when
they were tasked with ranking one program of two
programs as more creative for 30 different pairs of
program code. However, when we transformed the
rankings of the three graders into one majority vote
ranking and compared that to the originality mea-
sure’s ranking, we found that there was a statisti-
cally significant, moderate agreement between the
two. Even though it is difficult for human graders
to agree among themselves, we demonstrated that the
originality measure has the potential to represent the
collective opinion of a group of graders through ma-
jority vote in ranking originality in programming.
When replicating our experiments on the Python
data, we observed results similar to those from the
Java data. We still found that the trait explanations
better explained our originality measure compared to
the state explanations. This provides some support
to the stability of our originality measure across pro-
gramming languages.
Overall, our results indicate that our originality
measure, which uses abstract syntax trees and tree
edit distance, is a good candidate for computationally
assessing a student’s originality through their code.
While further experimentation is needed to bolster the
measure’s validity of accurately assessing originality,
this study acts as a starting point for computational
originality research to start conducting extensive stud-
ies on the use of abstract syntax trees and tree edit dis-
tances as a standardized method of assessing student
originality in the classroom. Our results also suggest
that this study can be replicated on datasets of differ-
ent coding languages as well. If future work continues
to show promise for our proposed measure, it could
help instructors better adapt their computing courses
to their students’ originality levels.
5 LIMITATIONS AND FUTURE
WORK
A limitation of our study is that our data was taken
from two university courses’ quizzes. Replicating
this study with data from either other courses of dif-
ferent education levels, or simply just from different
contexts (such as homework assignments, which tend
to have longer code submissions) will be crucial in
showing that this computational method is trustwor-
thy and generalizable.
Another limitation is the possibility that our mea-
sure could simply assign higher values to programs
that are longer and less efficient than others. To check
that this was not necessarily the case, we found in our
data examples of programs that, despite having the
same length, resulted in largely different originality
scores. Despite this reassuring finding, we did not
completely rule out the possibility that our measure
may be heavily influenced by the length of code. Fu-
ture refinements can attempt to penalize longer code
to reduce the effect of length on the originality mea-
sure.
In the future, it would be interesting to explore
clustering of the data based on the originality mea-
sure and other variables such as quiz scores. By clus-
tering the data, we might be able to observe patterns
of more “canonical” versus “original” code, and pos-
sibly detect different structures of originality in dif-
ferent groups of students.
An important experiment that should follow up on
this study is further validation of our originality mea-
sure. There should be a larger pool of human judges
than we had in this study, and a more complex ranking
of multiple programs should be conducted, instead of
our simple ranking between two programs at a time.
Even though it has been a challenge to do so in the
past due to disagreement among human graders (Ko-
valkov et al., 2021b; Kovalkov et al., 2021a), it will
still be necessary to complete these studies in order
for the proposed computational method to be more
dependable as a measure.
REFERENCES
Anthony, K. and Frazier, W. (2009). Teaching students to
create undiscovered ideas. Science Scope.
Baker, R. (2007). Is gaming the system state-or-trait? edu-
cational data mining through the multi-contextual ap-
plication of a validated behavioral model.
Beghetto, R. A. (2010). Creativity in the Classroom,
page 447–464. Cambridge Handbooks in Psychology.
Cambridge University Press.
Davies, D., Jindal-Snape, D., Collier, C., Digby, R., Hay, P.,
and Howe, A. (2013). Creative learning environments
A Code Distance Approach to Measure Originality in Computer Programming
547

in education—a systematic literature review. Thinking
Skills and Creativity, 8:80–91.
Donovan, L., Green, T. D., and Mason, C. (2014). Exam-
ining the 21st century classroom: Developing an in-
novation configuration map. Journal of Educational
Computing Research, 50(2):161–178.
Guilford, J. P. (1950). Creativity. American Psychologist,
5:444–454.
Hershkovitz, A., Sitman, R., Israel-Fishelson, R., Egu
´
ıluz,
A., Garaizar, P., and Guenaga, M. (2019). Creativity in
the acquisition of computational thinking. Interactive
Learning Environments, 27(5-6):628–644.
Israel-Fishelson, R., Hershkovitz, A., Egu
´
ıluz, A., Garaizar,
P., and Guenaga, M. (2021). The associations between
computational thinking and creativity: The role of per-
sonal characteristics. Journal of Educational Comput-
ing Research, 58(8):1415–1447.
Kaufman, J. C. and Beghetto, R. A. (2009). Beyond big
and little: The four c model of creativity. Review of
General Psychology, 13(1):1–12.
Kilgour, M. (2006). Improving the creative process: Anal-
ysis of the effects of divergent thinking techniques
and domain specific knowledge on creativity. Inter-
national Journal of Business and Society, 7.
Kong, S.-C. (2019). Components and Methods of Evalu-
ating Computational Thinking for Fostering Creative
Problem-Solvers in Senior Primary School Education,
pages 119–141. Springer Singapore, Singapore.
Kovalkov, A., Paassen, B., Segal, A., Gal, K., and Pinkwart,
N. (2021a). Modeling creativity in visual program-
ming: From theory to practice. In Proceedings of the
14th International Conference on Educational Data
Mining, EDM 2021, virtual, June 29 - July 2, 2021.
International Educational Data Mining Society.
Kovalkov, A., Paaßen, B., Segal, A., Pinkwart, N., and
Gal, K. (2021b). Automatic creativity measurement
in scratch programs across modalities. IEEE Transac-
tions on Learning Technologies, 14(6):740–753.
Kupers, E., Lehmann-Wermser, A., McPherson, G., and van
Geert, P. (2019). Children’s creativity: A theoretical
framework and systematic review. Review of Educa-
tional Research, 89(1):93–124.
Lau, K. W. and Lee, P. Y. (2015). The use of virtual reality
for creating unusual environmental stimulation to mo-
tivate students to explore creative ideas. Interactive
Learning Environments, 23(1):3–18.
Liu, M.-C. and Lu, H.-F. (2002). A study on the creative
problem-solving process in computer programming.
Manske, S. and Hoppe, H. U. (2014). Automated indicators
to assess the creativity of solutions to programming
exercises. In 2014 IEEE 14th International Confer-
ence on Advanced Learning Technologies, pages 497–
501.
Martindale, C. (1989). Personality, Situation, and Creativ-
ity, pages 211–232. Springer US, Boston, MA.
McHugh, M. L. (2012). Interrater reliability: the kappa
statistic. Biochem Med (Zagreb), 22(3):276–282.
Parsons, M. J. (1971). White and black and creativity.
British Journal of Educational Studies, 19(1):5–16.
Romeike, R. (2007). Three drivers for creativity in com-
puter science education.
Said Metwaly, S., Van den Noortgate, W., and Kyndt, E.
(2017). Methodological issues in measuring creativ-
ity: A systematic literature review. Creativity Theories
– Research – Applications, 4.
Schwarz, S., Pawlik, M., and Augsten, N. (2017). A new
perspective on the tree edit distance. In Beecks, C.,
Borutta, F., Kr
¨
oger, P., and Seidl, T., editors, Similar-
ity Search and Applications, pages 156–170, Cham.
Springer International Publishing.
Seo, Y.-H. and Kim, J.-H. (2016). Analyzing the effects
of coding education through pair programming for the
computational thinking and creativity of elementary
school students. Indian Journal of Science and Tech-
nology, 9.
Sidorov, G., G
´
omez-Adorno, H., Markov, I., Pinto, D., and
Loya, N. (2015). Computing text similarity using
tree edit distance. In 2015 Annual Conference of the
North American Fuzzy Information Processing Soci-
ety (NAFIPS) held jointly with 2015 5th World Con-
ference on Soft Computing (WConSC), pages 1–4.
Vygotsky, L. S. (2004). Imagination and creativity in child-
hood. Journal of Russian & East European Psychol-
ogy, 42(1):7–97.
Yadav, A. and Cooper, S. (2017). Fostering creativity
through computing. Commun. ACM, 60(2):31–33.
Zhang, K. and Shasha, D. (1989). Simple fast algorithms for
the editing distance between trees and related prob-
lems. SIAM Journal on Computing, 18(6):1245–1262.
CSEDU 2024 - 16th International Conference on Computer Supported Education
548
