
How Should I Measure Vehicle Deformation Depth?
Pavlína Moravcová
1,2 a
, Robert Zůvala
1b
and Kateřina Bucsuházy
1,2 c
1
Transport Research Centre, Brno, Czech Republic
2
Institute of Forensic Engineering, Brno University of Technology, Brno, Czech Republic
Keywords: Deformation Depth, Profile Deformation, Deformation Energy, EES, Equal Spacing, non-Equal Spacing,
Vehicle Accident, Vehicle Analysis, Impact, Vehicle.
Abstract: Determination of deformation energy is an integral part of the accident analysis. Deformation energy could
be expressed by parameter EES, which could directly enter the calculation or serve as a control parameter.
To determine the EES parameter, it is necessary to know the depth of plastic deformation. There is a lack of
standardization in the process of deformation profile determination, because several mathematical models
focus on the deformation profile according to established procedures, or the deformation depth is measured
along the entire width of the deformation using evenly spaced points. Equal spacing of measurement points
can be an unnecessary restriction when documenting traffic accident on accident scene. In the presented
article, the differences between equal and non-equal spacing of measurement points and the subsequent
influence on the EES calculation are analyzed. Statistical analysis confirmed that equal non-equal distribution
of measurement points does not cause significant differences in the determined EES value, so equal spacing
is not required. The non-equal spacing could better approximate the deformation profile including subsequent
calculation of the EES value, when following certain rules.
1 INTRODUCTION
The crash analysis requires valid and precise data
including deformation depth. Vehicle damage can be
documented by several methods such as 2D
measurement methods (photo documentation with
measuring rods etc.) or 3D measurement methods
(total station, photogrammetry, or 3D scanning). The
purpose of the vehicle damage documentation needs
to be considered to correctly select the most
proprietary method and means with respect to their
benefits and limitations (Bucsuházy et al., 2023;
Topolšek et al., 2019).
The documentation process is influenced by
various factors including the methods or means used,
weather conditions, etc. The method usage should
consider not only different conditions but also the
crash type or damage extent (Hoxha et al., 2017). The
damage profile serves as a basis for determining
deformation energy, respectively energy equivalent
speed (EES). EES express the deformation energy
absorbed by a vehicle during a crash (e.g. Riviere et
a
https://orcid.org/0000-0002-9005-703X
b
https://orcid.org/0000-0003-2038-7292
c
https://orcid.org/0000-0003-1247-6148
al., 2006), so EES is manifested in a form of plastic
energy (Zeidler et al., 1985; Appel et al., 2002; Vangi,
2020). Therefore the EES value is usually not
identical as vehicle impact speed. The EES and
impact speed could be theoretically similar if the
vehicle collided with a rigid non-deformable barrier
and only plastic deformation occurred (e.g.
Bucsuházy et al., 2023, Vangi, 2020, Daily and
Shigemura, 2005). The EES value serves as a control
parameter when analysing crash or could directly
enter calculation e.g. using an Energy ring or Energy
conservation law (Bradáč, 1999; Semela, 2014; Burg
and Moser, 2014, 2017; Bucsuházy et al., 2023).
When documenting a real vehicle accident, the
question of how to correctly measure the deformation
profile arises to accurately reflect the damage. The
number of measuring points when analysing
deformation depth needs to reflect not only the
deformation extent but also used calculation method
(Nordhagen et al., 2006). When using the CRASH3
algorithm, six equally distributed measuring points
along the entire length of the vehicle's deformation
are widely used in forensic practice (Daily,
Moravcová, P., Z˚uvala, R. and Bucsuházy, K.
How Should I Measure Vehicle Deformation Depth?.
DOI: 10.5220/0012632300003702
Paper published under CC license (CC BY-NC-ND 4.0)
In Proceedings of the 10th International Conference on Vehicle Technology and Intelligent Transport Systems (VEHITS 2024), pages 125-133
ISBN: 978-989-758-703-0; ISSN: 2184-495X
Proceedings Copyright © 2024 by SCITEPRESS – Science and Technology Publications, Lda.
125

2005,2006; Burg and Moser, 2014, Vangi 2020;
Struble, 2020; Bucsuházy et al., 2023). Even though
equal spacing is not required, the calculation process
is simpler, so some calculation software assume equal
spacing. In practice, uniform spacing could be an
unnecessary restriction for crash investigators when
documenting real traffic accidents (Struble, 2020;
Vomhof, 2016). If the maximum deformation is not
measured, the deformation profile can be distorted,
which could influence the resulting analysis. Even
though the maximum crush depth does not coincide
with a crush measurement, it should be located and
measured (Daily, 2015).
Singh (2005) analyzed how equally spaced
measuring points and their number affect stiffness
coefficients used to determine EES value using the
CRASH3 algorithm. The author also highlighted that
each analyzed traffic accident required individual
expert judgment. Moravcová et al. (2024) analysed
selected variables influencing EES calculation
including number of measurement points, but only
equal spacing was analysed. Vomhof (2016) on some
case studies demonstrated the advantages and
limitations of equally and non-equally distributed
measuring points using the Force Balance calculation
tool included in 4N6XPRT StifCalcs. Using a strictly
equal measurement process could in some cases lead
to significant deformation profile loss.
Despite the growing trend of using EDR, it is still
necessary to validate the calculation methodology
and crash reconstruction. The vehicle fleet's age does
not allow EDR data to be used when analyzing all
crashes until EDR technology becomes sufficiently
widespread. EDR data can be beneficial for crash
reconstruction and significantly reduce subjective
errors such as errors arising when documenting
a crash at a crash scene. When using EDR data for
crash reconstruction, these still need to be verified
and subsequently analyzed. Some crash types or
conditions could lead to inaccuracy of the data or the
possibility of obtaining the data may be also limited
due to the collision character (such as significant
deformation, control unit damage, vehicle skid before
the crash, lower impact speed, significant mass
difference etc.) (Struble, 2020; Nouzovský et al.,
2021; Coyne, 2010; Bortles, 2016; Bohm, 2020).
Even though some of the previous papers
demonstrated in selected case studies differences of
equal and non-equal spacing of measurement points,
the authors mostly do not further address the question
of what effect the measurement process has on the
resulting EES calculation. To fill this gap, this paper
aims to analyse potential differences in the calculated
EES when using equal and non-equal spacing. With
regard to the difficulties associated with the equal
spacing of measuring points when documenting
vehicle damage directly at the accident scene, this
article aims to analyze whether an even distribution
of measuring points is necessary to be required.
2 METHODS
For the EES calculation, the CRASH3 algorithm will
be used as one of the most frequently used calculation
methods (Mrowicki et al., 2020). The crush profile
will be determined using six measurement points as it
is widely used in forensic practice when using the
CRASH3 algorithm (Daily, 2005,2006; Burg and
Moser, 2014, Vangi 2020; Struble, 2020; Bucsuházy
et al., 2023). The effect of measurement point number
on the resulting EES value is not the subject of this
study.
2.1 Data Set
The used dataset contains 28 vehicles (see Table 1
and Table 2) with different stiffness characteristics,
different classes, and manufactured years (model
years 1994 to 2019). For the purpose of the study
were used real traffic accident data collected by the
Czech In-Depth Investigation team (project CzIDAS
conducted by Transport Research Centre) and also
crash tests data conducted by IFE BUT. The crash
overlap varied, and so did the resulting crash
deformation extent. The vehicles in the dataset were
Table 1: Dataset – vehicle characteristics (Frontal Impact).
Vehicle Weight [kg] Year Offset [%]
Frontal Impact
Skoda Fabia I
1000 2000 30
Skoda Fabia III
1100 2015 30
Opel Astra
950 1991 100
Mitsubishi Carisma
1100 1995 100
VW Bora
1555 2000 80
Skoda Octavia I
1364 2004 50
Skoda Octavia I
1365 2011 50
For
d
Focus
1352 2007 30
Skoda Fabia
1490 2006 100
Skoda Octavia I
1305 2011 80
Honda Civic
1170 1996 100
Skoda Felicia
892 1994 100
Skoda Rapi
d
1294 2016 100
Skoda Superb III
1476 2016 80
Subaru Foreste
r
1424 2002 45
Toyota Corrola
1003 1989 100
Opel Omega
1655 1998 100
multipla č.
1337 2000 100
Karo
q
1661 2017 100
Škoda Fabia
1058 2004 100
VEHITS 2024 - 10th International Conference on Vehicle Technology and Intelligent Transport Systems
126
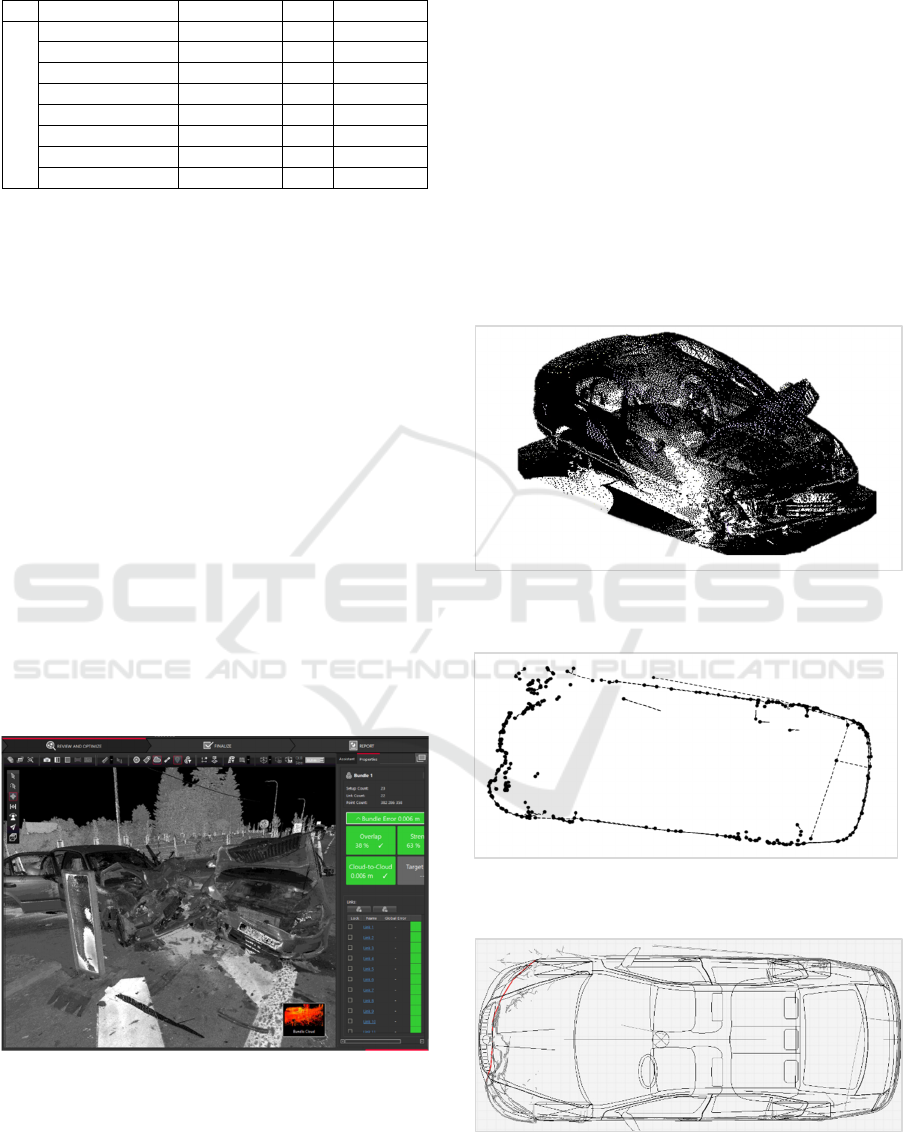
Table 2: Dataset – vehicle characteristics (Side Impact).
Vehicle Weight [kg] Year Offset [%]
Side Impact
Skoda Fabia III
1100 2015 50
Skoda Superb III
1470 2015 35
Skoda Karo
q
1658 2019 25
Peugeo
t
207
1324 2010 40
Skoda Rapi
d
1294 2016 45
Skoda Felicia
931 1994 60
Chrysle
r
Voyage
r
1762 1999 50
Kodia
q
1879 2016 40
subsequently divided based on the damage type
(frontal and side crash). Twenty vehicles were
damaged in the front part (full-overlap and damage
off-set) and eight vehicles were damaged on the left
or right side of the vehicle in the area between the
A to C pillar. Analysed vehicles were not equipped
with EDR.
2.2 Vehicle Profile Documentation
The vehicle damage was documented using 3D
scanning - Faro Focus 120 laser scanner or a Leica
RTC360 laser scanner - as the most precise method
which allows efficient, accurate, and quick data
collection. Besides the conventional methods for
measuring vehicle damage (such as photo-
documentation of damage with a measuring rod),
laser scanning allows also variation in post-process
measurement (Morales et al.., 2015; Coleman et al.,
2015, Tandy et al., 2012, Grimes et al., 2018; Kamnik
et al., 2020; Kamnik et al., 2022).
The processing procedure will be demonstrated
by the example from a real traffic accident.
Figure 1: Point cloud processing of a nighttime traffic
accident.
The postprocessing was realised using Geomagic
Control software. Using 3D model obtained from
laser scanning allows to select a 2D cut at a defined
height. The cut for frontal damage was determined at
the bumper height (respectively height of the vehicle
impact bar) and for side damage at the collision
opponent's bumper height (respectively height of the
collision opponent's impact bar).
Before measuring the deformation profile, it is
necessary to determine the deformation width -
considering the character of the deformation, the
width was defined either from the edge to the edge of
the vehicle, from the edge of the vehicle to the end of
the deformation or from the beginning of the
deformation to the end of the deformation. The
vehicle deformation profile was determined using six
measuring points (5 zones). When using equal
spacing of measuring points, the width of the
deformation was subdivided by the number of zones.
Figure 2: Processing a scan of the Skoda Octavia vehicle in
the Geomagic Control software.
Figure 3: 2D cut at the height of Skoda Octavia vehicle
bumper.
Figure 4: Comparison of a 2D cut of a damaged vehicle and
an undamaged Skoda Octavia vehicle model.
How Should I Measure Vehicle Deformation Depth?
127
When using a non-equal spacing of measuring points,
the measuring points were considered at deflection
points, i.e. points at which the deformation profile
significantly changes. Such spacing allows us to
accurately approximate the deformation profile incl.
determining the maximum deformation.
Figure 5: Measuring the depth of deformation of the Skoda
Octavia vehicle.
3 RESULTS
The paper aims to analyse potential differences in the
calculated EES value when using equal and non-equal
measuring points for crush measurement.
For the comparison were used differences in the
calculated EES when using equal and non-equal
measuring points for crush measurement and
analysed EES value. Analyzed EES value was
determined based on vehicle crash tests (measured
values in crash tests) and using a combination of
methods for EES determination (Triangle method,
Comparison method, CRASH3 software using
various number of measuring points, Energy grid, or
Estimation by a Professional/Expert – see e,g,
Campbell, 1974; Shaper, 1981; Bradáč, 1999; Vangi,
2020, Bucsuházy et al., 2023).
EES when using equal and non-equal measuring
points for deformation profile determination was
calculated using CRASH3 software for frontal
impacts. Determination of the vehicle side EES value
was based on Newton's third law (Use of the Law of
Action and Reaction) with the known EES value of
the collision opponent. The deformation depth is also
part of this calculation.
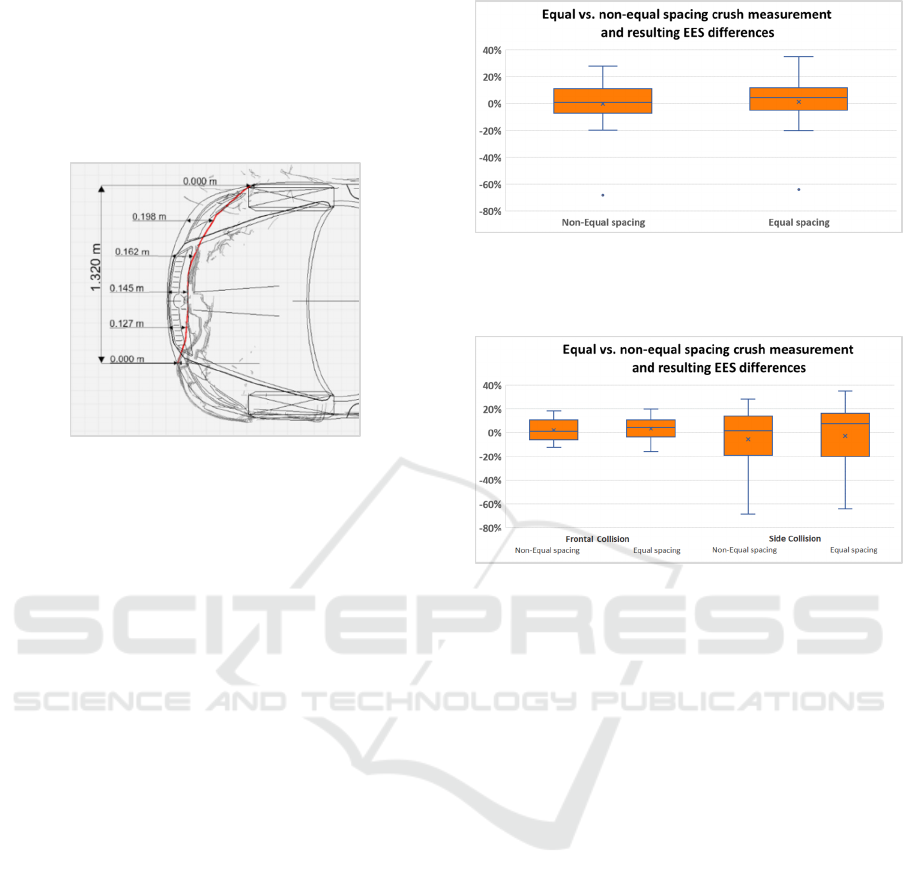
The differences among calculated EES when
using equal and non-equal measuring points for crush
measurement and analyzed EES value are illustrated
in the following figures (see figure 6 and 7).
Figure 6: The difference in the analyzed and calculated EES
value using equal and non-equal spacing crush
measurement.
Figure 7: The difference in the analyzed and calculated EES
value using equal and non-equal spacing crush
measurement – frontal and side collision.
Significant outliers (especially in the case of
a side impact) illustrated in figures 6 and 7 are caused
by the diversity of the condition of vehicles in the
dataset (such as significant corrosion). This incorrect
EES estimation was realized when calculating the
EES of the Skoda Felicia vehicle, whose load-bearing
parts of the body incl. impact bar were subjected to
a high degree of corrosion. The calculation does not
consider such a significant degree of corrosion, which
can lead to an incorrect determination of the EES
value. Calculated EES value does not correspond
with EES value obtained based on the vehicle crash
test. High deviation can be also caused by
an inaccurate determination of the opponent's EES
value, which could negatively affect the subject
vehicle EES calculation. The sensitivity of the EES
opponent's EES value is not subject of this study.
There were also higher deviation in the EES
calculation of the Skoda Superb III vehicle (side
collision), where the EES value was underestimated
by 35% when using equal spacing and by 28% when
using non-equal spacing. The underestimation of EES
when using the equal distribution of the measuring
points was mainly influenced by the fact that the
measuring points did not coincide with a maximum
VEHITS 2024 - 10th International Conference on Vehicle Technology and Intelligent Transport Systems
128
deformation depth. The EES calculation for side
collision is very sensitive to parameter average crush
depth.
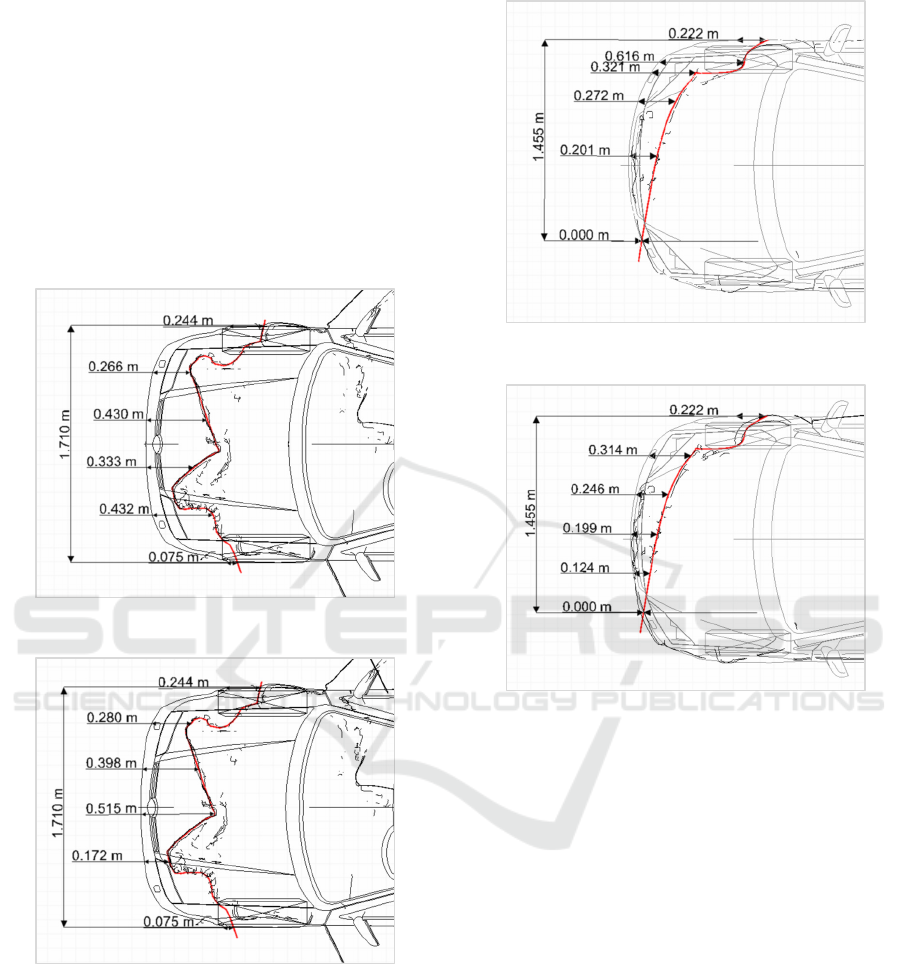
A slight overestimation of the EES value was
detected also when analyzing VW Bora (frontal
collision) - by 16% when using equal spacing (see
figure 8). While in the case of non-equal spacing, the
measuring points (see figure 9) are focused mainly in
the region of the impact bar, the equal spacing
includes the maximum deformation depth outside the
impact bar, which may subsequently affect the EES
calculation.
Figure 8: VW Bora – equal spacing.
Figure 9: VW Bora – non-equal spacing.
An analogous problem led to slight inaccuracies
in the EES calculation of the Ford Focus vehicle when
using non-equal spacing (overestimation of EES by
13%). The maximum deformation depth when using
non-equal spacing was measured outside the impact
bar region (see figure 10). When using equal spacing,
the EES value was determined correctly – in this case
study the maximum deformation depth measured
coincided with the measuring points in the region of
impact bar (see figure 11).
Figure 10: Ford Focus – non-equal spacing.
Figure 11: Ford Focus – equal spacing.
Based on the case studies (VW Bora and Ford
Focus) the question of using deformation width only
in the region of impact bar arises. However, the
analysis of deformation width variation is not the
subject of the study. Measuring of the maximum
deformation depth should consider the location of the
impact bar considering the stiffness of the vehicle and
its parts.
Overestimation or underestimation of EES value
can also be caused by using the inappropriate
substitute vehicle (vehicle with known EES value or
stiffness) from the crash test database, which is used
to determine the stiffness characteristic. The most
frequently used and publicly available crash test
databases (NHTSA, IIHS) contained new vehicles.
Even if a parametrically similar substitute vehicle is
found in the crash test database, in case of an
extensive corrosion of the vehicle in question is not
possible to create appropriate stiffness characteristics
(as could be seen from the already mentioned Skoda
Felicia or the analyzed Toyota Corolla where the
calculated EES values do not correspond with the
How Should I Measure Vehicle Deformation Depth?
129
EES values obtained based on measured data from
vehicle crash tests).
To analyse potential differences in the calculated
EES value when using equal and non-equal
measuring points for crush measurement, the
obtained values were statistically tested. Mann-
Whitney Test confirmed that the differences between
calculated EES when using equal and non-equal
spacing of measuring points are not statistically
significant. Similarities in the resulting EES
differences are illustrated also by box plots on the
figures (see figure 6 and 7). The differences are not
statistically significant even when considering
separately frontal and side impacts (see figure 7).
The equal spacing shows slightly higher
variability in resulting EES, but the difference in the
median values is approx. 2 km/h which is not
significant especially considering the fact that the
EES value is determined in technically acceptable
range frequently with e.g. 5% tolerance. So the
median difference and also 25. and 75. Percentile
values are in the tolerance with respect to the
inaccuracy/technically acceptable tolerance of the
EES determination.
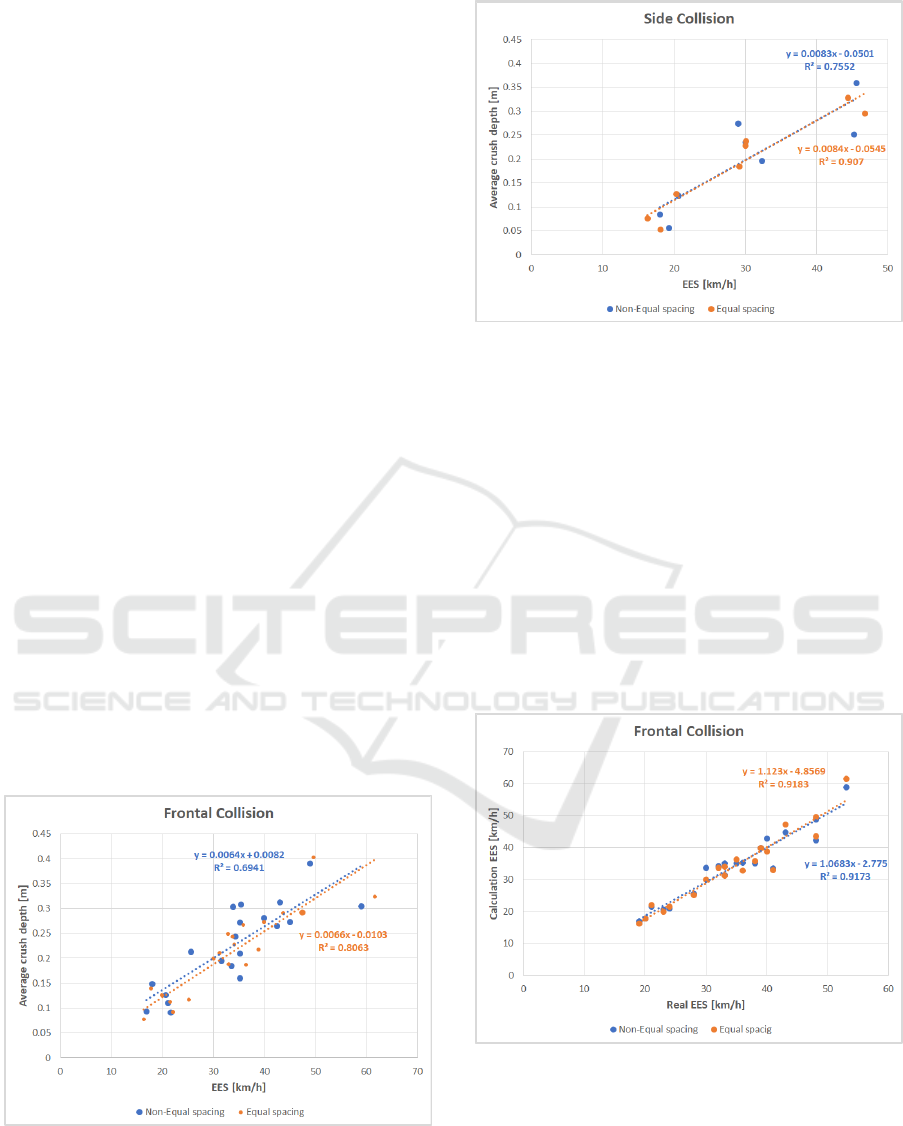
Figure 12 and 13 demonstrates the influence of
the average crush depth on the resulting EES value
when using equal and non-equal spacing. The
resulting EES obviously increases with the higher
average deformation depth. A trend line better fits the
data when using equally spaced measuring points.
The data visualisation confirmed negligible
difference when using equal and non-equal crush
profile measurement for both frontal and side
impacts/damage.
Figure 12: Dependence of the average deformation depth
on the resulting EES value in frontal impacts.
Figure 13: Dependence of the average deformation depth
on the resulting EES value in side impacts.
The correlation between measured and calculated
EES values when using equal and non-equal spacing
was also analyzed.
For frontal and also side impacts are the
correlation coefficients almost identical for equal and
non-equal spacing. For frontal impacts (figure 14)
reached 0.958 for both types of spacing. For side
impacts (figure 15) are correlation coefficients lower
than for frontal impact (0.7 for equal spacing and 0.68
for non-equal spacing, so the difference is negligible).
The lower correlation coefficient and also lower
reliability of trendlines are mainly influenced by the
limited number of side impacts in analyzed dataset.
Figure 14: Correlation between measured and calculated
EES values - frontal impact.
If the deformation profile character is
significantly heterogeneous (does not have a simple
geometry) it seems more at deflection points (where
the deformation profile changes), so the measured
VEHITS 2024 - 10th International Conference on Vehicle Technology and Intelligent Transport Systems
130
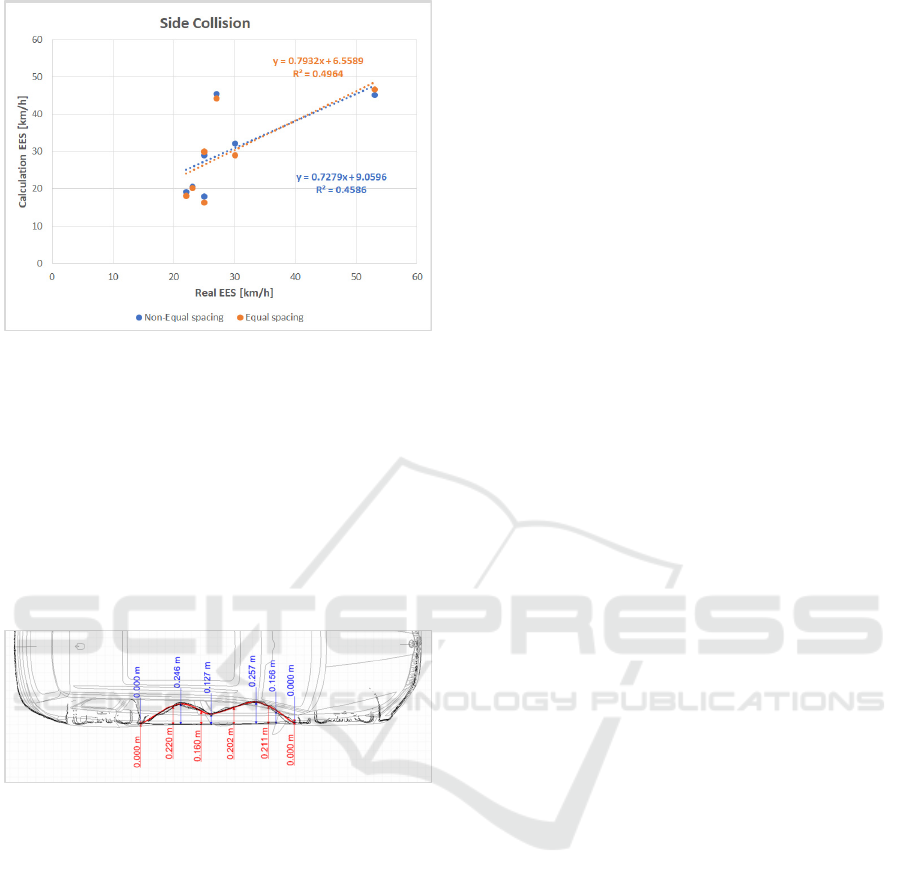
Figure 15: Correlation between measured and calculated
EES values - side impact.
profile more corresponds with the real deformation
profile extent. In the case of equal spacing, these
points may be omitted (ie, for example, the maximum
deformation depth), which may lead to an
underestimation of the calculated EES value. This can
be illustrated by figure 16, where equal spacing is
marked in red and non-equal spacing in blue.
The procedure of non-equal spacing seems more
feasible even in real conditions.
Figure 16: Measurement crush depth – equal and non-equal
spacing.
5 DISCUSSIONS
The paper aims to analyze differences in EES
calculation when using non-equal and equal spacing
of measurement points for the deformation profile
determination. For the purpose of the analysis dataset
used includes 28 vehicles from real traffic accidents
and crash tests. The EES calculation was conducted
using CRASH3 algorithm. The deformation profile
was analyzed using 6 measuring points, which is
common in forensic practice (Daily, 2005,2006; Burg
and Moser, 2014, Vangi 2020; Struble, 2020;
Bucsuházy et al., 2023).
Equal spacing is widely used when analyzing
deformation in laboratory conditions (crash tests) or
when postprocessing the data obtained from the
accident scene. But it is necessary to highlight that
equal spacing deformation profile measurement
could be difficult in the practise when documenting
real crashes as described e.g by Struble (2020). Crash
tests into rigid non-deformable barrier lead to
an almost rectangular deformation profile, so equal
spacing is suitable.
However, in real accidents (especially narrow
obstacle impacts, crashes with overlap, etc.) is the
resulting deformation rectangular only rarely. In most
cases, the resulting deformation profile is irregular.
Using strictly equal spacing in case of an irregular
deformation profile can cause the maximum
deformation depth to be missed (not measured).
Demonstrated case studies shows that non-equal
spacing of measurement points can lead to more
accurate EES calculation, which confirms the
conclusions described by Vomhof (2016). But certain
rules need to be followed. When using non-equal
spacing and deformation width from edge to edge of
the vehicle, the first and last measuring points should
be on the vehicle edge, but the other measuring points
should be concentrated into the region of impact bar.
Positioned of measuring points outside the impact bar
leads to incorrect calculation of the EES value.
With regard to the difficulties associated with the
equal spacing of measuring points when documenting
vehicle damage directly at the accident scene, this
article aims to confirmed that equally spacing is not
required (which was shows using statistical analysis
of EES calculated based on deformation profile
determined using equal and also non-equal spacing of
measurement points).
Study faced several limitations:
- Dataset included only 8 side impacts, which
is insufficient for detailed statistical analysis.
The increase of the vehicles in the dataset
could increase the precision of obtained
results.
- For the deformation profile determination
was used six measurement points – which is
widely used in forensic practise especially
using CRASH3 algorithm. The increase of
measurement points should lead to better
approximation of the deformation profile.
The analysis of measurement point variation
is not the subject of the study and should be
further analysed.
- Calculated EES was compared with analysed
EES obtained based on vehicle crash tests
(measured values in crash tests) and using
a combination of methods for EES
How Should I Measure Vehicle Deformation Depth?
131

determination. The EES is determined in
technically acceptable range.
- Resulting EES value could be significantly
affected by the selected substitute from the
crash test database. Using of CRASH3
algorithm faced also limitations related to
assumption of linear stiffness characteristics.
Deformation profile is not the only factor affecting
the EES calculation. The EES calculation is influenced
by various factors such as mentioned vehicle stiffness,
conditions of the vehicle, used method and means etc.).
The further research should be focused on the
comprehensive analysis of more factors which enters
the calculation (such as the number of measurement
points, deformation width etc.).
6 CONCLUSION
The accident analysis i.e. reconstruction approach
works backward from the evidence of the crash
investigation which includes vehicle damage
analysis. The determination of deformation energy
which could be expressed by the EES parameter is
influenced by the accuracy of input parameters
including the deformation depth. While documenting
traffic accidents at the accident scene, the conditions
and time restrictions could influence the precision of
the obtained data. Equal spacing of measurement
points can be an unnecessary restriction and, in some
cases, can also lead to inaccuracy in the resulting
analysis. Statistical analysis confirmed that equal non-
equal distribution of measurement points does not
cause significant deviations in the determined EES
value, so equal spacing is not required. The determined
EES values are within the technically accepted range.
The non-equal spacing could better approximate the
deformation profile incl. subsequent calculation of the
EES value, when following certain rules.
ACKNOWLEDGEMENTS
This article was produced with the financial support
of the Ministry of Transport within the program of
long-term conceptual development of research
organizations.
REFERENCES
Appel, H., Krabbel, G. und Vetter, D. (2002).
Unfallforschung, Unfallmechanik und Unfall-
rekonstruktion. 2. Aufl. 2002. ISBN 978-3-528-04123-
6.
Böhm, K., Kubjatko T., Paula D and Schweige H. (2020).
New developments on EDR (Event Data Recorder) for
automated vehicles. 140 - 146. DOI:
https://doi.org/10.1515/eng-2020-0007.
Bortles, W., Biever, W., Carter, N., and Smith, C. (2016).
A Compendium of Passenger Vehicle Event Data
Recorder Literature and Analysis of Validation Studies.
SAE Technical Paper 2016-01-1497. DOI:
https://doi.org/10.4271/2016-01-1497.
Bradáč, A. a kol. (1999). Soudní inženýrství. 1. vydání.
Brno: Akademické nakladatelství CERM s.r.o., 725 s.
ISBN 80-7204-133-9.
Bucsuházy, K. et al. (2023). VEHICLE CRUSH
INVESTIGATION: A Guidebook to Documentation and
Analysis. Transport Research Centre, Brno University
of Technology – Institute of Forensic Engineering,
Brno, Czech Republic. 978-80-88655-02-2.
Burg, H., Moser, A. (2014). Handbook of Accident
Reconstruction. Accident invegastion, vehicle dynamic,
simulation. 1nd Edition. ISBN 9781492328421.
Burg, H., Moser, A. (2017). Handbuch Verkehrsunfall-
rekonstruktion: Unfallaufnahme, Fahrdynamik,
Simulation. DOI: 10.1007/978-3-658-16143-9.
Campbell, K. L. Energy Basis for Collision Severity.
Online. Warrendale: SAE International, 1974.
Available from: https://doi.org/10.4271/740565. [cit.
2023-11-16].
Coleman, C., Tandy, D., Colborn, J. and Ault, N. (2015).
Applying Camera Matching Methods to Laser Scanned
Three Dimensional Scene Data with Comparisons to
Other Methods (No. 2015-01-1416). SAE Technical
Paper, 2015. Online. Available from:
https://doi.org/10.4271/2015-01-1416. [cit. 2022-12-06].
Coyne, M. Spek, A., Reynolds, J., van Essen, J., Bot, H.
(2010) Vehicle Fault Memory Data Extraction and
Interpretation. 19. EVU Conference, Prague
Daily, J., Shigemura N. (2005). Damage Profile Measuring
Procedures, prezentation, online, Available from:
http://www.jhscientific.com/downloads/DamageProfil
eMeasuringProcedures.pdf. [cit. 2023-04-01]
Daily, J., Strickland, R. and Daily, J. (2006) Crush Analysis
with Under-rides and the Coefficient of Restitution:
Institute of Police Technology and Management’s, 24th
Annual Special Problems in Traffic Crash
Reconstruction. 2006, s. 1-77.
Grimes, C., Roescher, T., Suway, J.A., and Welcher, J.
(2018). Comparing the Accuracy of Image Based
Scanning Techniques to Laser Scanners, SAE
Technical Paper 2018-01-0525. DOI:10.4271/2018-01-
0525.
Hoxha, G., Shala, A., Likaj, R. (2017). Vehicle Speed
Determination in Case of Road Crash by Software
Method and Comparing of Results with the
Mathematical Model. Journal of Mechanical
Engineering, 67(2), 51–60. DOI:10.1515/scjme-2017-
0017.
Kamnik, R., Nekrep Perc, M. and Topolšek, D. (2020).
Using the scanners and drone for comparison of point
VEHITS 2024 - 10th International Conference on Vehicle Technology and Intelligent Transport Systems
132

cloud accuracy at traffic accident analysis. Online.
Accident Analysis & Prevention. 2020, Vol. 135. ISSN
00014575. Available from:
https://doi.org/10.1016/j.aap.2019.105391. [cit. 2023-
04-03].
Kamnik, R., Topolšek, D. and Laković, S. (2022). Modern
technologies and methods of data collection in the
function of making better traffic analysis of forensic
traffic experts. Environmental engineering. DOI:
10.37023/ee.9.1-2.1.
Morales, A., Gonzalez-Aguilera, D., Gutiérrez, M. and
López. (2015). Alfonso. Energy analysis of road
accidents based on close-range photogrammetry.
Online. Remote Sensing. Vol. 7, No. 11, pp. 15161-
15178. Available from: https://doi.org/10.3390/
rs71115161. [cit. 2023-11-20].
Moravcová P, Bucsuházy K, Zůvala R, Semela M, Bradáč
A (2024) What should I use to calculate vehicle EES?
PLoS ONE 19(2): e0297940. Available from:
https://doi.org/10.1371/journal.pone.0297940 [cit.
2024-02-21]
Mrowicki A., Krukowski M., Turoboś F., Kubiak P. (2020).
Determining vehicle pre-crash speed in frontal barrier
crashes using artificial neural network for intermediate
car class. Forensic Science International. Volume 308.
ISSN 0379-0738. Available from: https://doi.org/
10.1016/j.forsciint.2020.110179.
Nordhagen, R., Warner, M., Perl, T., Kent, R. (2006).
Accident Reconstruction for Rear Pole Impacts of
Passenger Cars (No. 2006-01-0899), SAE Technical
Paper, DOI: 10.4271/2006-01-0899.
Nouzovský, L., Kostěncová, V., Frydrýn, M. (2021).
Využitelnost dat EDR pro analýzu silničních nehod.
Soudní inženýrství, 32(4), 9–18. DOI:
http://dx.doi.org/10.13164/SI.2021.4.9. ISSN 1211-
443X
Riviere, C., Lauret, P., Ramsamy, J. M., & Page, Y. (2006).
A Bayesian neural network approach to estimating the
energy equivalent speed. Accident Analysis &
Prevention, 38(2), 248-259. Available from:
https://doi.org/10.1016/j.aap.2005.08.008.
Schaper, D. (1981). Určení střetové rychlosti podle
deformace havarovaného vozidla. Online. Available
from: http://bulletin.csm.cz/Bull_1988_2.pdf. [cit.
2023-10-04].
Semela, M. (2014). Analýza silničních nehod II, Ústav
soudního inženýrství, VUT v Brně.
Singh, J. (2005). The Effect of Residual Damage
Interpolation Mesh Fineness on Calculated Side Impact
Stiffness Coefficients. SAE Technical Paper 2005-01-
1205. DOI: https://doi.org/10.4271/2005-01-1205.
Struble, D. (2020). Automotive Accident Reconstruction:
Practices and Principles. 2nd Edition. Boca Raton:
CRC Press, ISBN 9781003008972.
Tandy, D., Coleman, C., Colborn, J., Hoover, T. and Bae,
J. (2012). Benefits and Methodology for Dimensioning
a Vehicle Using a 3D Scanner for Accident
Reconstruction Purposes. Online. SAE Technical Paper
Series: SAE 2012 World Congress & Exhibition. 2012,
Vol. 1. Available from: https://doi.org/10.4271/2012-
01-0617. [cit. 2023-09-04].
Topolšek, D., Kamnik, R. and Perc, M. (2019). Using the
scanners and drone for comparison of point cloud
accuracy at traffic accident analysis. Accident; analysis
and prevention. 135. DOI: 10.1016/j.aap.2019.105391.
Tumbas, N. S., Smith, R. A. (1988). Measuring Protocol
for Quantifying Vehicle Damage from an Energy Basis
Point of View. SAE Technical Paper Series.
DOI:10.4271/880072.
Vangi, D. Vehicle Collision Dynamics. Online.
Butterworth-Heinemann, 2020. ISBN 9780128127506.
Available from: https://doi.org/10.1016/B978-0-12-
812750-6.00013-5. [cit. 2023-11-20].
Vomhof, D. (2016). Equal Spacing NOT Required for
Speed from Crush Calculation. Equally Spaced Crush
measurements - take them in the field or in the office -
which is the better location? WORLD
RECONSTRUCTION EXPOSITION 2016. Florida,
Orlando. Available from: https://www.4n6xprt.com/
WREX2016-4N6XPRT-poster.pdf [cit. 2023-11-20]
Zeidler F., Schreier H., Stadelmann R. (1985). Accident
Research and Accident Reconstruction by the EES-
Accident Reconstruction Method Warrendale, PA:
Society of Automotive Engineers. SAE Paper 850256.
Available from: https://doi.org/10.4271/850256. [cit.
2024-02-21]
How Should I Measure Vehicle Deformation Depth?
133
