
Analyzing Spatial Data with Heuristics Methods and Ensemble: A Case
Study of Vehicle Routing Problem
Giovani Farias
a
, Timotio Cubaque, Eder Gonc¸alves
b
and Diana Adamatti
c
Federal University of Rio Grande, FURG, Center for Computational Sciences, C3, RS, Brazil
Keywords:
Vehicle Routing Problem, Capacitated Vehicle Routing Problem, Heuristic, Ensemble.
Abstract:
The vehicle routing problem presents an intricate challenge within logistics and cargo transport. The primary
objective is to determine the most efficient vehicle routes to visit a designated set of clients while minimizing
overall transportation costs. The capacitated vehicle routing problem represents a specific variation of this
challenge, introducing constraints such as routes commencing and concluding at the same depot, assigning
each client to a single vehicle, and ensuring that the total demand for a route does not exceed the vehicle’s
capacity. This paper explores the hypothesis that optimal optimization strategy is contingent on spatial data
density. Thereby, we evaluate various routing strategies using heuristic methods and ensemble techniques
applied to spatial data. The goal is to identify the most effective strategy tailored to a specific spatial data
pattern. To accomplish this, we employ two clustering methods – K-means and DBSCAN – to group clients
based on their geographical locations. Additionally, we utilize the nearest neighbor heuristic to generate
initial solutions, which are subsequently refined through the implementation of the 2-Opt method. Through
experiments, we demonstrate the impact of each approach on the resulting routes, taking into account the
spatial data distribution.
1 INTRODUCTION
The logistics costs in Brazil, as highlighted in the re-
port by ILOS
1
, present a significant challenge, ac-
counting for a larger portion of the country’s Gross
Domestic Product (GDP) compared to many others.
The “Logistics Costs in Brazil” report from ILOS in-
dicates that logistics costs make up 12.2% of Brazil’s
GDP, a higher percentage than the 7.8% observed in
the United States. A substantial portion of these costs
is attributed to transportation, representing 6.8% of
Brazil’s GDP. Additionally, distribution costs, rang-
ing from 10% to 15% of the product’s value, play a
crucial role in the overall cost calculation.
The Vehicle Routing Problem (VRP) emerges as a
key optimization challenge in this context. This com-
binatorial optimization problem focuses on determin-
ing the optimal configuration of routes for a fleet of
vehicles tasked with delivering products from a spec-
ified depot to a set of destinations (or clients). Given
a
https://orcid.org/0000-0002-9390-5217
b
https://orcid.org/0000-0001-9159-2264
c
https://orcid.org/0000-0003-3829-3075
1
https://ilos.com.br/
the complexity of logistics and cargo operations, find-
ing efficient solutions to the VRP becomes crucial for
reducing costs and enhancing the overall quality of
transportation services (Borowski et al., 2020).
The Capacitated Vehicle Routing Problem
(CVRP) is essential to determine the routes for a
set of vehicles to deliver goods to clients, taking
into consideration the vehicles’ capacities and the
demands of each client. Broadly, the CVRP aims
to efficiently manage a vehicle’s feet to cater to a
specific number of clients with varying demands. The
goal is to devise a set of routes with the lowest travel
cost, all commencing and concluding at the depot.
The total demand of clients on any given route must
be at most the vehicle’s capacity, and each client is
visited only once (Jiang et al., 2022).
In this study, two clustering algorithms – K-means
and Density-Based Spatial Clustering of Applications
with Noise (DBSCAN) – are employed for group-
ing delivery points. The K-means method involves
dividing delivery points into groups, initiating with
random centers, and iteratively adjusting these cen-
ters based on point proximity. Conversely, DBSCAN
identifies dense areas amid less dense regions, ex-
panding groups from central points according to prox-
Farias, G., Cubaque, T., Gonçalves, E. and Adamatti, D.
Analyzing Spatial Data with Heuristics Methods and Ensemble: A Case Study of Vehicle Routing Problem.
DOI: 10.5220/0012634300003690
Paper published under CC license (CC BY-NC-ND 4.0)
In Proceedings of the 26th International Conference on Enterprise Information Systems (ICEIS 2024) - Volume 1, pages 305-312
ISBN: 978-989-758-692-7; ISSN: 2184-4992
Proceedings Copyright © 2024 by SCITEPRESS – Science and Technology Publications, Lda.
305

imity. Building upon these algorithms, two distinct
strategies are formulated, each leveraging one of the
aforementioned clustering algorithms. Additionally,
heuristics such as the nearest neighbor, utilized for
generating an initial solution, and the 2-Opt, em-
ployed for refining the initially obtained solution, are
incorporated. Finally, the algebraic combiner rule is
applied to the ensemble technique to join the results,
culminating in a final solution.
The literature reveals numerous studies address-
ing the VRP (Li et al., 2019; Bruni et al., 2014; San-
tos, 2022; Lima, 2015). However, the application of
ensemble techniques to optimize vehicle routing is a
relatively less explored area. Therefore, this research
intends to contribute to the field of logistics and cargo
distribution by aiming to develop more effective solu-
tions for the VRP through the utilization of ensemble
techniques.
2 RELATED WORKS
In the past decade, the VRP has been the focus of
extensive research, especially in logistics and cargo
transportation. Several studies have highlighted its
potential as an alternative for reducing logistics costs.
In a recent study by (Kangah et al., 2021), an en-
semble method is introduced that combines Particle
Swarm Optimization (PSO) and Genetic Algorithm
(GA) operators, such as crossover and mutation. The
original algorithmic structure of PSO is modified, and
selected GA operators are incorporated to create a hy-
brid algorithm for solving the vehicle routing prob-
lem.
In (Lu et al., 2020), the authors used machine
learning techniques to solve the CVRP. The L2I al-
gorithm is a learning-based solution for CVRP that
has a faster resolution speed than traditional opera-
tional research algorithms. The researchers devel-
oped a learning-based algorithm for CVRP that cat-
egorizes heuristic operators into two groups, which
helps improve operations and guides reinforcement
learning toward the identified improvement operators.
They also presented an ensemble technique where re-
inforcement learning rules are taught simultaneously,
resulting in improved outcomes with the same com-
putational cost.
In their work, (Wang et al., 2021) tackle the VRP
as a classical combinatorial optimization challenge
that has undergone extensive research. The authors
construct a multi-objective optimization model for
Dynamic Vehicle Routing Problem with Time Win-
dows (DVRPTW) and introduce a new algorithm
named EL-DMOEA, where an ensemble learning
method is explored to enhance the algorithm’s perfor-
mance.
A hybrid approach for addressing the Multiple
Traveling Salesman Problem (mTSP) has been intro-
duced by (Silva, 2020), with a specific focus on its
application to route scheduling for autonomous vehi-
cles. The approach begins with using K-means as a
preprocessing step to generate routes that effectively
distribute delivery locations among the vehicles. Sub-
sequently, these routes serve as the initial population
for bio-inspired algorithms, namely the GA and Ant
Colony System (ACS). These algorithms undergo an
evolutionary process to discover routes that minimize
the overall distance while ensuring balance in the in-
dividual routes for each vehicle. The results indicate
that the hybrid approaches outperform their classical
versions and PSO with increased vehicles and visit
locations.
3 BACKGROUND
The Ensemble Method is a learning paradigm in
which alternative solution proposals for a problem,
referred to as components, have their outputs com-
bined to obtain a final solution. In statistics and com-
puter science, ensemble methods constitute a set of
techniques that combine multiple learning algorithms
to achieve predictive performance superior to individ-
ual algorithms (Opitz and Maclin, 1999). Generally,
the formation of a group of classifiers, where the final
prediction is obtained by combining their predictions,
assumes that the diverse opinions, when unified, tend
to generate a better decision than those generated by
a single component. The success of an ensemble sys-
tem – that is, its ability to correct errors from some
of its members – directly relies on the diversity of the
classifiers within the ensemble. The intuition is that if
each classifier makes different errors, a strategic com-
bination of these classifiers can reduce the overall er-
ror (Polikar, 2009).
According to (Vieira, 2013), the VRP involves de-
termining a route to be followed by a fleet of vehicles,
ensuring that the demand of all clients is satisfied and
each vehicle returns to the initial depot at the end of
the route. The objective is to minimize the total cost,
travel time, or total route distance. Vehicle routing
problems are among the most complex in the combi-
natorial optimization field (Golbarg and Luna, 2000).
In the CVRP the task is to determine the routes
that a set of vehicles must take to deliver goods to
clients, considering the vehicle’s capacities and the
demands of each client. The goal is to minimize
the overall transportation cost, which may encompass
ICEIS 2024 - 26th International Conference on Enterprise Information Systems
306

factors such as distance traveled by vehicles, time
needed for deliveries, number of required vehicles,
and other relevant considerations. Similar to the VRP,
the CVRP is classified as an NP-hard problem. The
CVRP is formally formulated by (Laporte, 1992) as
follows:
Given a graph G = (V, E), where V =
{v
1
, v
2
, v
3
, ..., v
n
} corresponds to the demand points
and E = {(v
i
, v
j
) : v
i
, v
j
∈ V, i ̸= j} is the set of edges
between the demand points. For each client v
i
∈ V
there is an associated demand q
i
∈ Q that must be sup-
plied by some vehicle. The set E is associated with a
non-negative symmetric cost matrix C that represents
the cost required to travel between two nodes i and j,
where c
i j
= c
ji
. The following constraints must be re-
spected: (i) each city v ∈ V −1 must be visited exactly
once; (ii) all routes must start and end at the depot;
(iii) meet the capacity constraints of the vehicles.
4 METHODOLOGY
In this Section, the strategies employed in construct-
ing heuristics to address the proposed problem are
presented.
4.1 Clustering
Clustering entails the application of computational
techniques to partition a dataset into distinct groups
based on their similarities. As defined by (Priy, 2013),
clustering is the process of dividing the population or
data points into multiple groups. The objective is to
ensure that data points within the same group exhibit
greater similarity to each other than to those in other
groups. Diverse clustering methods exist, differing
primarily in their approach and strategy for group for-
mation. In this study, two distinct methods were em-
ployed. The first method utilizes the concept of cen-
troids and is implemented through the K-means algo-
rithm. The second method relies on point density and
is executed using the DBSCAN algorithm.
K-means – described initially by (MacQueen, 1967),
K-means algorithm aims to partition observations into
k groups, where k represents the number of groups.
This partitioning of data is done in such a way that
different groups are more separated from each other,
while observations within each group are closer to
each other. To achieve this, it uses the Sum of Squared
Errors, denoted as (SSE), which seeks to minimize
the distance between points and their centroid. Once
the model is created, the K-means algorithm calcu-
lates the mean of each group, also referred to as cen-
troids, and thereby identifies the centroid closest to
each new data point. The centroid serves as the center
of the group (Bramer, 2007).
The K-means algorithm aims to classify informa-
tion based on the inherent structure of the data. This
classification relies on the analysis and comparisons
of numerical values within the data. Consequently,
the algorithm automatically generates an unsuper-
vised classification, requiring no human supervision
or pre-existing classification. Due to this characteris-
tic, K-means is considered an unsupervised data min-
ing algorithm.
It is important to note that the K-means method
does not guarantee convergence to the global opti-
mum, and the solution obtained often represents a lo-
cal optimum. The results are influenced by the initial
(random) selection of group centers. Additionally, it
is necessary to determine the number of groups in ad-
vance. In practice, to enhance results, it is common
to run the K-means algorithm multiple times with dif-
ferent initial centroids (Chen and Tan, 2021).
DBSCAN – Density-Based Spatial Clustering of
Application with Noise is a non-parametric density-
based clustering method proposed by (Ester et al.,
1996). It is effective in identifying groups of arbitrary
shapes and sizes, separating noise from data, and de-
tecting natural groups and their arrangements within
the data space, without any prior information about
the groups. The method requires only one input pa-
rameter but supports determining an appropriate value
for it. The main idea of the DBSCAN method is
that, for each point in a group, the neighborhood for a
given radius must contain at least a certain number of
points, meaning that the density in the neighborhood
must exceed a threshold.
4.2 Elbow Method
This method plays a crucial role in determining the
ideal number of clusters, denoted as K, which is an
essential parameter for the initial configuration of the
K-means algorithm. According to (Sammouda et al.,
2021), the elbow criterion technique is a heuristic
method applied to determine the number of clusters
for data points in a dataset. The elbow technique is
used to obtain the optimal number of clusters for a set
of data points because it is an empirical, simple, and
easy-to-implement method. Applying the K-means
clustering algorithm, the elbow method plots the ex-
plained variations against the number of clusters and
chooses the elbow curve to determine the number of
clusters. It relies on calculating the sum of squared
errors within the cluster of all data points to represent
the quality of aggregation within the same cluster and
separation between clusters.
Analyzing Spatial Data with Heuristics Methods and Ensemble: A Case Study of Vehicle Routing Problem
307
4.3 Initial Solution Generation
Generating an initial solution is a crucial step in many
routing algorithms to identify the optimal solution for
a given problem. This phase involves the creation of
an initial solution that acts as the starting point for
the routing algorithm. Initially proposed by (Cover
and Hart, 1967), the Nearest Neighbor Algorithm
consists of composing the route based on the sequen-
tial insertion of points through an initial point accord-
ing to the shortest distance between this point and its
other points (neighbors). After determining all dis-
tances between the initial point and the other points
in the cluster, the remaining points are sorted in de-
creasing order to enable the choice and determination
of the nearest node that will be assigned to the route.
According to (Santos and Leal, 2006), this method is
usually used to find an initial solution to the problem,
which is then gradually improved by other techniques
and models. It has a simple and fast application and
can be used for highly complex problems.
4.4 Initial Solution Improvement
Heuristics for route improvement are designed to en-
hance the efficiency of a route by refining a previously
obtained solution. They initiate the process with a
comprehensive initial solution, acquired through con-
structive or random methods, and then aim to dis-
cover a higher-quality solution within its neighbor-
hood (Siqueira, 2017). If a superior solution is identi-
fied, it replaces the current one. This process of seek-
ing route improvement persists until a stopping cri-
terion is met or no further improvements are found
(Fraga, 2006). The most well-known category of al-
gorithms for this purpose is the k-opt arc exchange
heuristic.
K-Opt Heuristic – initially proposed by (Lin, 1965)
for the Traveling Salesman Problem (TSP), has found
natural applicability to the VRP. This approach rep-
resents a classic local search algorithm for the TSP,
relying on the exchange of arcs in solutions initially
created through constructive heuristics. The number
of arcs to be exchanged is determined by the parame-
ter k. Notably, as the parameter k increases, the pro-
cedure gradually approximates the total enumeration
of neighboring solutions (Goldbarg and Luna, 2005;
Bispo, 2018). According to (Croes, 1958), the 2-Opt
heuristic exchanges two edges to find an improvement
in the current solution. If an improvement is detected
in any of these exchanges, it is assumed as the current
solution. This process ends when it is no longer pos-
sible to make exchanges that improve the solution or
a stopping limit is reached.
5 PROPOSED STRATEGIES
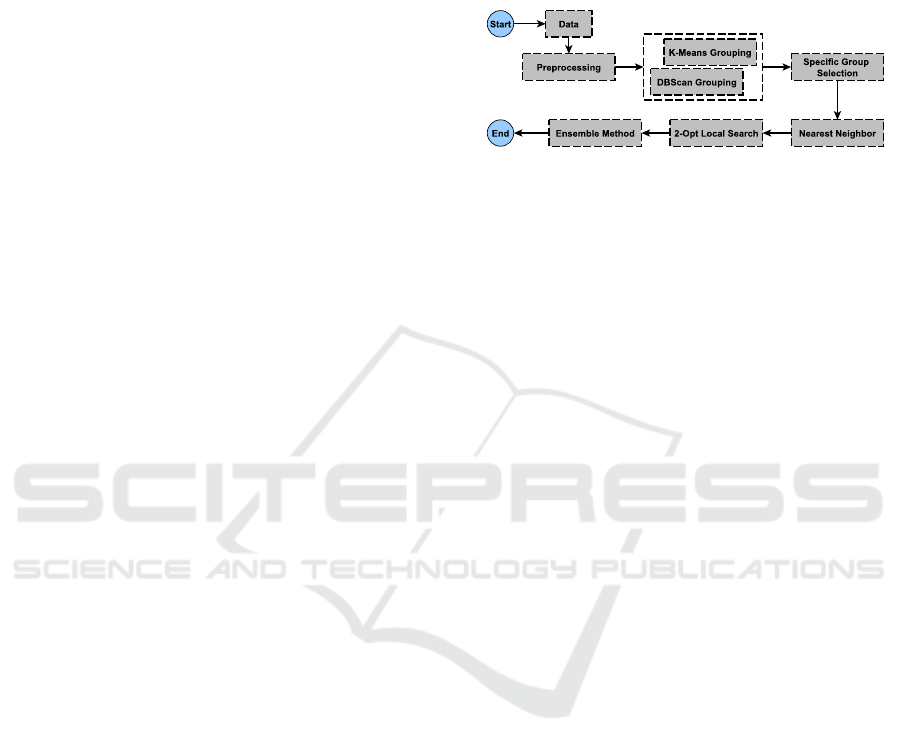
The main structures of the proposed strategies are
composed of six steps, as presented in the flowchart
in Figure 1.
Figure 1: Model general flowchart.
In the initial step, several preprocessing opera-
tions are performed to ready the data for clustering.
Specifically, the latitude and longitude columns con-
tain geographical coordinates represented as strings
with commas. To facilitate numerical processing,
these commas are substituted with dots in both
columns. Subsequently, the columns are converted to
the numeric data type.
The second step is related to the clustering of
clients according to their geographical locations. As
mentioned earlier, two strategies have been proposed,
each employing a specific clustering method to group
the delivery points.
The first strategy (based on the K-means al-
gorithm) utilizes the K-means clustering algorithm,
which groups observations into k clusters, where k
is the desired number of groups. In clustering algo-
rithms like K-means, it is necessary to determine the
appropriate number of clusters for a given dataset.
This ensures that the data is divided appropriately
and efficiently. An appropriate value of k (i.e., the
number of clusters) helps ensure the proper granu-
larity of the groups and maintain a good balance be-
tween compressibility and accuracy. To determine the
ideal value of k in the instances worked on, the elbow
method is used, which assists in defining the optimal
number of groups. This value of k should be passed
as a parameter at the beginning of the K-means algo-
rithm execution.
In the strategy based on DBSCAN, the clustering
of customers into groups is performed using the DB-
SCAN algorithm. This algorithm is used to group
a set of spatial data based on two main parameters:
the physical distance of each point and the minimum
size of the cluster. DBSCAN identifies dense regions
of points in space, considering points that are close
enough to each other as part of the same cluster. The
parameter ε (epsilon) represents the maximum dis-
tance that defines the neighborhood of each point,
ICEIS 2024 - 26th International Conference on Enterprise Information Systems
308

while the min samples parameter defines the mini-
mum number of points within that neighborhood for
the point to be considered the core of a cluster.
In the third step, a specific group is selected from
those created by the clustering algorithm. The cho-
sen group is stored in a variable, and its total demand
is calculated. This means that routes are created in
a way that the sum of demands does not exceed the
vehicle capacity, which, in this case, is 180.
2
Following the creation of the routes, an initial
route is generated by applying the nearest neighbor
algorithm to find an initial path that visits all points in
the specific group in order of proximity, starting and
ending at an initial point (depot), respecting the vehi-
cle capacity constraint and visiting a client only once
per vehicle. This is the fourth step of the process.
In the fifth step, the 2-Opt improvement algo-
rithm is applied to enhance the initial solution ob-
tained through the nearest neighbor algorithm.
In the sixth and final step, the routes are com-
bined to obtain the final solution. This is done through
the ensemble combination rule, using an algebraic
combiner approach. This type of combiner is non-
trainable and operates on the continuous outputs of
classifiers or, in this context, routes.
6 ANALYSIS AND RESULTS
The reference database utilized in this study is the
Loggi Benchmark for Urban Deliveries (BUD), com-
prising a collection of data for large-scale problems
obtained from the LoggiBUD repository. This dataset
simulates the challenges associated with deliveries in
the final stage of the logistics chain. The data in this
database are structured as JSON data dictionaries, or-
ganized by cities. Each JSON file includes informa-
tion such as the city’s name, the served region, the co-
ordinates of the origin point (latitude and longitude),
the capacities of the vehicles, and the delivery points
(identifier and address coordinates).
The LoggiBUD repository provides two types
of instances: delivery-instances and cvrp-instances.
This study uses the cvrp-instances, which represent
a CVRP. These instances include details such as the
depot location, the vehicle capacity, the locations of
each delivery, and the associated demands for each
delivery. The initial version of LoggiBUD offers a
total of 90 training and 30 evaluation instances for
the city/state: Rio de Janeiro/Rio de Janeiro (RJ),
Bras
´
ılia/Distrito Federal (DF), and Bel
´
em/Par
´
a (PA).
Each instance varies in the quantity of packages (de-
2
Pre-established value by the LoggiBUD.
liveries). In the experiments, three samples were gen-
erated – one from RJ, other from DF, and the last one
from PA. Concerning the deliveries number, RJ has
the highest, totaling 4,273 deliveries; DF follows with
987 deliveries; and PA has the lowest, with 297 deliv-
eries.
Tests were conducted using the strategies de-
scribed in this work and were applied to instances ob-
tained from the LoggiBUD repository
3
. The instances
contain information about the depot’s location, the
fleet vehicle capabilities (180 units of load), the lo-
cations of each delivery, and the demands of each de-
livery, ranging from 1 to 10 weight units. To assess
the quality of the solutions obtained by the strategies,
two main objectives were considered: minimizing the
total distance traveled by trucks and achieving a bal-
ance in the distribution of vehicle distances.
In this work, a lower standard deviation in the
traveled distances is desirable as it indicates a more
balanced distribution of distances among vehicles.
The strategies were evaluated through computational
experiments involving a set of instances from three
Brazilian states (RJ, DF, and PA), in terms of vehicle
fleet, a homogeneous fleet was considered, where all
vehicles have the same capacity.
6.1 Strategy Using K-means
The strategy in this approach involves utilizing the K-
means algorithm. Determining the appropriate num-
ber of clusters for a given dataset is a crucial step in
this algorithm. The elbow point on the curve – rep-
resenting the sum of variances within the cluster con-
cerning the number of clusters – is employed to select
the optimal number of clusters. Thus, by applying the
elbow method, we observe the ideal value of k is 10
for RJ, 6 for DF, and 4 for PA. Thereupon, these num-
bers of clusters are utilized in the K-means algorithm
to perform clustering.
Figures 2(a), 2(b), and 2(c) display different clus-
ters identified by a distinct color. These clusters are
formed based on three dataset attributes: coordinates
(latitude and longitude) and each client demand. As
observed in Table 1(b), for DF with 986 deliveries, 31
vehicles were utilized, covering a distance of 4,294
kilometers. In Table 1(c), it is evident that in PA was
completed 297 deliveries to different points using 12
vehicles, throughout the deliveries, vehicles traveled
a total of 1,849 kilometers. In RJ, the delivery num-
ber was higher, totaling 4,273, as shown in Table 1(a).
To satisfy this demand, 137 vehicles were employed,
covering a total distance of 14,632 km.
3
https://loggibud.s3.amazonaws.com/dataset.zip
Analyzing Spatial Data with Heuristics Methods and Ensemble: A Case Study of Vehicle Routing Problem
309
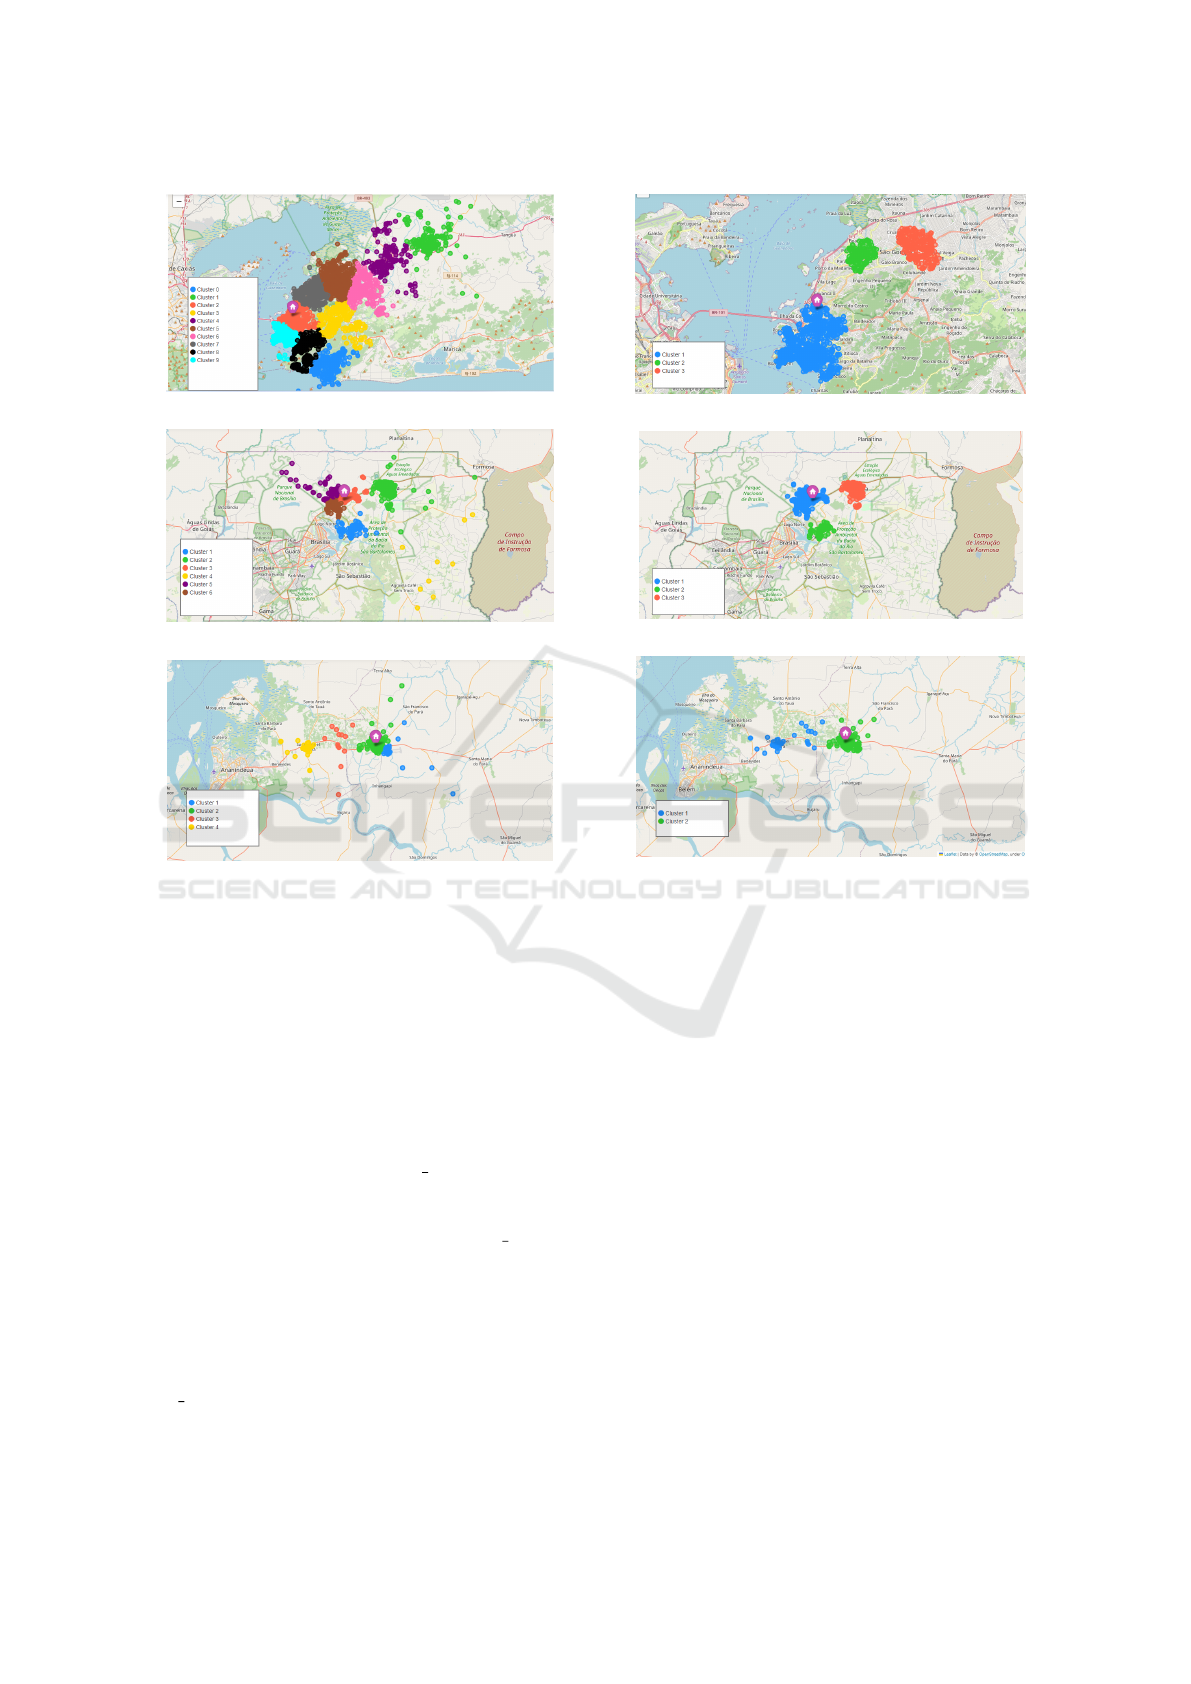
(a) RJ
(b) DF
(c) PA
Figure 2: K-Means clustering in RJ, DF, and PA.
6.2 Strategy Using DBSCAN
This strategy utilizes the DBSCAN algorithm where
ε is a parameter that sets the maximum distance be-
tween two points for them to be considered neighbors.
In this scenario, individual ε values are calculated: 1
km for RJ, 3 km for DF, and 3.50 km for PA. These
values are the required proximity between points to
be considered part of the same cluster.
The second parameter is min samples, defining
the minimum number of points necessary to form a
valid cluster. Any points failing to meet this criterion
are categorized as noise. The chosen min samples
values vary according to the geographical context: 10
for RJ, 5 for DF, and 5 for PA. This differentiation
considers the anticipated density of points in each re-
gion. Unlike K-means, DBSCAN does not neces-
sitate specifying the number of clusters in advance;
it automatically determines them based on the ε and
min samples parameters.
Figures 3(a), 3(b), and 3(c) provide insight into the
(a) RJ
(b) DF
(c) PA
Figure 3: DBSCAN clustering in RJ, DF, and PA.
geographical distribution of clusters. Notably, only
points within the distance defined by ε are selected to
form clusters, while those not meeting this criterion
are discarded. For RJ, out of the total 4,273 scheduled
deliveries, the algorithm selected 3,285 for inclusion
in the clusters, while 988 points were discarded for
not meeting the criteria. In DF, where initially 986
deliveries were planned, 960 were grouped, and 26
points were considered noise and excluded. In PA,
out of the planned 297 points, 27 were identified as
noise and not included in the grouping.
The results for instances of RJ, DF, and PA are
presented in Tables 1(a), 1(b), and 1(c), respectively.
In RJ (Table 1(a)), we can see 3,285 deliveries in to-
tal, and 78 trucks were used, covering a distance of
10,264 kilometers. In DF (Table 1(b)), trucks cov-
ered 4,454 kilometers to complete 960 deliveries. In
PA (Table 1(c)), there were 270 delivery points with a
total distance traveled of 2,101 kilometers.
Table 1 consolidated results for the strategies pre-
sented. When considering criteria such as solution
ICEIS 2024 - 26th International Conference on Enterprise Information Systems
310

Table 1: Results for instances in RJ, DF, and PA.
(a) RJ
Items K-means DBSCAN Loggi
Trucks 137 78 145
Demand 23531 13860 23531
Distance 14632 10264 16985
Delivery Pts 4273 3285 4273
Std Dev (σ) 627.735 3263.221 755.367
(b) DF
Items K-means DBSCAN Loggi
Trucks 31 30 32
Demand 5353 5040 5353
Distance 4294 4454 4902
Delivery Pts 986 960 986
Std Dev (σ) 363.493 843.085 536.415
(c) PA
Items K-means DBSCAN Loggi
Trucks 12 10 10
Demand 1634 1453 1634
Distance 1849 2101 1520
Delivery Pts 297 270 297
Std Dev (σ) 315.981 58.689 457.570
quality concerning the preconized objectives, it is ev-
ident that both strategies based on K-means and DB-
SCAN algorithms provide high-quality solutions.
Analyzing RJ instances (Table 1(a)), it can be ob-
served that the strategy based on the DBSCAN algo-
rithm demonstrated superior performance in terms of
number of trucks used and the total distance traveled.
However, the DBSCAN strategy did not use the same
number of instances as K-means strategy and Loggi
approach. The strategy based on K-means algorithm,
has benefits in both the number of trucks and the to-
tal distance traveled when compared to the Loggi ap-
proach.
In the results for DF instances (Table 1(b)), the
strategy based on K-means algorithm achieved supe-
rior performance in terms of the number of trucks
and the total distance traveled when compared to the
Loggi approach. Regarding, the strategy based on the
DBSCAN algorithm, it is important to highlight that
delivery points were different, which may have influ-
enced the comparison of results. In the results for PA
(Table 1(c)), the Loggi approach showed better per-
formance in both the number of trucks and the dis-
tance traveled compared to the proposed strategies.
Table 1 shows a comparison between solutions
obtained by each strategy – K-means and DBSCAN
– and Loggi’s approach in tests conducted for the
three instances under analysis. The K-means algo-
rithm strategy presents the lowest standard deviations
for the instances of RJ and DF, being more consistent
and predictable in results for these instances. Table
1(c) highlights that the DBSCAN algorithm strategy
presents a lower standard deviation, indicating a more
consistent and predictable distribution of results for
the PA instances. It is important to reiterate that the
lower the standard deviation value, the more efficient
the deliveries were, pointing to a more effective dis-
tribution.
The ensemble combiner rule, based on algebraic
sum combination, is used to unify individual results
from each optimized route, aiming to obtain an over-
all measure of route efficiency. This rule acts as the
central mechanism to combine individual values of
distance traveled on all routes, resulting in a total
distance that reflects the overall performance of the
adopted strategies, presented in Tables 1(a), 1(b) e
1(c). The process of applying this rule can be de-
scribed as follows: (i) after the optimization step, the
individual distances of each route are obtained, repre-
senting the distances traveled by each vehicle; (ii) the
ensemble combiner rule comes into action, where the
individual distances of all routes are summed through
an algebraic expression; (iii) the total distance ob-
tained by summing the individual distances becomes
a unified performance measure; (iv) a lower total dis-
tance value indicates more efficient routes in terms of
minimizing the distance traveled.
7 CONCLUSIONS
This study aimed to develop and apply an approach
for spatial data analysis using heuristic methods and
ensemble techniques to optimize the vehicle routing
process. To achieve this goal, two distinct strategies
were proposed, each employing a clustering model
to group delivery points (clients) into clusters. The
application of the K-means and DBSCAN clustering
algorithms allowed for efficient grouping of clients,
providing essential information for the creation of
routing strategies. The implementation of two dis-
tinct strategies, each centered on a specific clustering
model, demonstrated the flexibility of the proposed
methodology.
Based on the conducted experiments, it can be
concluded that both the strategy based on the K-
means algorithm and the strategy based on the
DBSCAN algorithm produced good results for the
CVRP. They demonstrated satisfactory performance
in minimizing the total distance traveled by trucks,
balancing the distribution of distances traveled, and
minimizing the standard deviation. This study pro-
vides valuable insights into fleet routing through the
analysis of spatial data and heuristic methods. By ad-
dressing current challenges and offering guidance for
Analyzing Spatial Data with Heuristics Methods and Ensemble: A Case Study of Vehicle Routing Problem
311

future research, it is anticipated that this work will
make a meaningful contribution to the enhancement
of logistics and transportation operations.
ACKNOWLEDGEMENTS
This research was supported by Edital FAPERGS/
CNPq 07/2022 – PDJ.
REFERENCES
Bispo, R. C. (2018). Planejador de roteiros tur
´
ısticos: uma
aplicac¸
˜
ao do problema do Caixeiro viajante na cidade
do Recife. Brasil.
Borowski, M., Gora, P., Karnas, K., Błajda, M., Kr
´
ol,
K., Matyjasek, A., Burczyk, D., Szewczyk, M., and
Kutwin, M. (2020). New hybrid quantum annealing
algorithms for solving vehicle routing problem. In
ICCS, pages 546–561. Springer.
Bramer, M. (2007). Principles of data mining. Springer.
Bruni, M., Guerriero, F., and Beraldi, P. (2014). Design-
ing robust routes for demand-responsive transport sys-
tems. Transportation Research Part E: Logistics and
Transportation Review, 70:1–16.
Chen, R. and Tan, Y. (2021). A multi-branch ensemble
agent network for multi-agent reinforcement learn-
ing. International Conference on Data Mining and
Big Data, pages 485–498.
Cover, T. and Hart, P. (1967). Nearest neighbor pattern clas-
sification. IEEE Transactions on Information Theory,
13(1):21–27.
Croes, G. A. (1958). A method for solving traveling-
salesman problems. Operations research, 6(6):791–
812.
Ester, M., Kriegel, H.-P., Sander, J., and Xu, X. (1996).
A density-based algorithm for discovering clusters in
large spatial databases with noise. In Proceedings of
the Second International Conference on Knowledge
Discovery and Data Mining, KDD’96, page 226–231.
AAAI Press.
Fraga, M. C. P. (2006). Uma metodologia h
´
ıbrida
col
ˆ
onia de formigas–busca tabu–reconex
˜
ao por cam-
inhos para resoluc¸
˜
ao do problema de roteamento
de ve
´
ıculos com janelas de tempo. Dissertac¸
˜
ao de
Mestrado em Modelagem Matem
´
atica e Computac¸
˜
ao,
Centro Federal . . . .
Golbarg, M. C. and Luna, H. P. L. (2000). Otimizac¸
˜
ao com-
binat
´
oria e programac¸
˜
ao linear. Editora CAMPUS,
Rio de Janeiro.
Goldbarg, M. C. and Luna, H. P. L. (2005). Otimizac¸
˜
ao
combinat
´
oria e programac¸
˜
ao linear: modelos e algo-
ritmos. Elsevier.
Jiang, H., Lu, M., Tian, Y., Qiu, J., and Zhang, X. (2022).
An evolutionary algorithm for solving capacitated ve-
hicle routing problems by using local information. Ap-
plied Soft Computing, 117:108431.
Kangah, J. K., Appati, J. K., Darkwah, K. F., and Soli,
M. A. T. (2021). Implementation of an h-psoga op-
timization model for vehicle routing problem. Inter-
national Journal of Applied Metaheuristic Computing
(IJAMC), 12(3):148–162.
Laporte, G. (1992). The vehicle routing problem: An
overview of exact and approximate algorithms. Euro-
pean journal of operational research, 59(3):345–358.
Li, S., Gong, W., Yan, X., Hu, C., Bai, D., Wang, L.,
and Gao, L. (2019). Parameter extraction of photo-
voltaic models using an improved teaching-learning-
based optimization. Energy Conversion and Manage-
ment, 186:293–305.
Lima, S. J. D. A. (2015). Otimizac¸
˜
ao do problema de
roteamento de ve
´
ıculos capacitado usando algorit-
mos gen
´
eticos com heur
´
ısticas e representac¸
˜
oes cro-
moss
ˆ
omicas alternativas. Universidade Nove de
Julho.
Lin, S. (1965). Computer solutions of the traveling
salesman problem. Bell System Technical Journal,
44(10):2245–2269.
Lu, H., Zhang, X., and Yang, S. (2020). A learning-based
iterative method for solving vehicle routing problems.
International conference on learning representations.
MacQueen, J. (1967). Classification and analysis of mul-
tivariate observations. University of California Los
Angeles LA USA, pages 281–297.
Opitz, D. and Maclin, R. (1999). Popular ensemble meth-
ods: An empirical study. Journal of artificial intelli-
gence research, 11:169–198.
Polikar, R. (2009). Ensemble learning. Scholarpedia 4 (1):
2776. Doi:10.4249/scholarpedia.2776.
Priy, S. (2013). Clustering in machine learning. Geeks-
forGeeks.
Sammouda, R., El-Zaart, A., et al. (2021). An optimized
approach for prostate image segmentation using k-
means clustering algorithm with elbow method. Com-
putational Intelligence and Neuroscience, 2021.
Santos, A. G. (2022). Uma meta-heur
´
ıstica adaptativa apli-
cada ao problema de roteamento de ve
´
ıculos capacita-
dos: estudo de caso de uma transportadora de pacotes.
Santos, R. L. and Leal, J. (2006). Uma aplicac¸
˜
ao de al-
goritmos de col
ˆ
onias de formigas em problemas de
roteirizac¸
˜
ao de ve
´
ıculos com janelas de tempo.
Silva, C. E. d. (2020). Coordenac¸
˜
ao de M
´
ultiplos Ve
´
ıculos
Aut
ˆ
onomos de Entrega Usando K-Means e Algoritmos
Bio-Inspirados. PhD thesis, Universidade Federal de
Uberl
ˆ
andia.
Siqueira, R. (2017). Comparac¸
˜
ao de metodos heuristicos
para otimizac¸
˜
ao de rotas de distribuic¸
˜
ao no municipio
de Cascavel-PR. Universidade Tecnol
´
ogica Federal
do Paran
´
a.
Vieira, H. (2013). Metaheuristica para a soluc¸
˜
ao de
problemas de roteamento de ve
´
ıculos com janela de
tempo. campinas: Unicamp, 2013. 108p. Dissertac¸
˜
ao
(Mestrado em Matem
´
atica Aplicada)–Instituto de
Matem
´
aticada.
Wang, F., Liao, F., Li, Y., Yan, X., and Chen, X. (2021). An
ensemble learning based multi-objective evolutionary
algorithm for the dynamic vehicle routing problem
with time windows. Computers & Industrial Engi-
neering, 154:107131.
ICEIS 2024 - 26th International Conference on Enterprise Information Systems
312
