
Web Service-Based Capacitated Smart Vehicle Routing Problem with
Time Window and Threshold Waste Level for Home Health
Care Industry
Kubra Sar and Pezhman Ghadimi
Laboratory for Advanced Manufacturing Simulation and Robotics, School of Mechanical & Materials Engineering,
University College Dublin, Belfield, Dublin, Ireland
Keywords: Web Service Interface, Vehicle Routing Problem, Waste Collection, Home Health Care Industry.
Abstract: In response to the significant rise of Home Health Care (HHC) due to technological advances, an expanding
elderly demographic, and increased disease outbreaks—intensified by the COVID-19 pandemic—there is a
pressing demand for better management of the resulting medical waste. This paper explores the development
of a web-based decision support system designed to optimize medical waste collection in the HHC sector.
The system is built using Flask for backend processes, with a user interface crafted from HTML and CSS,
and employs JSON files for data management. It features dynamic routing enabled by two metaheuristic
algorithms: the Strength Pareto Evolutionary Algorithm (SPEA-2) and the Non-Dominated Sorting Genetic
Algorithm (NSGA-II). The application supports real-time adjustments to vehicle routes and waste production
sites, enhancing the efficiency of medical waste management by minimizing human intervention. The design
allows for easy adaptation to different sectors and can be expanded to test various scenarios.
1
INTRODUCTION
The Traveling Salesman Problem (TSP) is a well-
known optimization problem in combinatorial
mathematics and operations research, wherein a
salesman is tasked with visiting a set of cities exactly
once, and then returning to the starting city, all while
minimizing the total travel distance or cost
(Applegate, 2006). Building upon the foundation of
TSP, the VRP expands the scenario by introducing
multiple vehicles and demands in each node. In this
context, the objective is to design optimal routes for
each vehicle so that every node's demand is met and
the overall operational costs are minimized
(Hoffman, Padberg, & Rinaldi, 2013). Since Dantzig
and Ramser (1959) first introduced the VRP in 1959,
it has seen extensive application across various fields,
initially concentrating on forward logistics and
subsequently expanding to include reverse logistics
operations. The waste collection process represents a
key area within the scope of reverse logistics,
focusing on optimizing routing strategies (Kubra Sar
& Pezhman Ghadimi, 2023). Medical waste
collection has emerged as a critical research topic
within waste management, gaining increased
significance in the wake of COVID-19 (Babaee
Tirkolaee & Aydın, 2021; Ghannadpour, Zandieh, &
Esmaeili, 2021; Govindan, Nasr, Mostafazadeh, &
Mina, 2021). Recently, the generation points of
medical waste have extended beyond hospitals and
healthcare institutions to encompass the growing
domain of home health care (HHC) services (K. Sar
& P. Ghadimi, 2023). This development has
introduced challenges in establishing robust
coordination between decision-makers and system
entities compounded by rising uncertainty and
complexity. While the literature abounds with
mathematical models addressing the waste collection
routing problem, there is a distinct need for practical
studies that offer sustainable and efficient routing
plans capable of adaptively responding to the
uncertainties of market conditions. In their
comprehensive literature review, Vitorino de Souza
Melaré, Montenegro González, Faceli, and Casadei
(2017) highlighted the critical need for an intelligent
Decision Support System (DSS) in the waste
management area. They argue that such a system is
essential for improving the efficiency, sustainability,
and effectiveness of waste collection routing
processes. Therefore, Burton Watson and John Ryan
Sar, K. and Ghadimi, P.
Web Service-Based Capacitated Smart Vehicle Routing Problem with Time Window and Threshold Waste Level for Home Health Care Industry.
DOI: 10.5220/0012640000003758
Paper published under CC license (CC BY-NC-ND 4.0)
In Proceedings of the 14th International Conference on Simulation and Modeling Methodologies, Technologies and Applications (SIMULTECH 2024), pages 185-191
ISBN: 978-989-758-708-5; ISSN: 2184-2841
Proceedings Copyright © 2024 by SCITEPRESS – Science and Technology Publications, Lda.
185

(2021) introduced a web application interface
designed to generate and showcase dynamic, resilient
routes. This interface adapts to changes in the system
by accessing updated data. The fluctuating nature of
waste accumulation and disposal sites, which evolve
rapidly over time, can be effectively captured and
demonstrated through a practical study involving the
design of a web interface application. The
autonomous and dynamic features of web interface
systems enhance the management of waste collection
routes robustly by adjusting the number of vehicles
required, driver assignments, and collection
schedules. In practical scenarios, factors like travel
times impacted by traffic congestion, quantities of
waste at generation points, and the locations of waste
generation introduce significant fluctuation in
resource planning within the context of DSS. Gasque
and Munari (2022) asserted that web interface
applications serve as highly effective tools for aiding
decision-making processes related to pickup and
delivery tasks and can also be utilized as a framework
for different versions of the vehicle routing problem.
Traditional vehicle routing models are unable to
facilitate efficient and accurate decision-making
processes due to their inherent limitations in
responding to systemic changes on time.
Consequently, a new decision support system
which is a web interface application tool has been
introduced in this study to accommodate changes in
various factors, including travel time, the volume of
waste to be collected, and waste generation points,
while dynamically presenting routes to the drivers
(users) in the HHC sector for the first time
2
LITERATURE REVIEW
The VRP modelling research was first introduced in
the literature in 1959, and since then, numerous
studies have been published on various domains
(Dantzig & Ramser, 1959). As of 1974, research
efforts have been directed towards addressing the
VRP specifically within the context of waste
collection (Beltrami & Bodin, 1974). In more recent
times, to guarantee the practicality of these research
efforts, studies related to web interface application
development have been undertaken (Nacakli, Guzel,
& Zontul, 2022). These web frameworks initially
designed to handle the dynamic demands and
uncertainties of forward logistics, are now gradually
being incorporated into reverse logistics, though in a
more limited scope.
In the realm of logistics optimization, recent
studies have demonstrated innovative applications of
web-based tools combined with advanced algorithms.
Moeini and Mees (2021) addressed the Kindergarten
Tour Planning Problem (KTTP), an adaptation of the
classic traveling salesman problem, using heuristic
methods and a web application featuring FLASK,
MySQL, Bootstrap, Leaflet, JavaScript, and jQuery,
focusing on minimizing total distance with datasets of
10 to 100 children. Nacakli et al. (2022) developed a
variant of the vehicle routing problem for a lift and
escalator service using algorithms like MaxRects and
Dijkstra's, and crafted a web interface with Flask,
React.js, and Leaflet for route visualization. Both
studies highlight the synergy between algorithmic
problem-solving and practical, real-time web
applications in addressing complex logistical
challenges.
It emerges from the review of related literature
that there is a scarcity of studies on innovative
decision support systems for VRP, especially web-
based interfaces, with most research centred on
forward logistics. This study addresses this shortfall
by offering a Flask-based web user interface for a
sophisticated vehicle routing model dedicated to
waste collection, known as SCVRPTW-TWL.
3
METHODOLOGY
To address the medical waste collection challenges
within the HHC sector, this study introduces an
innovative SCVRPTW-TWL model that embodies all
aspects of sustainability: reducing travel time,
lowering carbon emissions, and diminishing
customer dissatisfaction. Uniquely, this study
ventures beyond traditional VRP models in medical
waste collection by incorporating customer
satisfaction and travel time as new social and
economic objectives, respectively. Moreover,
leveraging Internet of Things (IoT) advancements,
the TWL concept has been applied to monitor waste
levels, enabling smarter routing by avoiding
superfluous stops. Furthermore, a Google API
distance tool for traffic congestion-based real travel
time was integrated, allowing for the formulation of
more precise and timely routing plans, benefiting
from the integration of real data. In this section, an in-
depth analysis of the SCVRPTW-TWL model is
provided and detailed insights into the NSGA-II and
SPEA-2 metaheuristic solution techniques are
elucidated. Furthermore, a comprehensive overview
of the web interface application is given.
SIMULTECH 2024 - 14th International Conference on Simulation and Modeling Methodologies, Technologies and Applications
186

3.1 Mathematical Model
The relevant notations used in our work are shown in
Table 1-3.
Table 1: Sets and Descriptions.
Sets Description
C Set of collection centres C={1,2,3...c}
H Set of customer house H={1,2,3...h}
N Set of all collection points, including depot
N = (C∪𝐻
)
={1,2,3...n, n+1 depot={0}
A
Set of arcs, A={(i,j)| i,
j
∈ 𝑁, i≠
𝑗
}
K
Set of vehicles, V={1,2...k}
T Set of trips T={1,2...t}
Table 2: Parameters and Descriptions.
Parameters Unit Description
𝑄
kg Vehicle capacity
𝑄
kg Customer house capacity
𝑄
kg Collection centre capacity
𝑞
kg
The amount of waste at collection site
i ∈ 𝑁
𝑡
minutes
Travel time of vehicle k on arc (i,j ) ∈
𝐴
𝑑
meter Transportation distance of vehicle k
on arc (i,j ) ∈ A
𝐿𝑇
minutes
Latest service end time at collection
points j ∈ 𝑁 without causing penalty
cos
t
𝑠
minutes Service time at vertex j for vehicle k
𝑠
𝐷
minutes
minutes
Service time at vertex i for vehicle k
The time limit that vehicle k can
operate
𝑒
kg. CO
/L
emission coefficient
kg/L
Amount of fuel consumed per km
when the car is fully empty
kg/L Amount of fuel consumed per km
when the car is fully loaded
𝑃
kg/L Amount of fuel consumed per minutes
when the car is running on idle
𝑐
Penalty score
𝑀
Sufficiently large number
Table 3: Decision Variables and Descriptions.
Decision
Variables
Description
𝑥
Binary variable with a value of 1 if arc (i,j) is
traversed of vehicle k on trip t, 0 otherwise
𝑧
Binary variable with a value of 1 if vehicle k
performs trip t, 0 otherwise
𝑠𝑡
Arrival time of vehicle k at vertex i ∈ N
𝑠𝑡
Arrival time at the next vertex j for vehicle k
𝑄
the load on vehicle k after leaving node j
𝑄
the load on vehicle k upon arrival at node i
The SCVRPTW-TWL model encompasses a
network of nodes labelled N = {0,1,2,3...n, n+1},
spread across various locations. Central to the system
are depot points at nodes 0 and n+1, with the
intervening nodes representing collection points that
accumulate medical waste. The developed VRP
model introduces three objective functions designed
to assess the waste collection issue from social,
economic, and environmental viewpoints. The daily
waste generation at each point triggers the collection
service when it surpasses 70% of its capacity—a
threshold informed by previous studies (Akhtar,
Hannan, Begum, Basri, & Scavino, 2017; Facchini,
Digiesi, & Vitti, 2021; Faccio, Persona, & Zanin,
2011; Hannan et al., 2018; Wu, Yang, & Tao, 2020).
3.1.1 Objective Function 1: Minimization
Travel Time
Research commonly emphasizes reducing travel
distance for its economic advantages, but in VRP
scenarios, the least distance may not translate to the
most efficient path due to varying traffic conditions.
Addressing this, the present study shifts the focus
toward minimizing the total travel time (outlined in
Equation-1), which is a more accurate economic
indicator for solving the SCVRPTW-TWL challenge.
The Google Distance Matrix API is utilized for
calculating travel times, allowing for adjustments
based on current traffic patterns.
𝑚𝑖𝑛 𝑍
=
∑∑∑∑
𝑥
.𝑡
(1)
3.1.2 Objective Function 2: Minimization
Total Emission
In the field of logistics, cutting down on carbon
emissions is a key concern. The study's second
objective function aims to lower total carbon
emissions, which correlate with the distance that
vehicles travel, and vary with the type of vehicle and
the fuel it uses. The model also accounts for
emissions generated during travelling (in Equation
2a), as well as when vehicles idle (Equation 2b) at
collection points. For a comprehensive calculation of
emissions, both during travel and idling, the formula
provided by Xiao, Zhao, Kaku, and Xu (2012) (in
Equation 2) is applied, an aspect that is often
neglected in such analyses. The study ensures that
emissions from idling at collection points are
incorporated into the total emission figures for a more
accurate assessment.
𝐶
=
∑∑∑∑
(
𝑄
)𝑑
𝑥
𝑒
(2a)
𝐶
=
∑∑∑
𝑥
𝑠
𝑃
𝑒
(2b)
min 𝑍
= 𝐶
+ 𝐶
(2)
Web Service-Based Capacitated Smart Vehicle Routing Problem with Time Window and Threshold Waste Level for Home Health Care
Industry
187

3.1.3 Objective Function 3: Minimization
Social Risk
Recent research indicates that from an economic
perspective, it's advantageous to target only locations
where waste levels exceed 70% in routing plans for
waste collection. However, this approach might lead
to customer dissatisfaction due to significant waste
accumulation. To strike a balance between economic
efficiency and social benefit, this study suggests
using soft time windows to give priority to areas such
as where waste levels surpass 90%, especially during
the first hour of collections. If these time windows are
missed, penalty scores are applied to reflect the
heightened social risk, though these penalties are only
incurred for late arrivals, not for arriving early. This
strategy to mitigate customer dissatisfaction is
defined as the third objective function in our model,
detailed in Equation 3, where the penalty score is
specifically outlined. The detailed equation
description is shown in Equation 3a.
𝑆
= 𝑐
∑∑∑
𝑥
,
max {𝑡
−𝐿𝑇
),0}
(3a)
𝑚𝑖𝑛 𝑍
= 𝑆
(3)
3.1.4 Constraints
∑∑∑
𝑥
=1 𝑖𝑓 𝑞
≥𝑄
70% 𝑗 =1,2,…,𝑁 (4)
∑∑∑
𝑥
=1 𝑖𝑓 𝑞
≥𝑄
70% 𝑗 =1,2,…,𝑁 (5)
∑
𝑥
=
∑
𝑥
𝑡 = 1,2, … , 𝑇 𝑘 = 1,2, … , 𝐾 (6)
𝑄
≥𝑄
+ 𝑞
−ℳ1 −
∑
𝑥
𝑗 =1,…,𝑁 (7)
𝑄
≤𝑄
𝑖, 𝑗 =0,…,𝑁 𝑘 =1,…𝐾 𝑡 =1,…,𝑇 (8)
∑∑
(𝑡
,
+ 𝑠
𝑥
≤𝐷
(9)
∑
𝑥
= 𝑧
𝑘 = 1,…,K t = 1,…,T (10)
∑∑
𝑥
≤
𝑧
𝑘 =1,…,𝐾 t = 1,…,T (11)
𝑠𝑡
+ 𝑡
+ 𝑠
−ℳ
1 −𝑥
≤𝑠𝑡
𝑖, 𝑗 =1,…,𝑁 𝑘 =1,…,𝐾. (12)
𝑥
=0,1 𝑎𝑛𝑑 𝑧
=0,1 𝑖, 𝑗 =0,…,𝑁 𝑘 =1,…,𝐾 (13)
𝑠
≥ 0 𝑖 =0,…,𝑁 𝑘 =1,…𝐾 (14)
Constraints (4) and (5) provide that every point with
waste over 70 % of its capacity must be visited and
these visits must be made by only one vehicle.
Constraint (6) is a flow balance constraint. In this
way, a vehicle visiting a point can leave that point
once the collection has been completed. Constraint
(7) ensures that the vehicle capacity is calculated on
the route. Constraint (8) provides that the load of the
vehicle does not exceed its capacity on the route.
Constraint (9) ensures that the sum of all travel and
service times for each vehicle over its entire set of
trips does not exceed the vehicle's allowable
maximum duration of operation. Constraint (10)
allows all vehicles to start the route from the depot.
Constraint (11) ensures that only active vehicles are
allowed to make customer visits. Constraint (12)
calculates the vehicle arrival time in each collection
point. Constraint (13) defines the binary decision
variable. Constraint (14) defines the characteristics of
continuous variable.
3.2 Solution Algorithm
This study employed NSGA-II and SPEA-2
algorithms for multi-objective optimization. NSGA-
II, developed by Deb, Pratap, Agarwal, and
Meyarivan (2002) involves steps like initializing a
random solution population, ranking solutions based
on performance, using crowding distance for even
Pareto solution distribution, generating new solutions
through mutation and crossover, and selecting the
best solutions iteratively until a set number of
iterations is reached. SPEA-2, introduced by Zitzler,
Laumanns, and Thiele (2001), follows a similar
process starting with an initial population, evaluating
fitness, updating an external set with non-dominated
solutions, using binary tournament selection,
applying genetic operations for new populations, and
iterating until a termination condition, such as
reaching a maximum number of generations, is met.
The algorithms were evaluated using both small and
medium-sized datasets. It was concluded that NSGA-
II offers a quicker response for web-based
applications and is, therefore, better suited for
practical research applications.
3.3 Web Interface
This web interface application as a decision support
system designed for route optimization in waste
collection uses metaheuristic algorithms, NSGA-II,
and SPEA-2, to provide decision-makers with
optimized paths. These algorithms, particularly
NSGA-II for its swift responses in the web
application, are selected for practical efficacy. With
an emphasis on scalability, the system permits the
integration of further algorithms and supports
different vehicle fleets. The interface operates on
real-time data through JSON files and has been
rigorously tested with varying data sizes to ensure
robustness. The web application architecture is
comprised of three layers (can be seen in Figure 1):
the Interface Layer for user interaction, the Technical
Layer for data processing, and the Data Resources
Layer for data storage. This structure ensures a
seamless flow from user input to the display of
actionable outputs.
SIMULTECH 2024 - 14th International Conference on Simulation and Modeling Methodologies, Technologies and Applications
188
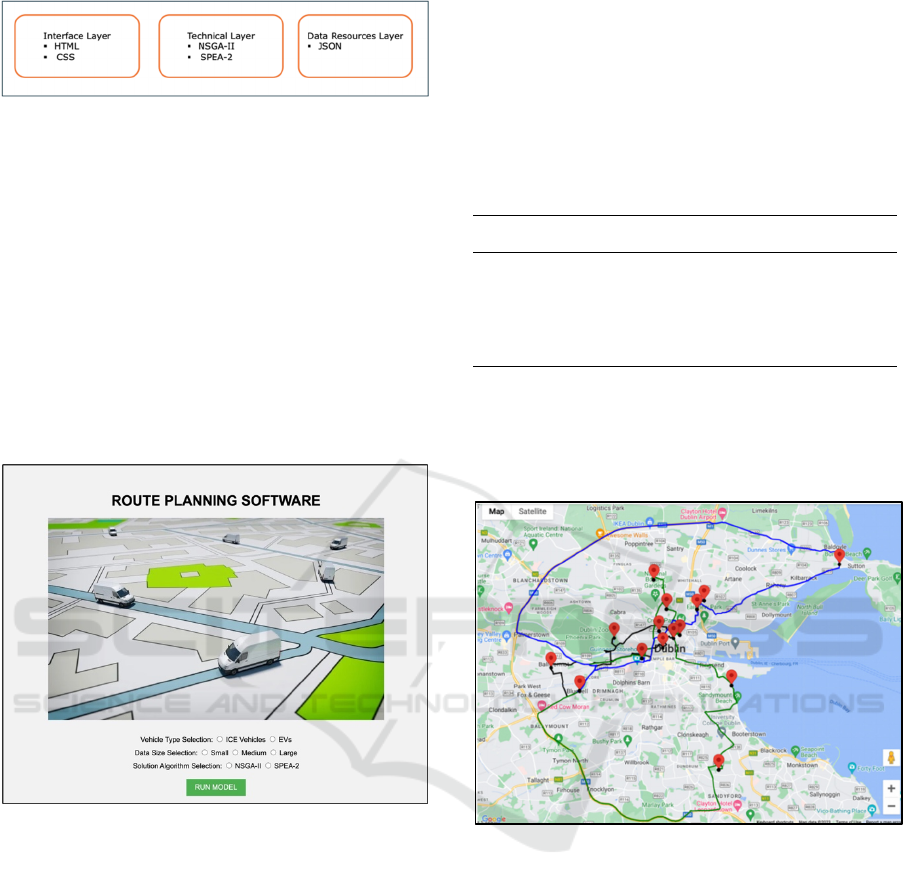
Figure 1: Web Application Layer.
The Flask framework underpins the web application,
offering a flexible and efficient methodology for
addressing VRP. The application structure
accommodates both GET and POST requests,
handling input data and leveraging algorithms to find
near-optimal routes, balancing multiple objectives.
Visualization of results is achieved through Google
Maps and Folium, with interactive maps that depict
the optimized routes, aiding in the practical
evaluation of routes. This user-friendly interface (can
be seen in Figure 2) simplifies complex optimization,
democratizing access to advanced routing tools for
sustainable and efficient logistics.
Figure 2: Overview of web application user interface.
In terms of design, the front-end utilizes HTML for
structure, CSS for styling, and JavaScript for dynamic
functionality. The "/vehicle-routing-result" route is a
core feature, presenting mapped results and
performance metrics. This system marks a leap in
making practical VRP solutions integrated with
metaheuristic optimization.
4
COMPUTATIONAL RESULTS
The model was evaluated using datasets of varying
sizes, including small datasets consisting of 20 nodes
and medium datasets consisting of 50 nodes. The
initial focus is on the results obtained from the small
dataset. The routing plan included 14 out of the 20
nodes dataset because they met the necessary
thresholds. The problem of routing, which was
approached from the perspectives of social,
economic, and environmental factors, was
successfully solved within a short time by employing
NSGA-II and SPEA-2. The information in Table 4
suggests that completing the routes within the
working hour needs one vehicle.
Table 4: Small dataset route information.
Vehicle id Route id Nodes
Trip route
time
CPU
Vehicle 1 Route 1
0-6-1-7-8-0 106.93
minutes
2.52
second
Route 2
0-3-19-16-15-
2-0
147.22
minutes
Route 3
0-17-18-11-14-
20-0
141.42
minutes
The real map presented in Figure 3 illustrates the
three necessary trips to visit the points in the small
dataset, with each of the black, green, and blue lines
representing the respective route for each trip.
Figure 3: Small dataset route demonstration on the real
map.
There are 50 data points in the medium dataset
indicating various amounts of waste. Out of these, 35
points have exceeded the 70% threshold and are
considered for the routing plan. The model has
determined that 6 optimal routes are needed to
effectively manage waste based on social, economic,
and environmental factors, and has indicated that 2
vehicles are necessary to carry out these routes. Table
5 presents detailed information regarding the
specifics and travel times for each of the proposed
routes.
Web Service-Based Capacitated Smart Vehicle Routing Problem with Time Window and Threshold Waste Level for Home Health Care
Industry
189
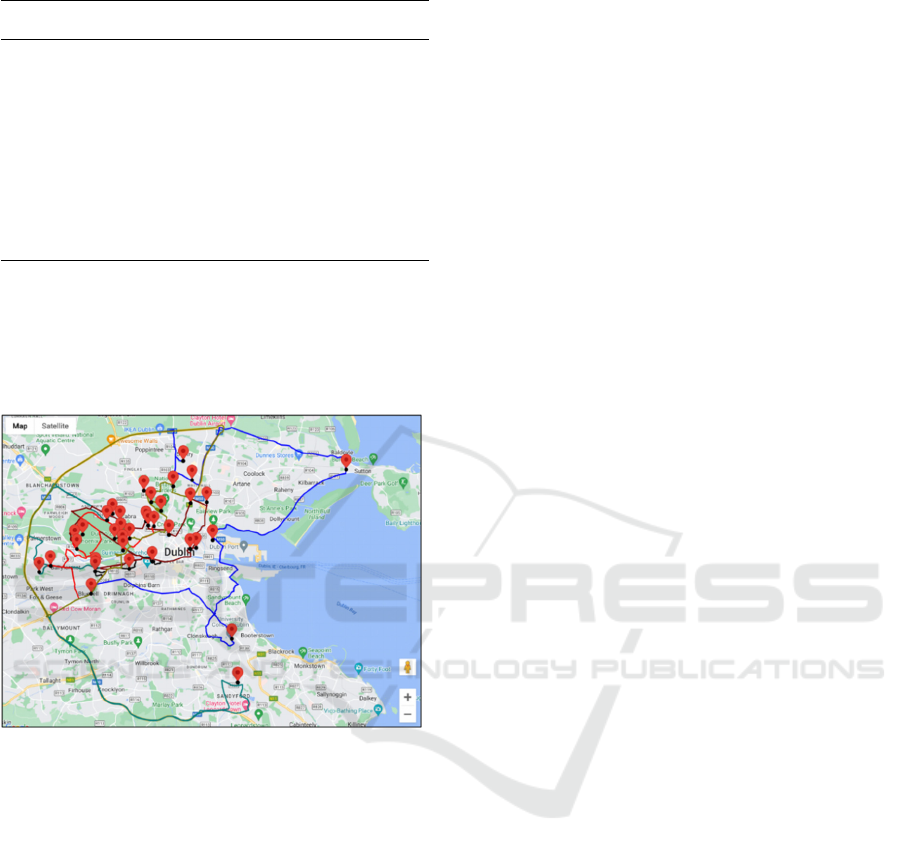
Table 5: Medium dataset route information.
Vehicle id Route id Nodes
Trip route
time
CPU
Vehicle 1
Route 1 0-45-9-43-17-2-
31-0
98.25
minutes
3.42
second
Route 2 0-12-42-16-4-28-
8-0
144.18
minutes
Route 3 0-39-1-25-50-5-0 237.27
minutes
Vehicle 2
Route 1 0-7-21-40-32-24-
0
166.28
minutes
Route 2 0-22-20-38-36-
44-48-34-0
193.73
minutes
Route 3 0-14-6-23-15-47-
30-0
92.08
minutes
The actual routes for each vehicle are depicted in
Figure 4, with the routes in red, olive, and blue
representing the first vehicle, and the routes in
maroon, teal and black representing the second
vehicle.
Figure 4: Medium dataset route demonstration on the real
map.
4.1 Theoretical and Managerial
Implications
This practical study introduces an innovative method
for addressing the waste collection routing issue by
integrating live data, including waste collection
frequencies, traffic updates, and customer positions
through a web interface application. This developed
interface helps establish robust coordination between
those making decisions and the system parameters.
Also, it enhances efficiency by minimizing manual
intervention, saving both time and money, while also
reducing the likelihood of human errors. The results
are presented with easy-to-understand map visuals
and the ultimate figures of the objective function,
highlighting a shift towards more automated
processes. While the system is built to operate in real-
time based on user inputs, its efficiency was evaluated
using two distinct-size datasets. Across all datasets,
the outcome, including the routing map and objective
function details, was generated, and displayed within
a timeframe of under 30 seconds. While this web-
based application is tailored to the waste collection
needs of the HHC sector, its adaptable design allows
it to cater to the waste collection challenges of various
other sectors with slight adjustments.
The developed web interface features one of the
most comprehensive mathematical models developed
for waste collection routing. This model incorporates
a range of constraints and parameters such as waste
threshold levels, real-time travel duration, integration
of all sustainability concerns, and multiple vehicle
and trip options, offering solutions for different
vehicle fleets. The advancement of this web interface
elevates its theoretical impact by offering an array of
selectable parameters and leveraging cutting-edge
solution algorithms, all built upon one of the most
detailed mathematical models for waste collection
routing. This interface streamlines the decision-
making process, making it quicker and devoid of
errors with minimal human input. Moreover, it offers
a cost-benefit, enhances the quality of service, and
improves the ability to adapt to changing variables.
5
CONCLUSION
In this research, the medical waste collection routing
problem was addressed by integrating it with the
SCVRPTW-TWL mathematical model for HHC
context. NSGA-II and SPEA-2 metaheuristics
solution algorithms were employed to examine the
problem from environmental, social, and economic
perspectives. Also, a web interface application-based
decision support system that was developed using
Flask was proposed for problem-solving. This
application aims to transcend a purely theoretical
framework, offering practical implications as well.
The dynamism introduced by variables like solution
algorithm, number of vehicles, and vehicle capacity
has enhanced the study's alignment with real-world
scenarios. Furthermore, by integrating travel time
parameters—sourced from the Google API distance
matrix and adjusted for traffic conditions—into the
model, a closer approximation to real-world
conditions was achieved.
Future research could involve augmenting current
metaheuristic solution algorithms or incorporating
innovative algorithms into the interface as additional
options. The inclusion of diverse or hybrid vehicle
fleets is also feasible. Given its adaptable
architecture, the system can easily be tailored to meet
SIMULTECH 2024 - 14th International Conference on Simulation and Modeling Methodologies, Technologies and Applications
190

various waste collection challenges with minor
adjustments. Additionally, for future work, the
potential to add new objective functions will be
explored. Time windows could evolve from fixed
parameters to dynamic factors through a customer-
user interface, creating a more flexible and responsive
model.
ACKNOWLEDGEMENTS
This work is supported by The Ministry of Education
of Turkish Republic in the content of 1416 Higher
Education Law under grant ID:
ZYPN5T3990HWQ7Z.
REFERENCES
Akhtar, M., Hannan, M. A., Begum, R. A., Basri, H., &
Scavino, E. (2017). Backtracking search algorithm in
CVRP models for efficient solid waste collection and
route optimization. Waste Management, 61, 117-128.
doi:10.1016/j.wasman.2017.01.022
Applegate, D. L. (2006). The traveling salesman problem:
a computational study (Vol. 17): Princeton university
press.
Babaee Tirkolaee, E., & Aydın, N. S. (2021). A sustainable
medical waste collection and transportation model for
pandemics. Waste Management and Research,
39(1_suppl), 34-44. doi:10.1177/0734242X211000437
Beltrami, E. J., & Bodin, L. D. (1974). Networks and
vehicle routing for municipal waste collection.
Networks, 4(1), 65-94.
Burton Watson, R., & John Ryan, P. (2021). Visualization
and Waste Collection Route Heuristics of Smart Bins
Data using Python Big Data Analytics. Paper presented
at the 2021 The 4th International Conference on
Software Engineering and Information Management.
Dantzig, G. B., & Ramser, J. H. (1959). The truck
dispatching problem. Management science, 6(1), 80-91.
Deb, K., Pratap, A., Agarwal, S., & Meyarivan, T. (2002).
A fast and elitist multiobjective genetic algorithm:
NSGA-II. IEEE Transactions on Evolutionary
Computation, 6(2), 182-197.
Facchini, F., Digiesi, S., & Vitti, M. (2021). Waste
collection with smart bins and residual capacity
forecasting: The case of an Apulia Town. Paper
presented at the 2021 29th Mediterranean Conference
on Control and Automation, MED 2021.
Faccio, M., Persona, A., & Zanin, G. (2011). Waste
collection multi objective model with real time
traceability data. Waste Management, 31(12), 2391-
2405. doi:10.1016/j.wasman.2011.07.005
Gasque, D., & Munari, P. (2022). Metaheuristic, models
and software for the heterogeneous fleet pickup and
delivery problem with split loads. Journal of
Computational Science, 59. doi:10.1016/j.jocs.2021.
101549
Ghannadpour, S. F., Zandieh, F., & Esmaeili, F. (2021).
Optimizing triple bottom-line objectives for sustainable
health-care waste collection and routing by a self-
adaptive evolutionary algorithm: A case study from
tehran province in Iran. Journal of Cleaner Production,
287. doi:10.1016/j.jclepro.2020.125010
Govindan, K., Nasr, A. K., Mostafazadeh, P., & Mina, H.
(2021). Medical waste management during coronavirus
disease 2019 (COVID-19) outbreak: A mathematical
programming model. Computers and Industrial
Engineering, 162. doi:10.1016/j.cie.2021.107668
Hannan, M. A., Akhtar, M., Begum, R. A., Basri, H.,
Hussain, A., & Scavino, E. (2018). Capacitated vehicle-
routing problem model for scheduled solid waste
collection and route optimization using PSO algorithm.
Waste Management, 71, 31-41. doi:10.1016/j.was
man.2017.10.019
Hoffman, K. L., Padberg, M., & Rinaldi, G. (2013).
Traveling salesman problem. Encyclopedia of Opera-
tions research and Management science, 1, 1573-1578.
Moeini, M., & Mees, L. (2021). Automated Tour Planning
for Driving Service of Children with Disabilities: A
Web-Based Platform and a Case Study. Paper presented
at the Computational Logistics: 12th International
Conference, ICCL 2021, Enschede, The Netherlands,
September 27–29, 2021, Proceedings 12.
Nacakli, I., Guzel, S., & Zontul, M. (2022). Web Service-
Based Two-Dimensional Vehicle Pallet Loading with
Routing for a Real-World Problem. Paper presented at
the 2022 International Conference on Theoretical and
Applied Computer Science and Engineering
(ICTASCE).
Sar, K., & Ghadimi, P. (2023, 19-22 June 2023). A bi-
objective Smart Capacitated Vehicle Routing Problem
with Threshold Waste Level for the Home Health Care.
Paper presented at the 2023 IEEE International
Conference on Engineering, Technology and
Innovation (ICE/ITMC).
Sar, K., & Ghadimi, P. (2023). A Systematic Literature
Review of the Vehicle Routing Problem in Reverse
Logistics Operations. Computers & Industrial
Engineering, 109011.
Vitorino de Souza Melaré, A., Montenegro González, S.,
Faceli, K., & Casadei, V. (2017). Technologies and
decision support systems to aid solid-waste
management: a systematic review. Waste Management,
59, 567-584. doi: https://doi.org/10.1016/j.wasman.
2016.10.045
Wu, H., Yang, B., & Tao, F. (2020). Optimization of
vehicle routing for waste collection and transportation.
International Journal of Environmental Research and
Public Health, 17(14), 1-26. doi:10.3390/ijerph17
144963
Xiao, Y., Zhao, Q., Kaku, I., & Xu, Y. (2012). Development
of a fuel consumption optimization model for the
capacitated vehicle routing problem. Computers &
Operations Research, 39(7), 1419-1431.
Zitzler, E., Laumanns, M., & Thiele, L. (2001). SPEA2:
Improving the strenth Pareto evolutionary algorithm.
TIK report, 103.
Web Service-Based Capacitated Smart Vehicle Routing Problem with Time Window and Threshold Waste Level for Home Health Care
Industry
191
