
Predicting Students’ Final Exam Scores Based on Their Regularity of
Engagement with Pre-Class Activities in a Flipped Classroom
Teodor Sakal Francišković
a
, Ana Anđelić
b
, Jelena Slivka
c
, Nikola Luburić
d
and Aleksandar Kovačević
e
Department of Computing and Control Engineering, Faculty of Technical Sciences, University of Novi Sad,
Trg Dositeja Obradovića 6, Novi Sad, Serbia
Keywords: Learning Analytics, Learning Strategies, Flipped Classroom, Learning Traces, Machine Learning.
Abstract: Flipped Classroom (FC) is an active learning design requiring the students to engage in pre-class learning
activities to prepare for face-to-face sessions. Identifying FC learning behaviors that lead to academic success
remains a challenge. This paper addresses this challenge by conducting an empirical study in an undergraduate
software engineering course employing the FC model. The empirical study draws on the data from an
intelligent tutoring system that captured the learning traces of students performing pre-class activities. These
traces provided indicators of students’ regularity of engagement, which were then matched to their final exam
scores. Regression models were trained to predict final exam scores based on the regularity of engagement
indicators. Students were clustered based on their regularity of engagement indicators to uncover actionable
feedback for future course iterations. The case study confirms the generalizability of earlier findings that the
regularity of engagement is vital for student performance and that course-specific predictors significantly
impact the models’ prediction performance.
1 INTRODUCTION
Learning analytics (LA) is the process of collecting
and analysing data about learners and their contexts
to enhance the learning experience (Long and
Siemens, 2011). By applying LA, we may explain
unexpected learning behaviours, detect
misconceptions and misplaced effort, identify
successful learning patterns, introduce appropriate
interventions, and increase users’ awareness of their
actions and progress (Mangaroska Giannakos, 2018).
This study focuses on applying LA to analyse how
students’ learning strategies affect their final exam
scores in the flipped classroom (FC) course design.
FC is an active learning design where the students
are tasked with pre-class learning activities that they
need to complete before attending face-to-face
sessions (Bergmann and Sams, 2012). Students’ self-
regulation during pre-class learning activities is
a
https://orcid.org/0009-0000-5747-6390
b
https://orcid.org/0009-0005-4969-6517
c
https://orcid.org/0000-0003-0351-1183
d
https://orcid.org/0000-0002-2436-7881
e
https://orcid.org/0000-0002-8342-9333
critical for their success in the FC learning design
(Jovanović et al., 2019). However, identifying FC
learning behaviours that lead to academic success
remains a challenge.
Researchers have used self-regulated learning
indicators to predict final exam success (Martínez‐
Carrascal et al., 2020; Huang et al., 2020; Hasan et
al., 2020; Yoo et al., 2022; Jovanovic et al., 2019;
Jovanović et al., 2021). However, the findings of
different studies are inconsistent regarding the
models’ prediction performance and the most
significant indicators for the models’ performance.
Therefore, researchers call for more empirical
research using quantitative observational data to
identify FC learning behaviours that are significant
for academic success (Yoo et al., 2022). This study
aims to lessen this research gap by exploring the
generalisability of the regularity of engagement
indicators proposed in Jovanović et al. (2019) and
Sakal Franciškovi
´
c, T., AnÄ
´
Seli
´
c, A., Slivka, J., Luburi
´
c, N. and Kova
ˇ
cevi
´
c, A.
Predicting Students’ Final Exam Scores Based on Their Regularity of Engagement with Pre-Class Activities in a Flipped Classroom.
DOI: 10.5220/0012681800003693
In Proceedings of the 16th International Conference on Computer Supported Education (CSEDU 2024) - Volume 2, pages 97-107
ISBN: 978-989-758-697-2; ISSN: 2184-5026
Copyright © 2024 by Paper published under CC license (CC BY-NC-ND 4.0)
97

Jovanović et al. (2021) to a different blended FC
learning context. We explore whether these indicators
can generate actionable insights to help students in
self-regulated learning.
This paper presents an empirical study conducted
in a blended FC third-year software engineering
course. During the course, students performed pre-
class activities using our Intelligent Tutoring System
(ITS)
6
(Luburić et al., 2022) that recorded their
actions (learning traces). From these learning traces,
we extracted the regularity of engagement indicators
proposed in (Jovanović et al., 2019) and (Jovanović
et al., 2021), which we adapted and extended for the
learning context specific to this study. Students’
regularity of engagement indicators were then
matched to their scores on the final exam
administered on paper at the end of the course.
We examine how regularity of engagement
influences final exam performance by:
• Training different regression models to
predict final exam scores and examining the
feature importance of the best-performing
model.
• Performing K-means clustering to identify
and analyse the groups of students with
similar learning habits.
This study narrows the research gap in
understanding the impact of students’ FC learning
strategies on their academic success by providing
more empirical evidence using quantitative
observational data. Utilizing a novel dataset
generated in a different learning context and learning
domain, this study validates the generalisability of the
findings by Jovanović et al. (2019) and Jovanović et
al. (2021):
• It confirms that both engagement and the
regularity of engagement are crucial for
student performance.
• It demonstrates that predictors specific to the
course significantly impact the model’s
performance.
• The performance of the best-performing
regression model is comparable to that of
Jovanović et al., (2019; 2021).
Our clustering analysis identified four meaningful
clusters of students, uncovering advice about learning
strategies that can be used as feedback.
This paper is organized as follows. Section 2
reviews the existing research. Section 3 presents the
methodology. Section 4 showcases and discusses the
results. Section 5 analyses the threats to the validity
of this study. Section 6 concludes the paper.
6
https://github.com/Clean-CaDET/tutor
2 BACKGROUND WORK
This study considers the FC context. The aim of the
study is to explore how students' interactions with
pre-class activities impact their success on the final
exam. In the literature, this problem is treated either
as supervised (Section 2.1) or unsupervised (Section
2.2). Supervised approaches trained classification
(Martínez‐Carrascal et al., 2020; Huang et al., 2020;
Hasan et al., 2020) or regression (Yoo et al., 2022;
Jovanovic et al., 2019; Jovanović et al., 2021) models
and analysed the models’ feature importance to
uncover factors significantly impacting the exam
performance prediction. Unsupervised approaches
used clustering (Jovanović et al., 2017; Pardo et al.,
2016; Walsh and Rísquez, 2020) to uncover groups of
students with similar learning behaviours and
strategies.
2.1 Supervised Models
Martínez‐Carrascal et al. (2020) predicted whether a
student would fail or pass the blended FC first-year
engineering course. As predictors, they considered
the behavioural indicators measuring how well the
students performed assigned activities, constraining
the timeframe to the course’s early stages. The
indicators included online (e.g., number of login
days), offline (e.g., percentage of class attendance),
and pre-existing (e.g., number of times previously
enrolled) activities. They identified at-risk students
based on their early course activities with
approximately 70% accuracy. They found student
engagement to be a critical factor for success,
regardless of its form (class attendance or online
activities), especially for first-time enrolled students.
Huang et al. (2020) tackled the binary
classification problem of predicting at-risk students
based on indicators inferred from learning traces,
categorized into self-learning, discussion, practice,
video viewing, quiz engagement, and ebook reading.
They evaluated their approach using seven datasets
from three universities’ online courses. They
achieved accuracy in the 60 to 90% range, where the
most significant indicators were participating in
online discussions and online practice.
Hasan et al. (2020) predicted whether the student
would pass or fail a blended FC course using
indicators based on video learning analytics (e.g., no.
of times video was played), students’ activity (e.g.,
time spent on Moodle platform off and on campus),
students’ academic information (e.g., plagiarism
CSEDU 2024 - 16th International Conference on Computer Supported Education
98

count, module attempts count, cumulative grade
points average). The study consisted of 772 students
who attended a sixth-semester e-commerce course.
The best-performing classifier was random forest,
achieving an accuracy of 88.3%. The most significant
indicators proved to be the number of times a video
was played, the student having a high failure rate in
the same module, and marks obtained in coursework
throughout the semester.
In a fully online FC context, Yoo et al. (2022)
aimed to uncover the most impactful learning
behaviour indicators and the best-performing ML
model for predicting the students’ final exam scores
(a regression problem). They extracted 159 learning
behavior indicators. Some were extracted from LMS
trace data (e.g., video watch time), and some were
collected through voluntary questionnaires (e.g.,
student demographics and grades). The study
included 242 students enrolled in the fully online
undergraduate class Measurement and Evaluation, 5
of whom were excluded due to not taking the final
exam. The most impactful behavior indicators were
multiple viewings of the first and second videos
before class, multiple viewings of videos with
unfamiliar content, attitudes toward the course,
students’ gender, the number of clicks on the learning
materials, the number of quizzes taken, and the
frequencies of mobile video watching. They achieved
a 5.5 RMSE (RMSPE of 15.7%).
Jovanović et al. (2019) emphasized that there is
limited empirical evidence on the association
between students’ regularity of engagement with pre-
class activities and their learning performance. They
collected learning trace data for a blended first-year
engineering FC course to address this issue as a
regression problem. They proposed generic (i.e.,
course-design-agnostic) and context-specific (i.e.,
course-design-specific) indicators of the regularity of
engagement. Their findings indicate that context-
specific indicators are essential for predicting the
students’ final exam performance. Additionally, the
more regularly students engaged with their pre-class
activities throughout the course, the higher their final
exam performance. Their R
2
score on different course
offerings varied between 0.12 and 0.24 when using
only generic indicators. Combining generic indicators
with context-specific indicators increases the R
2
scores to a range of 0.30 to 0.38.
Later, Jovanović et al. (2021) expanded their
study to multiple blended FC medical courses. This
study considered internal and external conditions as
factors affecting the learning process. They found that
when the variability in external conditions is largely
controlled (the same institution, discipline, and
nominal pedagogical model), students’ internal state
was the key predictor of their course performance.
Using the regularity of engagement indicators
extracted from individual courses to predict final
exam scores (a regression problem), they achieved a
low R
2
ranging from 0.03 to 0.05. However, by
analysing data from multiple courses via a mixed-
effect linear model, they increased R
2
to 0.72.
2.2 Unsupervised Models
Pardo et al. (2016) considered a 13-week-long
blended first-year undergraduate Introduction to
Computer Systems course. They collected self-
regulated learning variables of 145 students through
self-report questionnaires (affective, cognitive, and
motivational aspects), logged LMS interactions, and
their final marks. Hierarchical clustering uncovered
two groups of students. The “low self-regulated and
low-achieving” group comprised 83 students with
lower ratings on self-efficacy, intrinsic motivation,
positive self-regulated strategy use, higher ratings on
test anxiety, and negative self-regulated strategy use.
This group of students achieved lower academic
performance than the "high self-regulated and high-
achieving”, which comprised 62 students with
opposing variable values.
Jovanović et al. (2017) considered a blended FC
first-year undergraduate course in computer
engineering. They collected learning traces from
online lecture preparation activities to separate
students based on their learning habits. They
identified five groups of students. The smallest group
consisted of “intensive” students, who were most
active and successful on the final exam. These
students predominantly focused on reading materials
and summative exercises. The second group consisted
of “strategic” students focused primarily on
completing the assessment activities. “Strategic”
students were less active than “intensive” students yet
did not have significantly lower exam scores. “Highly
strategic” students were unique in their low level of
engagement and had exam results similar to those of
the “intensive” and “strategic” students. The largest
cluster was the “selective” students who
predominantly focused on summative assessments
while experimenting with other learning strategies.
Their activity level and their final exam scores were
low. Finally, the “highly selective” student group,
almost exclusively focused on summative
assessments, achieved the lowest final exam score.
Walsh and Rísquez (2020) accounted for factors
beyond students’ interaction with the LMS, such as
gender and native language. They considered a
Predicting Students’ Final Exam Scores Based on Their Regularity of Engagement with Pre-Class Activities in a Flipped Classroom
99
blended FC knowledge management course. The
course had 38 postgraduate students enrolled, 24 of
whom were native speakers. Twenty students were
male, and eighteen of them were female. The authors
used two clustering models, both of which yielded
five clusters. Both models found that the worst-
performing students were non-native females, and the
best-performing students were native students.
Students who accessed lessons regularly before class
performed better in the final exam than those who did
not. The most successful strategy was accessing the
lessons before class and near the weekly exam.
2.3 Research Gap
More empirical research using quantitative
observational data is needed to identify FC learning
behaviours that are significant for academic success
(Yoo et al., 2022).
FC requires self-regulated learning, which
researchers typically measure through students’
interactions with an LMS. However, these measures
have shown inconsistent effects on student
achievement (Jovanović et al., 2021). The findings of
different studies are inconsistent regarding the
prediction performance of final exam success. Results
of Jovanović et al. (2019) and Huang et al. (2020)
showed that prediction performance of final exam
scores in different course offerings varies when using
the same indicators of regularity and engagement.
Jovanović et al. (2019) hypothesize that the lack
of replicable outcomes can be attributed to learning
context specificities. Their later work (Jovanović et
al., 2021) further confirmed this hypothesis. They
found that accounting for internal and external
conditions on multiple course offerings increased the
𝑅
to 0.72 from 0.03-0.05 when using only indicators
of regularity of engagement. They concluded that the
complex interplay of various factors leads to
variability in applying a pedagogical model, thus
negatively affecting the replicability of prediction
results. They concluded that accounting for learning
context is essential for interpreting LA results.
This study aims to narrow this research gap by
exploring the generalisability of the regularity of
engagement indicators proposed in (Jovanović et al.,
2019) and (Jovanović et al., 2021) to a different FC
learning context. The goal is to explore whether these
indicators can generate actionable insights to help
students in self-regulated learning.
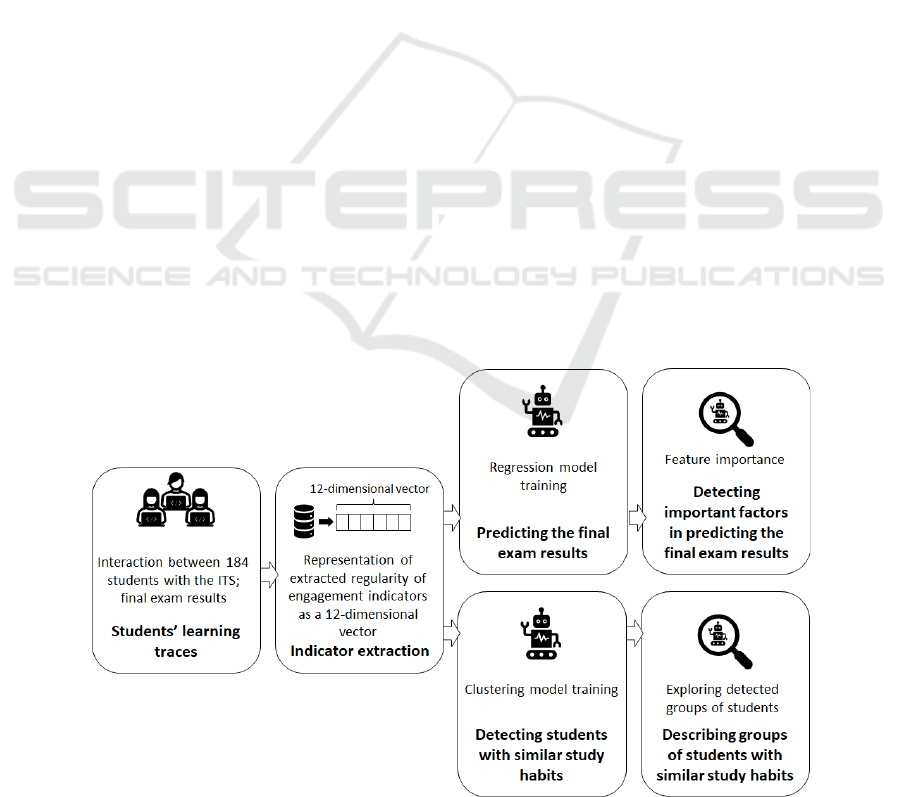
3 METHODOLOGY
The overview of this study is presented in Figure 1.
Our case study is a blended FC third-year software
engineering project-based learning course at a public
university. The data was collected from 2023. course
offering that lasted for 14 weeks. The course was
attended by 184 students without prior experience
with the FC model.
The course’s theoretical foundations were
presented online (via an ITS), while in-person
sessions were dedicated to the course project. This
study aims to predict students’ scores on the final
exam that tests their understanding of the course’s
theoretical foundations. Therefore, learning traces are
Figure 1: An overview of the methodology.
CSEDU 2024 - 16th International Conference on Computer Supported Education
100

the sole data source considered for predicting students'
final exam performance. The study included 110
students who attempted the final exam. Since the final
exam was not mandatory, other students either did not
attempt it or planned to attempt it at a later date.
The ITS that presented the course’s theoretical
foundations (Luburić et al., 2022) is grounded in the
Knowledge-Learning-Instruction framework
(Koedinger et al., 2012). The course was organized
into nine knowledge units, each comprised of
multiple Knowledge Components (KC). Each KC
consisted of a set of instructional items followed by a
sequence of assessment items that included multiple-
choice, short-answer, and multiple-response
questions. The ITS logged learning traces, i.e.,
students’ interactions with KCs.
To pass a KC, the student must obtain a
predefined level of mastery (correctness for all
assessment items). The ITS provides hints when the
student’s answer is incorrect. The ITS presents the
next assessment item if the student fails to answer
correctly after multiple hints. The ITS will later
present such unsolved instructional items to the
student after the student attempts to solve all
instructional items at least once. We set a KC-specific
minimal interaction time the student must spend
interacting with its instructional and assessment items
to mitigate cheating. Students were externally
incentivised to pass the assigned KCs by the imposed
deadlines. Students’ final course grades were affected
if they failed to meet the set deadlines twice.
Each student’s learning traces were represented as
a feature vector suitable for applying ML models
(Table 1). We adopted the indicators of engagement
regularity proposed by Jovanović et al. (2019) and
Jovanović et al. (2021) as features, adapting and
extending them for our study context (Section 3.1).
Using the extracted feature vectors:
• We trained regression models to predict the
students’ final exam scores. We analysed
feature importances to determine which
engagement regularity indicators are crucial
for the model’s predictive performance.
Section 3.2 presents this experiment.
Table 1: Features used in our study for ML model training.
Indicator Description
weekly_session_entropy The entropy of weekly sessions. Adopted from (Jovanović et al, 2019).
daily_session_entropy The entropy of daily sessions. Adopted from (Jovanović et al, 2019).
no_weeks_with_above_
avg_sesssion_counts_1st_half
Number of weeks in the first half of the semester where the number of sessions is
above average. Adapted from (Jovanović et al, 2019).
no_weeks_with_above_
avg_session_counts_2nd_half
Number of weeks in the second half of the semester where the number of sessions
is above average. Adapted from (Jovanović et al, 2019).
weekly_session_proportions_mad
Median absolute deviation of weekly session proportions. Adapted from (Jovanović
et al, 2019).
no_pattern_changes Each week, a student's likelihood of studying on a specific weekday is calculated as
a vector of percentages of the number of daily sessions. Then, the student's
variation in a learning pattern is calculated as a mean squared difference between
consecutive weeks. For each student, we calculate the number of times the variation
was significant (i.e., exceeded the threshold set as the third quartile for values
across all students). Adopted from (Jovanović et al, 2019).
no_top_quartile_active_days_
in_a_week
Number of weeks where the number of active days is above the third quartile value.
Adapted from (Jovanović et al, 2019).
total_normalized_session_length Total normalized session duration in seconds. Adapted from (Jovanović et al,
2021).
session_length_entropy Entropy of session length. Adapted from (Jovanović et al, 2021).
overall_kc_ratio
The average ratio of expected to actual time spent on each KC. Specific to our
study.
passed_kcs Number of passed KCs. Specific to our study.
correctness_ratio The average number of unsuccessful attempts at working on a KC before passing it.
Specific to our study.
Predicting Students’ Final Exam Scores Based on Their Regularity of Engagement with Pre-Class Activities in a Flipped Classroom
101

• We performed K-means clustering to identify
groups of students with similar learning
strategies. We analysed the learning
strategies exhibited in each cluster and linked
them to the average final exam score obtained
by students in that cluster. This analysis
helped us identify successful and
unsuccessful learning strategies and generate
recommendations that can be provided to
students of the next generation. Section 3.3
presents this experiment.
3.1 Feature Representation: Regularity
of Engagement Indicators
The engagement regularity indicators used as ML
model features in this study are listed in Table 1. The
study context is similar to those of Jovanović et al.
(2019) and Jovanović et al. (2021). Therefore, we
adopted the regularity of engagement indicators
proposed in those studies, adapting and extending
them for our context.
Jovanović et al. (2019) reported that adding
context-specific indicators improved their model’s
performance. Unfortunately, we could not use the
context-specific indicators they proposed due to the
differences in our contexts. In their setting, students
could choose whether to interact with formative
assessment items, and their frequency of using
different learning item types (e.g., instructional
videos and MCQs) varied. In contrast, our students
needed to complete all KC-related items to pass the
KC. However, the number of attempts at passing the
KC, time spent completing the KCs, and the number
of passed KCs could vary, resulting in three indicators
specific to this study.
The adaptations of indicators adopted from
Jovanović et al. (2019) and Jovanović et al. (2021)
arise due to the differences of our definitions of
midterm and study session.
Most courses at our university require students to
pass colloquiums to qualify for the final exam. These
colloquiums typically occur around mid-semester,
after which a significant decline in participation in all
optional class activities is often observed, as students
tend to devote their time to other commitments.
Therefore, although our class did not have an explicit
midterm exam, we decided to include separate
features for the first and second halves of the semester
to account for this pattern.
In our context, the start of the session is defined
as a student starting or resuming working on a KC,
and the end is defined as a student idling (3 minutes
of inactivity) or terminating the session. In our data,
the end of the session typically matched the passing
of the KC. Jovanović et al. (Jovanović et al., 2019)
defined the session as “a continuous sequence of
events where any two consecutive events are no more
than 15 minutes apart”. In a later study (Jovanović et
al., 2021), they defined the session as “a continuous
sequence of learning actions where the time gap
between any two consecutive actions is below the 85
th
percentile of the time gaps between two successive
learning actions within the given course”.
3.2 Predicting the Final Exam Score
Each feature vector was labelled with the student’s
final exam score, ranging from 0 to 20 points. The
dataset was split into training (75%) and test (25%)
sets by performing random stratified sampling.
Exploratory data analysis was performed on the
training set. We removed 12 outliers (out of 82
instances) by performing the Interquartile Range
method combined with manual inspection. The
daily_session_entropy feature was removed, due to
its high correlation with other features. Logarithmic
and square root transformations of feature values
were performed so that they approximate the normal
distribution. Finally, z-normalization was performed.
We experimented with the following regression
models: linear regression, decision tree, support
vector machine, elastic net, gradient boosting,
random forest (RF), K-Nearest Neighbours, and
Huber regression. Optimization of the models'
hyperparameters was conducted using stratified 5-
fold cross-validation with a grid search strategy. As
the optimization goal, the 𝑅
metric was used.
The best-performing model on the test set was
evaluated using 𝑅
and RMSE metrics. Feature
importance was evaluated for the best-performing
ML model.
3.3 Identifying Groups of Students
with Similar Learning Strategies
Clustering was performed on the whole dataset using
feature representations from Table 1. The final exam
score was not used as a feature for clustering. Instead,
after clustering students according to their learning
strategies, the average final exam score of students
was calculated in each cluster to analyse how learning
strategies are linked to academic performance.
Exploratory data analysis resulted in the same
preprocessing steps in Section 3.2. We removed 12
outliers (out of 110 instances) by performing the
Interquartile Range method combined with manual
inspection. We performed K-means clustering and
CSEDU 2024 - 16th International Conference on Computer Supported Education
102

determined that the optimal number of clusters is
four, using the elbow method combined with manual
analysis of the resulting clusters.
4 RESULTS AND DISCUSSION
This session presents and discusses the results of
using regression models to predict the final exam
score (Section 4.1) and identifying groups of students
with similar learning strategies (Section 4.2).
4.1 Predicting the Final Exam Score
In the performed experiments, the RF regression
model outperformed other regression models. RF
achieved 0.1 R
2
and 3.73 RMSE (18.6% RMSE
percent error) on the test set. Though the achieved R
2
is low, RMSE shows that our model can predict the
final exam score relatively accurately. As shown by
Shalizi (2015), the R
2
does not measure the goodness
of the fit and is not a good measure of the model’s
predictability.
It is hard to compare these results to those
obtained in other studies as other models were trained
and evaluated on other datasets. However, to put
these results into context, we overview the
performances reported in other studies in Table 2.
Table 2: Comparison of the performance of our approach to
results reported in related studies.
R
2
RMSPE
Our stud
y
0.1 18.6%
Jovanović et al. (2019)
Generic indicators
0.12-0.24 \
Jovanović et al. (2019)
Generic and Context-specific
indicators
0.3 – 0.38 \
Jovanović et al. (2021)
Mixed effect model
0.72 \
Jovanović et al. (2021)
Fixed effect model
0.03-0.05 \
Yoo et al.
(
2022
)
\ 15.7%
Jovanović et al. (2019) achieved slightly better
results (0.12 – 0.24 R
2
) when using generic indicators
of regularity. Their model’s better performance could
be attributed to context differences – indicators
calculated in the first half of the semester were not
found to be significant in this study (Table 3). We also
could not include the context-specific indicators they
proposed due to the differences in our contexts
(Section 3.1). Other factors influencing the
performance differences might be different course
domains and differences in age and experience of
students attending them - Jovanović et al. (2019)
performed their study on the first-year course in
computer engineering, while this study was
performed on the third-year course focusing on
software design.
Jovanović et al. (2021) achieved an R
2
of 0.72
using their proposed indicators of engagement
regularity. Their better performance may be attributed
to multiple reasons. Firstly, their dataset was
significantly larger, comprising 50 course offerings of
15 different courses with 50 students on average.
Such data can be analysed using mixed-effect linear
models that capture fixed and random effects.
However, when using fixed effects models (trained
using only indicators of students’ engagement with
online learning activities, as in our setting), their
performance drops to R
2
between 0.03 and 0.05,
which is worse than our performance. Another factor
influencing the performance difference could be that
they considered a different discipline (medicine).
Yoo et al. (2022) achieved a slightly lower
RMSPE of 15.7%. Better performance of their model
may be attributed to their inclusion of student-specific
variables, such as gender and attitudes, collected
through personalized surveys. Additionally, their
context differed from ours as they considered a fully
online flipped classroom and a different discipline.
Jovanović et al. (2019) and Jovanović et al.
(2021) only considered linear models in their
experiments. As Yoo et al. (2022), we found RF to be
the best-performing ML model.
Feature (indicator) importance scores are
presented in Table 3. In this experiment,
session_length_entropy (whether a student maintains
consistent learning session durations) was the most
important indicator. This finding is aligned with
(Jovanović et al., 2021), who also found this as the
strongest indicator. Similarly, as (Jovanović et al.,
2021), we found weekly_session_proportions_mad,
weekly_session_entropy, and the
normalized_session_length important factors in
predicting final exam scores.
The correctness_ratio indicator specific to this
study was the third most important indicator,
implying it is important how many times students
unsuccessfully perform their pre-class exercises
before passing the KC. In contrast, the
overall_kc_ratio did not appear to be a significant
indicator, which indicates that it did not matter how
much time students spent studying and completing
KCs if they passed them. The passed_kcs indicator
was not a significant predictor, which could be
Predicting Students’ Final Exam Scores Based on Their Regularity of Engagement with Pre-Class Activities in a Flipped Classroom
103

attributed to most students completing all pre-class
activities.
The least significant indicators were those
associated with the number of sessions in the first and
second part of the semester. These results imply that
it did not matter how many weekly sessions students
had throughout the semester but rather that those
sessions concluded in a completed KC. This result
partially aligns with the results of Jovanović et al.
(2019) - they found the number of weekly sessions
after the midterm insignificant; however, the number
of weekly sessions before the midterm proved to be a
significant factor in the earliest course offering. This
could be attributed to the fact that our university does
not have a strictly defined midterm, and students do
not perceive the semester as two separate entities;
rather, they view it as a single unit.
Table 3: Feature (indicator) importance scores.
Indicator Score
session_length_entropy 0.157
weekly_session_proportions_mad 0.148
correctness_ratio 0.138
normalized_session_length 0.119
weekly_session_entropy 0.097
no_pattern_changes 0.076
passed_kcs 0.069
overall_kc_ratio 0.068
no_top_quartile_active_days_in_a_week 0.055
no_weeks_with_above_avg_session_counts_
2nd_half
0.046
no_weeks_with_above_avg_session_counts_
1st_half
0.023
In summary, the performance of our regression
model is comparable to the performances of models
trained on single-course data (Jovanović et al., 2019;
Yoo et al., 2022) and the performance of the fixed
effects model from (Jovanović et al., 2021). The
analysis of important factors for predicting the final
exam performance in this case study confirms the
findings of Jovanović et al. (2019) and Jovanović et
al. (2021) that not only engagement but also the
regularity of engagement is crucial for student
performance. This study also confirmed that context-
specific predictors (e.g., correctness_ratio)
significantly influence the model’s performance. This
case study showed that the findings of Jovanović et
al. (2019) and Jovanović et al. (2021) also generalise
to a different context, such as a higher academic year
and a different field of study.
4.2 Identifying Groups of Students
with Similar Learning Strategies
We identified four groups of students with similar
learning strategies. The average (normalised)
indicator values for each cluster are presented in
Table 4. The number of students in each detected
cluster is presented in Table 5. Analysing the average
indicator values from Table 4, detected clusters can
be described as follows:
Cluster 1 – Idlers (4, 4.1%): Students from this
cluster performed poorly on the final exam. They
were inactive throughout the whole semester. They
took much longer than expected to complete their pre-
class exercises. They had not passed most of the KCs.
Their session length was inconsistent, and they
changed their work patterns frequently. High
correctness_ratio shows they struggled with the
exercises.
Table 4: Average indicator values in identified clusters.
Indicator (and final points) Cluster 1 Cluster 2 Cluster 3 Cluster 4
session_length_entropy -1.27 -0.07 0.76 -1.05
weekly_session_proportions_mad -0.50 0.76 0.15 -1.30
correctness_ratio 0.46 0.41 -0.60 0.40
normalized_session_length 0.40 0.25 0.28 -0.94
weekly_session_entropy -0.15 0.90 -0.63 -0.14
no_pattern_changes 0.36 0.05 0.11 -0.33
passed_kcs -4.22 0.25 0.28 -0.07
overall_kc_ratio 1.08 -0.20 -0.18 0.42
no_top_quartile_active_days_in_a_week -0.91 0.33 0.38 -0.99
no_weeks_with_above_avg_session_counts_2nd_half -0.52 0.73 -0.84 0.56
no_weeks_with_above_avg_session_counts_1st_half -0.29 0.12 0.01 -0.14
final_points -1.51 0.16 0.06 -0.07
CSEDU 2024 - 16th International Conference on Computer Supported Education
104

Cluster 2 – High-achievers (32, 32.6%): Students
from this cluster were the best-performing students.
They were active throughout the whole semester,
especially in its second half. These students
completed their pre-class activities faster than
students from other clusters. They have passed most
of the KCs but struggled slightly with the exercises.
These findings imply that these students are fast
learners. Their session lengths were inconsistent, but
their weekly session engagement was consistent,
which is additionally supported by a minimal number
of pattern changes.
Cluster 3 – Initially engaged (40, 40.8%): These
students had slightly above-average final exam
performance. They were active in the first half of the
semester and inactive in the second half. These
students performed their pre-class activities fast and
did not struggle with the exercises. Their work in the
second half of the semester could be explained by
procrastination. A high number of active days could
explain their active first half of the semester and few
active days at the end of the semester. These students
passed all KCs. They changed their patterns of
learning frequently but had a consistent session
length.
Cluster 4 – Latecomers (22, 22.5%): These
students achieved a slightly lower-than-average final
exam performance. They were inactive in the first
half of the semester and became active in the second
half. They performed their exercises longer than
expected and struggled with them, which could be
explained by their later course engagement. They
were not consistent with their session lengths. These
students completed about 2/3 of the exercises.
Table 5: Numbers of students in each cluster.
Cluster No. of students
in the cluste
r
Average score on
the final exa
m
Idlers 4 3.26
High-
achievers
32 16.57
Initially-
en
g
a
g
e
d
40 13.29
Latecomers 22 10.05
Sum 987 \
A comparison of identified groups (clusters) of
students revealed differences in the final exam score
regarding the generic regularity of study indicators.
Students who consistently engaged in exercises
throughout the semester generally outperformed
those who did not. The results suggest that early
7
We removed 12 students out of 110 as outliers (Section
3.3)
engagement with course materials led to higher
grades on the final exam. Greater consistency in
weekly session durations and the number of weekly
sessions correlated with improved exam outcomes.
Additionally, a high number of completed exercises
was a significant factor in achieving higher exam
scores.
Pardo et al. (2016) drew a similar conclusion.
They identified two clusters of students, where one
represented “high self-regulated and high achieving”
students, and the other “low self-regulated and low
achieving” students. The students from the first
cluster tended to be more consistent with their work
habits and interacted with the course platform more
often throughout the semester; they achieved better
final exam results than those in the second cluster.
Jovanović et al. (2017) clustered students based
on their learning strategies and activity levels. They
concluded that the variety of learning strategies used,
the frequency with which students changed strategies,
and overall student activity influenced final exam
scores. Students who exhibited low activity levels
performed worse on the final exam compared to those
who were either selective in their strategy use or had
high activity levels, a finding that aligns with our
conclusions.
Although Walsh and Rísquez (2020) accounted
for the factors beyond students’ interaction with the
LMS, one of their findings was that the students who
accessed materials regularly before classes performed
better on the final exam than those who did not, which
is on par with our conclusions.
Based on our findings, we intend to provide the
following recommendations to students:
• We warn the students if we detect that their
study activity decreased in the last few weeks.
• We motivate the students to be active from
the beginning of the semester.
• If their session lengths and session counts are
inconsistent on a weekly basis, we suggest
they try working more consistently.
• We suggest that students pass all available
exercises before the exam.
5 THREATS TO VALIDITY
We measured the regularity of engagement indicators
using data collected via an ITS. There is a risk that the
measurements do not accurately represent theoretical
Predicting Students’ Final Exam Scores Based on Their Regularity of Engagement with Pre-Class Activities in a Flipped Classroom
105

constructs of interest. For example, a session pauses
when a student is idle for three minutes. However,
there is a possibility that the student is taking a longer
time to think about how to approach a task. Similarly,
we considered a session concluded if the student
closed the application; however, the application
might have crashed. We counted how many KCs
students have passed. However, cheating is possible
(e.g., searching for the answers online or getting help
from other colleagues).
Regarding our conclusions’ correctness, our
interpretation of indicators proposed by Jovanovic et
al. (2019) and Jovanović et al. (2021) might have
been wrong. We also based our conclusion on a single
train/test split for model fitting and evaluation.
The study was conducted on a third-year
undergraduate software engineering course at a public
university. The attendees of this course were students
of similar age and experience who had no experience
with FC. We cannot confidently claim that the acquired
results generalise to other learning domains or students
who have more proficiency in self-regulated learning
or attend differently structured courses.
6 CONCLUSIONS
This case study examined how the regularity of
students’ engagement with pre-class activities in FC
influenced their final exam performance. This study
contributes to lessening the research gap in
understanding how students’ FC learning behaviours
influence their exam success by providing more
empirical research using quantitative observational
data and showing the generalisability of the regularity
of engagement indicators proposed in Jovanović et al.
(2019) and Jovanović et al. (2021) to a different
blended FC learning context. We further explored
whether these indicators can generate actionable
insights to help students in self-regulated learning.
Research by Jovanović et al. (2021) and Yoo et al.
(2022) showed that student-specific indicators, such
as their attitude toward learning, can influence
students’ final exam performance. Thus, our future
work will investigate how students’ learning
emotions, attitudes, and values impact their
performance.
ACKNOWLEDGMENT
This research has been supported by the Ministry of
Science, Technological Development and Innovation
(Contract No. 451-03-65/2024-03/200156) and the
Faculty of Technical Sciences, University of Novi
Sad through the project “Scientific and Artistic
Research Work of Researchers in Teaching and
Associate Positions at the Faculty of Technical
Sciences, University of Novi Sad” (No. 01-3394/1)
REFERENCES
Gašević, D., Kovanović, V., & Joksimović, S. (2017).
Piecing the learning analytics puzzle: A consolidated
model of a field of research and practice. Learning:
Research and Practice, 3(1), 63–78.
Hasan, R., Palaniappan, S., Mahmood, S., Abbas, A.,
Sarker, K., & Sattar, M. (2020.). Predicting student
performance in higher educational institutions using
video learning analytics and data mining techniques.
Applied Sciences, 10(11), 3894.
Huang, A., Lu, O., Huang, J., Yin, C., & Yang, S. (2020).
Predicting students’ academic performance by using
educational big data and learning analytics: evaluation
of classification methods and learning logs. Interactive
Learning Environments, 28(2), 206-230.
Jovanović, J., Gašević, D., Dawson, S., Pardo, A., &
Mirriahi, N. (2017). Learning analytics to unveil
learning strategies in a flipped classroom. The Internet
and Higher Education, 33(4), 74-85.
Jovanovic, J., Mirriahi, N., Gašević, D., Dawson, S., &
Pardo, A. (2019). Predictive power of regularity of pre-
class activities in a flipped classroom. Computers &
Education, 134, 156-168.
Jovanović, J., Saqr, M., Joksimović, S., & Gašević, D.
(2021). Students matter the most in learning analytics:
The effects of internal and instructional conditions in
predicting academic success. Computers & Education,
172, 104251.
Koedinger, K. R., Corbett, A. T., & Perfetti, C. (2012). The
Knowledge‐Learning‐Instruction framework: Bridging
the science‐practice chasm to enhance robust student
learning. Cognitive science, 36(5), 757-798.
Long, P., & Siemens, G. (2011). What is learning analytics.
Proceedings of the 1st International Conference
Learning Analytics and Knowledge, LAK, 11.
Luburić, N., Dorić, L., Slivka, J., Vidaković, D., Grujić,
K.G., Kovačević, A. and Prokić, S. (2022), An
Intelligent Tutoring System to Support Code
Maintainability Skill Development. Available at SSRN
4168647.
Mangaroska, K., & Giannakos, M. (2018). Learning
analytics for learning design: A systematic literature
review of analytics-driven design to enhance learning.
IEEE Transactions on Learning Technologies, 12(4),
516-534.
Martínez‐Carrascal, J., Márquez Cebrián, D., Sancho‐
Vinuesa, T., & Valderrama, E. (2020). Impact of early
activity on flipped classroom performance prediction:
A case study for a first‐year Engineering course.
CSEDU 2024 - 16th International Conference on Computer Supported Education
106

Computer Applications in Engineering Education,
28(3), 590-605.
Pardo, A., Han, F., & Ellis, R. (2016). Combining
university student self-regulated learning indicators and
engagement with online learning events to predict
academic performance. IEEE Transactions on
Learning Technologies, 10(1), 82-92.
Shalizi, C.R., 2015. The Truth About Linear
Regression. Online Manuscript. http:///www. stat. cmu.
edu/~ cshalizi/TALR.
Walsh, J., & Rísquez, A. (2020). Using cluster analysis to
explore the engagement with a flipped classroom of
native and non-native English-speaking management
students. The International Journal of Management
Education, 18(2), 100381.
Yoo, J., Rho, M., & Lee, Y. (2022). Online students’
learning behaviors and academic success: An analysis
of LMS log data from flipped classrooms via
regularization. IEEE Access, 10, 10740-10753.
Bergmann, J. And Sams, A. (2012). Flip your classroom:
Reach every student in every class every day.
International society for technology in education.
Predicting Students’ Final Exam Scores Based on Their Regularity of Engagement with Pre-Class Activities in a Flipped Classroom
107
