
An Open-Source Approach for Digital Prostate Cancer Histopathology:
Bringing AI into Practice
Markus Bauer
1,∗
, Lennart Schneider
4,∗
, Marit Bernhardt
4
, Christoph Augenstein
1
, Glen Kristiansen
4
and Bogdan Franczyk
2,3
1
ScaDS.AI, University of Leipzig, Germany
2
University of Leipzig, Germany
3
Wroclaw University of Economics, Poland
4
Institute of Pathology, University Hospital Bonn, Germany
Keywords:
Artificial Intelligence, Vision Transformer, Self-Supervised Learning, Digital Pathology, Prostate Carcinoma.
Abstract:
The histopathological analysis of prostate tissue is challenging due to the required expertise and the inherently
high number of samples. This accounts especially for prostate cancer (PCa) assessment (tumour grading), as
parameters like the Gleason score have high prognostic relevance, but suffer from significant interobserver
variability, mainly due to individual grading practice and experience. AI-based solutions could assist patho-
logical workflows, but their integration into clinical practice is still hampered, as they’re optimised based on
general AI-metrics, rather than clinical relevance and applicability. Moreover, commercial solutions often
provide similar performance than academic approaches, are expensive, and lack flexibility to adapt to new use
cases. We investigate the requirements to provide a flexible AI-based histopathological tissue analysis tool,
that makes the expertise of experienced pathologists accessible to every hospital in a user-friendly, open-source
solution. The proposed software allows for slide inspection, tumour localisation and tissue metric extraction,
while adapting to different use cases using a Python-enabled architecture. We demonstrate the value of our tool
in an in-depth evaluation of transurethral hyperplastic resection tissue (TURP)-chip analysis and PCa grading
using a set of extensively annotated prostate cancer patient cases. Our solution can support pathologists in
challenging cases, fasten routine tasks and creates space for detail analysis.
1 INTRODUCTION
Developing tools for digital pathology of the Prostate
Carcinoma (PCa) involves addressing challenges re-
lated to handling massive gigapixel whole slide im-
ages (WSIs) and ensuring high security and privacy
standards. These tools have significant potential to
enhance pathologists’ work, including the integration
of AI for various attractive use cases. AI-based grad-
ing, exemplified in digital pathology, stands out as
a prominent application. Recent FDA-cleared prod-
ucts and ongoing research highlight the efficacy of
AI methods in grading Prostate Carcinoma (PCa).
Notably, studies demonstrate high accuracy in repli-
cating the histopathological Gleason grading system,
achieving a quadratically weighted κ of over 0.85
(Perincheri et al., 2021; Tolkach et al., 2020; Bul-
ten et al., 2022). The availability of extensive pub-
*
These authors contributed equally to this work.
lic cohorts for PCa WSIs and core needle biopsies
(CNBs) has spurred the development of explainable
algorithms for PCa grading (Zuley et al., 2016; Bul-
ten et al., 2022). Moreover, the emergence of self-
supervised learning (SSL) methods like MoCov2, Di-
nov2, and I-JEPA (Chen et al., 2020; Oquab et al.,
2023; Assran et al., 2023) has facilitated training on
large datasets without the need for time-consuming
labeling procedures. Leveraging architectures like vi-
sion transformers that excel in capturing local-global
feature relationships in images, these approaches re-
duce the effort required for model creation while
achieving state-of-the-art results (Chen and Krishnan,
2021; Lu et al., 2021; Yang et al., 2023). Despite their
effectiveness, such systems are infrequently observed
in pathological practice, primarily due to two factors:
First, current AI solutions lack depth in address-
ing specific problems and often focus on evaluations
by a limited number of medical experts (Eloy et al.,
2023), typically using either small cohorts or address-
Bauer, M., Schneider, L., Bernhardt, M., Augenstein, C., Kristiansen, G. and Franczyk, B.
An Open-Source Approach for Digital Prostate Cancer Histopathology: Bringing AI into Practice.
DOI: 10.5220/0012681900003690
Paper published under CC license (CC BY-NC-ND 4.0)
In Proceedings of the 26th International Conference on Enterprise Information Systems (ICEIS 2024) - Volume 1, pages 729-738
ISBN: 978-989-758-692-7; ISSN: 2184-4992
Proceedings Copyright © 2024 by SCITEPRESS – Science and Technology Publications, Lda.
729

ing superficial problems (e.g., benign vs. “possible”
tumour) (Perincheri et al., 2021). Such approaches
are not easily comparable on a broader scale and
are typically expensive, particularly with commer-
cial providers. State-of-the-art solutions also exhibit
weaknesses in handling ISUP grade groups (c.f. sec-
tion 2.1) 2 and 3 (Bulten et al., 2022). Especially
those grade groups, however, most urgently require
reproducible, computer-aided assistance as they are
known for high inter- and intra-observer variability.
Second, to establish a digital pathology tool, it is
crucial to keep the efforts of integrating it low. Yet,
there is currently no easy-to-integrate open-source
software that enables hospitals to experiment with AI
solutions. Especially, published approaches require
technical expertise that hospitals in rural areas can’t
provide. Factors such as varying digitalisation levels
and preparation practices add to the technical burden
of AI adoption (Kartasalo et al., 2021). For example,
staining differences among hospitals can significantly
impact performance (Singhal et al., 2022), necessi-
tating advanced concepts like self-supervised learn-
ing (Ye and Wang, 2022) or generative models (Park
et al., 2020), which may be impractical for hospitals
lacking machine learning experts. Additionally, exist-
ing inspection tools have limited capabilities of cus-
tomisation and thus lack flexibility to integrate new
use cases, e.g., image stitching or measuring metrics
like the tissue area size.
Hence, in this paper we design a tool that enables
the integration of computer-aided histopathology in
clinical workflows, regardless of the actual use case.
The contribution of our paper is as follows:
• We introduce and discuss the practical require-
ments of integrating automated tissue analysis
into clinical practice. Two use cases are provided
to underline the necessity of these requirements.
• We provide an in-depth investigation of AI’s cur-
rent capabilities in PCa localisation and grading
using a set of patient cases with detailed annota-
tions.
• We present a novel approach to reading and visu-
alising gigapixel images resource-efficiently.
2 METHODS
To implement a concise solution for computer-aided
histopathology, we define multiple functional (F) and
non-functional (NF) requirements. We consider a
broad variety of expert perspectives by incorporat-
ing the thoughts of pathologists of different experi-
ence levels, AI researchers as well as medical data
and database experts. Additionally, we consider the
requirements as presented in (Hor
´
ak et al., 2023). For
our solution, the requirements, and the reason for in-
cluding them are shown in Tab. 1.
2.1 Data and Code Used in this Study
For our evaluation, we collected nine patient WSIs
from a currently collected, private dataset of radi-
cal prostatectomies (RPEs) that have been extensively
annotated. In total, 3875 tumour regions have been
annotated and analysed to emphasise the capabilities
and limitations of AI in detail, rather than only con-
sidering the patient-level result. All cases contained
(as far as being found in the tissue) segmentations for:
Benign Gland, Hyperplasia (subtypes: Benign, Clear
Cell), Gleason Grade 3, 4 (subtypes: cribriform, con-
solidated, malformed, glomeruloid) and 5, Intraep-
ithelial Neoplasia (PIN) (subtypes: low grade, high
grade), Perineural Carcinosis, Seminal Vesicle, Intra-
ductal carcinoma (IDC-P), Immune cells, and, Atro-
phy. In addition to the RPE-WSIs, one real and nine
synthetic TURP-chip examples were included to eval-
uate tissue area measurement (c.f. section 2.3).
To access the malignancy of the WSIs used in this
study, the Gleason grading, an architecture-based sys-
tem, focusing exclusively on shape of tumour glands/
epithelia, was used, together with further annotations
for subtypes of known clinical relevance. Gleason
grading assigns numbers from 1 to 5 to each archi-
tectural pattern, with 5 indicating the most aggres-
sive cancers. In prostate cancer, being morphologi-
cally heterogeneous, the grading combines the most
common and second most common patterns to yield
the Gleason score (e.g., GS 3+4=7). Adjustments
to Gleason grading, originally introduced in 1966,
consider empiric data on prognostically important
factors, leading to specific grading rules for radical
prostatectomies and biopsies and other changes (Ep-
stein et al., 2016). In the revision from 2014, the Inter-
national Society of Urological Pathology (ISUP) has
additionally introduced five prognostically different
Grade Groups to categorise Gleason scores (Epstein
et al., 2016).
2.2 AI-Based Tumour Localisation and
Grading
The first use case to evaluate our proposed solution is
the determination of malignant tissue in RPEs. Re-
lated work typically focuses on detecting or localis-
ing (
:
= detection with position estimate) tumours in
CNBs (Bulten et al., 2022; Perincheri et al., 2021),
as here AI can already lead to significant time-to-
ICEIS 2024 - 26th International Conference on Enterprise Information Systems
730

Table 1: List of requirements that were analysed for this publication.
Requirement Reason
NF #1 Python Compatibility Python must be supported flexibly to make the software suited for di-
verse computer vision use cases.
NF #2 PyTorch Compatibility Pretrained models should be natively loadable to decrease implemen-
tation efforts and ensure flexibility.
NF #3 Visualisation Capabilities Analyses need to be presented in a meaningful overlay or text window,
to avoid information loss.
F #4 Efficiency & Scalability Few computation and storage resources should be used, to allow mid-
tier work station compatibility.
F #5 Maintainability A wide-spread language with, e.g., natively thread-safe operations
should be used to guarantee long-term support and stability of the so-
lution.
F #6 Privacy, Security Data privacy needs to be considered as well as vulnerability of the
technologies used, as hospitals are part of the critical infrastructure.
F #7 Open-Source A desktop-application can be created to impose low technical burden
and thus attract a wide audience.
F #8 Platform Independent The software needs to be available on at least Windows and Linux, to
provide a base for both medical and AI experts.
diagnosis reduction (da Silva et al., 2021). For RPEs,
however, applying AI on one hand has an even higher
value but also requires more practical considerations
due to the large amount of tissue compared to the
CNBs. Hence, we focus on evaluating RPEs.
As digital PCa pathology is a vital research field,
various solutions have been proposed. Earlier works
focus on tissue microarrays and use per-image or
at least on region-level annotations and process the
images using convolutional neural networks (CNNs)
(Arvaniti et al., 2018; Nagpal et al., 2019). These
approaches have the inherent downside of requiring
detailed annotations, which limits the range of avail-
able data significantly. More recent solutions stick
with CNNs like Resnets or Efficientnets (Bulten et al.,
2022), but include a solution to train using the patient-
level label.
This can be done by adding an attention mech-
anism rather than a simple multilayer perceptron as
the model head that efficiently connects the features
Z of multiple smaller parts (patches) of the same WSI
to predict one label. Attention mechanisms were
proposed as part of Transformers (Vaswani et al.,
2017), and compute softmax-normalised attention
scores through the dot product between query (Q)
and key tensors (K). Mathematically, this can be ex-
pressed as
Attention(Q, K,V ) = softmax
QK
T
√
d
k
·Z (1)
with, d
k
as the key tensor’s dimensionality. This al-
lows the model to dynamically assign importance to
different parts of the input sequence, enhancing its
ability to capture intricate relationships during pro-
cessing. While this was found to be an excellent op-
tion in AI-based grading, two issues remain with the
approaches as, e.g., presented by multiple teams in
(Bulten et al., 2022). First, their scenario is still super-
vised and thus limited to labelled cases, which signif-
icantly reduces the amount of available training data.
Furthermore, the use of CNNs results in the need for
visualisation methods such as Grad-CAM (Gildenblat
and contributors, 2021) for locating the actual tumour,
which decreases the inference speed.
A combined solution for addressing both of these
problems lies in SSL training of a vision transformer
(ViT) (Dosovitskiy et al., 2020). Among many
methods recently proposed, contrastive unsupervised
learning is a robust and widespread paradigm de-
signed for training models without explicit labels.
The method revolves around mapping similar in-
stances closer together while pushing dissimilar in-
stances apart, and aims to learn high-dimensional rep-
resentations that effectively capture the underlying
structure of the input data. The loss function em-
ployed is often the InfoNCE (Noise-Contrastive Es-
timation) loss, given by
L = −log
exp(sim(z
i
, z
+
i
))
exp(sim(z
i
, z
+
i
)) +
∑
N
j=1
exp(sim(z
i
, z
−
j
))
(2)
where sim(·, ·) denotes the similarity function, z
+
i
, z
i
,
and z
−
i
represent the positive, anchor and negative
samples, and N represents the total number of neg-
ative samples. Positive samples are generated by im-
age augmentation of the anchor, while negative ones
are defined as all the other images in a batch.
An Open-Source Approach for Digital Prostate Cancer Histopathology: Bringing AI into Practice
731

2.3 TURP-Chip Measuring
Benign Prostatic Hyperplasia (BPH) commonly af-
fects men aged 40 and above, causing obstructive uri-
nary symptoms due to hyperplasia in the prostate’s
transitional zone. The exact cause involves a com-
plex interplay of hormonal, genetic, and environmen-
tal factors, with hormonal changes (e.g., increased es-
trogen, decreased testosterone) assumed to play a ma-
jor role. Clinically, BPH presents as Lower Urinary
Tract Symptoms (LUTS), including hesitancy, incom-
plete emptying, and nocturia.
The primary surgical approach for Benign Pro-
static Hyperplasia (BPH) is transurethral resection of
hyperplastic tissue. Various techniques are used for
tissue retrieval, followed by histological analysis to
confirm the BPH diagnosis and rule out malignancy.
Although prostate cancer (PCa) is relatively rare in
BPH cases, it occurs in approximately 5% of unse-
lected cases due to the typical age of patients that cor-
relates with cancer prevalence.
The pathology laboratory’s analysis of TURP
chips involves fixation, embedding, and sectioning
before microscopic examination. The debate over the
extent of tissue embedding to safely exclude an unsus-
pected prostatic carcinoma has persisted. Approaches
vary from full embedding to selective embedding,
such as using 10 histology cassettes (K
¨
ollermann
et al., 2022). Incidental prostate cancer (iPCa) detec-
tion rates are consistently based on weight analyses
(WA). While WA is an accepted parameter, the size or
number of individual TURP-chips has received lim-
ited attention. Given the significant variation in chip
sizes among surgeons and their preferred methods, we
reason that procedures generating smaller chips may
systematically neglect coexistent carcinoma.
To explore the correlation between iPCa detection
rates and chip sizes, and to assess the distribution of
chip sizes based on surgical techniques, an automated
tissue measurement solution is needed. Hence, we
use this scenario as the second use case and an appli-
cation for flexibly adapting our proposed solution to
new tasks. While clinically highly interesting, from
a computer vision perspective, this task can be auto-
mated with established methods, by implementing an
area measurement component in Python. The WSI
image is loaded, and the pixel resolution is accessed,
which is supplied as an object property in the Python
OpenSlide object. With the image downscaled by a
factor of 64, a pipeline of operations is performed.
First, tissue is segmented using Otsu-
thresholding which creates a binary image (bin).
Smaller/unconnected tissue areas are excluded using
a median filter. Additionally, a cascade of 10 erosion
steps (kernel size 1) is performed on the filtered
image to ensure each individual chip will yield at
least one larger connected region. In the eroded
image, each connected region is then assigned a
unique value. Afterwards, individual regions greater
than 50×50 µm are extracted and enlarged again using
a cascade of 10 dilations (kernel size 1). Finally,
region area size is determined and saved together
with the total area size. The procedure is described in
the pseudocode Alg. 1.
WSI ←X
i, j
;
mppx ←slide.mppx; // slide=OpenSlide obj
mppy ← slide.mppy ; // mpp=µm per pixel
tresh ←otsu(WSI);
bin ← WSI
x,y
: (x, y) ∈ {(x
′
, y
′
) | X[x
′
, y
′
] > 0};
bin ←median(bin, disk(5));
total ← 0;
for i ← 0 to 9 do
bin ← erosion(bin)
end
lbin ←label(bin);
N ← unique(lbinary);
for n ← 0 to N do
obj ← lbin
x,y
: (x, y) ∈ {(x
′
, y
′
) | X[x
′
, y
′
] = n};
size ← |
ob j
n
|;
if size ·mppx ·mppy ≥ 50 ·50 then
part ← clip(obj, 0, 1);
for i ← 0 to 9 do
erosion(bin) part ← dilation(part)
end
partsize ← |part|;
save(partsize);
total ←total + partsize;
end
end
save(total)
Algorithm 1: Algorithm used to count tissue in TURP-
chips.
2.4 Slide Viewer
Loading and inspecting WSIs is a challenging task,
as this requires operating in Gigapixel scales. A
typical image has a size of ≈ 120000 ×80000 pix-
els and requires 2 GB of memory, whereas images
can even be significantly larger. Thus, loading the
image into memory is no viable option. Further-
more, typical pathology workstations don’t provide
top-tier computation resources. Hence, a wide variety
of solutions to visualise and edit WSIs is available.
The type of technology used is extremely heteroge-
nous, ranging from web-based approaches (CodePlex
Foundation and OpenSeadragon contributors, 2009;
Hor
´
ak et al., 2023; Sch
¨
uffler et al., 2022) to Java- or
C++ applications with some exported Python func-
tions (Bankhead et al., 2017; Radboud Computational
ICEIS 2024 - 26th International Conference on Enterprise Information Systems
732

Pathology Group and ASAP contributors, 2009), or
even more experimental setups that leverage gaming
consoles (Yagi et al., 2012) for image processing. Yet,
none of these approaches seemed to cover our require-
ments as most of them require at least a large amount
of RAM and drive storage, and none of these solutions
offers a sufficient compatibility for Python scripts and
PyTorch models. Especially, the web-based applica-
tions would violate requirements #6 and #7 (c.f. Tab.
1), as the underlying JavaScript is not only known for
exposing vulnerabilities that could be a potential risk
for clinics but also doesn’t provide, e.g., typing capa-
bilities which can be disadvantageous for the actual
software development. For (Bankhead et al., 2017)
at least a workaround to incorporate PyTorch models
is available, but it requires manual usage of Groovy
scripts which is inconvenient to use for pathologists,
as well as prone to usage errors, as the scripts can’t be
embedded to the UI but rather use a developer con-
sole.
To implement a viewer supporting the execu-
tion of Python scripts in the Rust programming lan-
guage (Matsakis and Klock II, 2014), we designed a
resource-efficient image loading algorithm, outlined
in a simplified form in Algorithm 2. The code for
this study will be available on GitHub, offering more
detailed insights into the actual implementation. In
the run() function of Algorithm 2, two arrays, cache
and preload cache, are allocated with an example
size of 2048×2048 (twice the viewport). Start po-
sitions and offsets (0, 0) are set, along with an up-
date available variable signalling the completion of
preloading, initialised to false. Note that the latter
is marked with σ when used, indicating its thread-
safe nature to prevent data races. Before the cycle,
an initial image part is loaded into the RAM using
precache update. This routine reads new data to the
preload cache based on the whole slide image and
current position. The capture() functions actively
avoid race conditions. Rust supports similar function-
ality to this pseudocode. Delta positions, coords, are
collected by tracking the user’s dragging of the im-
age. Using a cache offset variable to accumulate these
deltas, parts of the image at the currently dragged po-
sition are read from the RAM and visualised. This op-
eration is fast enough to work without latency. The vi-
sualisation component processes only a viewport part
of the actual cache (arrays allocated in the RAM),
utilising a reference to the cache array. Once the user
drags the image above half the viewport size, new data
is read into the preload cache array using a separate
thread. The function receives a thread-safe reference
to the preload cache array, allowing the user to con-
tinue dragging the image while updates are rendered.
Position shifts are recorded in an additional variable,
preload offset, from this point to correct the start po-
sition once the cache is updated. When the cache limit
is reached, offsets are set/reset, and the preloaded data
is copied to the cache array within the RAM, ensuring
a seamless update without noticeable delays.
Function precache update(ptr, threadskip, pos):
slide; // The OpenSlide image
threadskip.capture();
if ∼threadskip then
update data(slide, ptr, pos);
threadskip ← true;
threadskip.release();
end
Function run():
init(viewportsize, cache, preload cache,
update available, loading started, offset,
cache offset, preload offset, coords);
user inputs ← Φ
x,y
|(x, y) ∈ viewportsize;
precache update(σ(*preload cache),
update available, offset);
sync(*cache, cache offset, σ(*preload cache));
for i ←1 to inf do
delta ← Φ
x
i
,y
i
;
coords ← coords + delta;
cache offset ← cache offset + delta;
if exceeds(viewportsize / 2, cache offset) &
!loading started then
offset ← coords;
thread(precache update(σ(*preload cache),
update available, offset));
loading started ← true;
end
if loading started then
preload offset ← preload offset + delta;
end
if exceeds(viewportsize, cache offset) then
update ready.capture();
cache offset ← preload offset;
preload offset ← 0;
loading started ← false;
sync(*cache, σ(*preload cache))
end
vis(*cache, cache offset, viewportsize)
end
Algorithm 2: A novel algorithm for efficient image region
loading was implemented.
3 RESULTS
The proposed algorithms have been integrated as a
Rust (version 1.75.0) application, as Rust offers great
support for multithreading, type safety, and cross
compilation of executables (Linux and Windows c.f.
Tab. 1 #7&8). For script-support Python3.11 was
used. All PyTorch models used were trained in a grid
search for optimal parameters and cross validated us-
An Open-Source Approach for Digital Prostate Cancer Histopathology: Bringing AI into Practice
733

viewport, cache
Slide Rendering
Python Bridge
Data Loading
Torch Model Lib
Main Application
TURP Measurement
Info View
PCa Heatmap
Python Modules
viewport
overlay
viewport
infos
data
Figure 1: Architectural overview of the tool.
ing data taken from (Zuley et al., 2016) and (Bulten
et al., 2022) before considering them in this work.
Performance measurements of the application were
purposely collected using a regular workstation (In-
tel(R) Core(TM) i7-9750H CPU @ 2.60GHz, 16GB
RAM, 512GB SSD), to be comparable to the actual
application in clinical practice. No GPU was used
during inference time.
The implemented architecture is relatively
lightweight, which on one hand is a result of the
iterative character of this project but also an approach
to comfort requirement #5 by keeping the complexity
as low as possible. Fig. 1 shows a principle schematic
of the software.
The components can be divided into a main ap-
plication and Python modules, whereas both can also
be run independently, which allows a consistent script
behaviour during development and program execu-
tion. Two scripts have been added for this work,
which can predict a heatmap of cancer probability for
a whole slide image or measure the area of the dis-
played tissue. New tools can simply be added as re-
quired.
The main application consists of five components.
The data loading module performs preloading, po-
sition acquisition and cache synchronisation as de-
scribed in Alg. 2. It ensures a latency-free data load-
ing procedure with low memory and disk footprint
(c.f. Tab. 1 #4). The Torch model lib can directly
load a TorchScript-saved AI model and run an infer-
ence cycle on the current viewport (c.f. Tab.1 #2).
Analogously, the Python bridge is the interface for
running Python scripts and transporting data between
it and the application (c.f. Tab.1 #1). It can be used to
run any Python script and return either a dictionary
(”infos”) of infos or a heatmap image (”overlay”).
The slide rendering and info view module visualise
the data, which can be raw or AI-prediction-overlaid
images, as well as text information. The displayed in-
formation can be controlled from within the Python
scripts and thus be adapted for particular use cases
(c.f. Tab. 1 #3).
When testing the viewer, we could not recognise
significant delays when dragging the image. The tests
were run using a 201640×87725 WSI. The only delay
of less than a second happens when zooming in. Fur-
thermore, the memory usage was very low, with only
around 100MB RAM. Tab. 2 provides an overview of
performance metrics of our solution and other view-
ers.
We find our solution to be comparably fast as the
others, while sharing the lowest RAM usage with
xOpat (Hor
´
ak et al., 2023). Only a slight delay can be
recognised when zooming in, which we find accept-
able as a tradeoff for the low resource requirements.
xOpat (Hor
´
ak et al., 2023) runs comparably efficient
but requires beforehand conversion of the data to a
web-compatible format (such as TIFF), resulting in
an unacceptable loading time. ASAP (Radboud Com-
putational Pathology Group and ASAP contributors,
2009) has the lowest CPU utilisation, but, similar to
our solution, shows a light delay when zooming (bet-
ter said when dragging the zoomed version) and has
the highest RAM usage together with QuPath. We
found it difficult to determine the exact RAM amount
required for ASAP, as RAM usage increases while
dragging the image. QuPath has the overall worst
values. From our analysis, we conclude that our so-
lution offers a good mix of the compared solutions’
strengths, while also being more flexible by support-
ing Python.
3.1 TURP-Chip Measuring
As a first evaluation task, TURP-chips were pro-
cessed to measure their individual area using the al-
gorithm described in section 2.3. As a first trial,
we created nine artificial images with patches ran-
domly cropped from an actual RPE image. Evalua-
tion showed that for patches containing Hyperplasia,
multiple instances may be detected, as some tissue ap-
pears disconnected. While this behaviour appears un-
expected for RPE-WSIs, it is desired for TURP-chip-
WSIs as here even smaller chips with few distance to a
larger tissue area should be detected separately. That
way, a threshold of a minimum chip size to be consid-
Table 2: Comparison of required computation resources
among different slide viewers.
Viewer CPU RAM t
init
t
zoom
QuPath ∼120% ∼5GB ∼3s <50ms
ASAP ∼50% >4GB ∼1s <1s
xOpat ∼75% ∼300MB ∼180s <50ms
Ours ∼120% ∼300MB ∼1s ∼1s
ICEIS 2024 - 26th International Conference on Enterprise Information Systems
734

ered can be set in later analysis. To filter parts that are
likely no tissue but rather preparation artefacts, we,
however, added an initial threshold of 2500 (µm)
2
.
The results could be confirmed in a real-tissue test
cases. Fig. 2 shows the UI after the real-tissue test
case has been analysed.
The WSI or a folder of WSIs can be loaded in the
menu, as well as the processing script. The script will
analyse each WSI upon clicking “Analyse” and write
the tissue area of each detected chip to a CSV file. The
medical experts will receive an immediate summary
of the number of chips detected together with the total
area to allow easy access to the extracted information.
3.2 Tumour Localisation and Grading
To assist the localisation and grading procedure,
Resnets and Efficientnets as suggested by (Bulten
et al., 2022) and a CTranspath-based model as sug-
gested by (Yang et al., 2023) were integrated into our
tool. The results obtained with ResNet and Efficient-
Net models, as recommended by (Bulten et al., 2022),
could not be replicated using our internal dataset,
which is likely caused by variation in staining pro-
tocols across hospitals. To mitigate this issue, we em-
ployed a GAN model, following the approach sug-
gested by (Park et al., 2020), and trained it on the
Radboud portion of the PANDA dataset (Bulten et al.,
2022) using default parameters (c.f., github.com/
taesungp/contrastive-unpaired-translation) for 100
epochs. Upon normalising our images using the
GAN, the patient-level κ score only slightly de-
creased compared to the PANDA dataset (Bulten
et al., 2022), registering at 0.75. However, the GAN-
based preprocessing significantly increased the pro-
cessing time from approximately 3.1 to 10.3 seconds
per 1120×1120 image patch. In practical terms, this
translates to a processing time of 5 minutes with-
out normalisation and 15 minutes with normalisation
for the test image discussed in Section 3.1. Further-
more, to localise the tumour, the Grad-CAM method
(Gildenblat and contributors, 2021) needed to be
Figure 2: The proposed tool enables pathologists to analyse
TURP-chips and especially to measure their tissue area.
Table 3: Average region-level f
1
-scores of the predic-
tions per patch, calculated using the attention matrix of the
model, and the annotated ground truth on the test cohort for
the main GG.
as Benign Tumour
Benign 0.80 ± 0.16 0.20 ± 0.16
Tumour 0.21 ± 0.16 0.79 ± 0.16
GG 3 0.16 ± 0.14 0.84 ± 0.14
GG 4 (crib.) 0.16 ± 0.19 0.84 ± 0.19
GG 4 (glom.) 0.40 ± 0.37 0.60 ± 0.37
GG 4 (malf.) 0.17 ± 0.11 0.83 ± 0.11
GG 4 (cons.) 0.27 ± 0.23 0.73 ± 0.23
GG 5 0.53 ± 0.16 0.47 ± 0.16
used, which not only contributes to the high process-
ing time, but also yields only visualisations that lack
a sufficient overlap with the tumour and in particular
appear counterintuitive (e.g., stroma is marked, but
glands are omitted).
Hence, these models were discarded for the
CTranspath-based model (Yang et al., 2023), which
uses an SSL-pretrained backbone that incorporates a
considerable collection of different tumour’s WSIs.
Promising region-level results could be achieved,
which can be found in Tab. 3 and 4. Besides the
Gleason grades (GGs), perineural carcinosis and IDC-
P refer to the tumour class. The overall region-level
f
1
-score was 0.80 ±0.09, whereas the highest tumour
true positive was achieved for GG 3 and the lowest
one for GG 5. For benign tissue, a true positive of
0.80 ±0.16 was achieved.
For GG 5, the low f
1
-score may be related to the
fact that such tumours are rare and thus only a few
examples exist in current datasets. Another potential
cause could be confusion to stromatic tissue, which
hasn’t explicitly been trained as a class.
GG 4 subpatterns (cribriform, malformed, con-
solidated) are identifiable, except for the glomeruloid
type, which is often confused with benign tissue. Fur-
ther investigation revealed that glomeruloid patterns
were correctly classified within more complex GG4
Table 4: He result of Tab. 3 remains consistent for tissue
subtypes, although some subtypes show a remaining weak-
ness of the model.
as Benign Tumour
Benign Hyperpl. 0.74 ± 0.32 0.26 ± 0.32
High-Grade PIN 0.57 ± 0.38 0.43 ± 0.38
Low-Grade PIN 0.92 ± 0.00 0.08 ± 0.00
Perineural Carc. 0.30 ± 0.19 0.70 ± 0.19
Seminal Vesicle 0.85 ± 0.15 0.15 ± 0.15
Clear Cell Hyperpl. 0.80 ± 0.00 0.20 ± 0.00
IDC-P 0.30 ± 0.18 0.70 ± 0.18
Atrophy 0.25 ± 0.34 0.75 ± 0.34
An Open-Source Approach for Digital Prostate Cancer Histopathology: Bringing AI into Practice
735
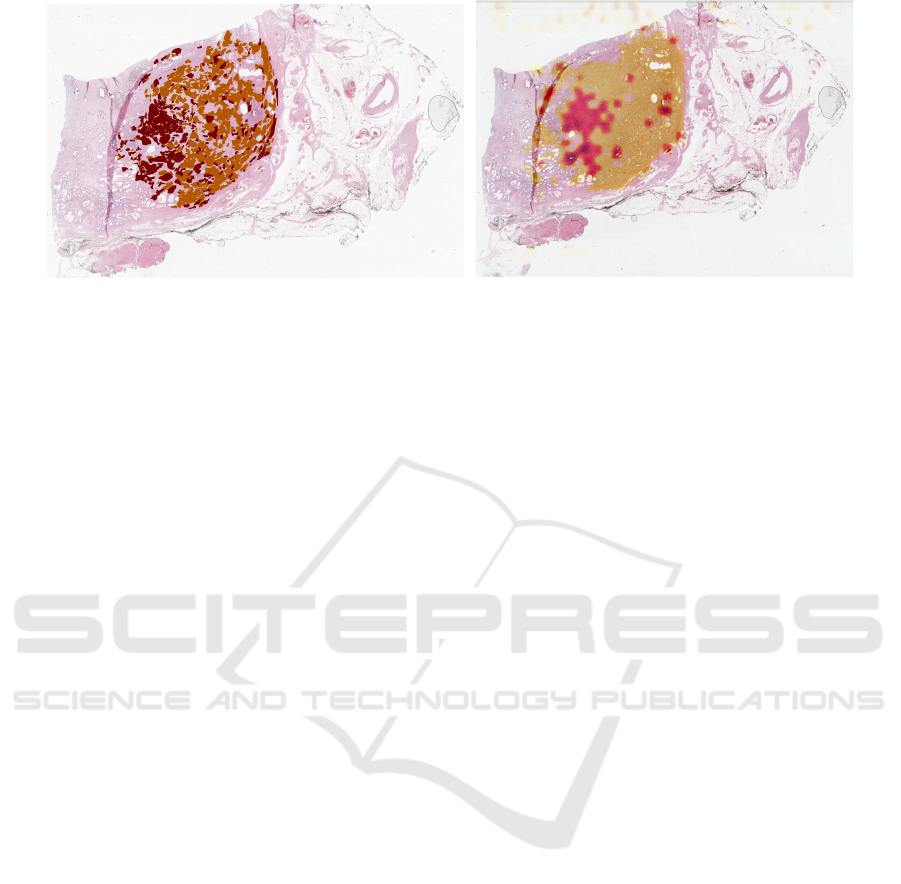
Figure 3: Predicted tumour (left; orange ISUP group 2, red ISUP group 3) and ground truth (orange Gleason Grade 3, red
Gleason Grade 4). Especially for cases with a high tumour amount, the proposed solution achieves a high overlap ( f
1
-score
0.90) of annotated and predicted tumour.
regions. Achieving precise localisation of individ-
ual glomeruloid glands may require an advanced sam-
pling strategy during training, leveraging a few WSIs
with extensive region annotation, as proposed in this
work. Despite these efforts, the current performance
is deemed insufficient, and addressing this issue will
be a focus of future work.
We further investigated the classification rates of
different benign and tumour tissue subtypes (c.f. Tab.
4). Generally, plausible results could be achieved.
Especially, the correct classification of hyperplasia
yields great value, as it could also be used in TURP-
chip analysis. For High-Grade-PIN, the classification
as tumour is significantly higher than for Low-Grade-
Pin. This seems plausible, as High-Grade-PIN is con-
sidered a precursor of prostatic carcinoma. Partic-
ularly Low-Grade-PIN also suffers from high inter-
oberserver reproducibility. Thus, the AI predictions
meet the expectation, as Low-Grade-PIN not neces-
sarily refers to tumour tissue (Epstein et al., 1995).
Furthermore, perineural carcinois and IDC-P have a
good score, which is already reflected in the overall
f
1
-score. They are anyway listed here for better read-
ing. The only significant misclassification observed
was for atrophies.
As the results for tumour subtype analysis looked
promising, we used the attention matrix of our model
to visualise the predicted tumour probability, whereas
deeper red signals a higher GG. Fig. 3 shows the re-
sults for the highest f
1
-score’s WSI. Generally, the
tumour region is matched well and even a grading of
different tumour areas of annotated GG 4 (red) and
GG 3 (orange) can be distinguished. Even for the
case of the lowest f
1
-score (c.f. 4), this can be re-
produced in particular. Overall, the model’s strength
as of now, however, clearly needs to be considered in
tumour localisation rather than grading. For exam-
ple, in Fig. 3 and 4 the annotations suggest GG 3
(likely ISUP 1) and GG 4 (likely ISUP 4), while the
algorithm mostly predicts ISUP 2 and ISUP 3. This
is plausible, as a possible combination for tumour pat-
terns in the individual patches could indeed be ISUP 2
(=95% of GG 3 and 5% of GG 4) and ISUP 3 (95% of
GG 4 and 5% of GG 3). Yet, there remains an uncer-
tainty about the exact GS the prediction implies. The
heatmaps created in Fig. 3 and 4 can be overlaid in
the viewer of the proposed solution and thus directly
support in real-world use-cases. Furthermore, a per-
patch overlay prediction allows for quick and iterative
exploration of the image.
Finally, we evaluated the performance of different
inference normalisation strategies to see if the above
results could be improved, similar as in the case of
the Resnet/EfficientNet-based models. We used the
image from section 3.1 for evaluation. Our results in-
dicate that both modifications, namely using a GAN
for stain-adaption (Park et al., 2020) and statistics-
fusion normalisation (BN) with β = 0.85 (Chattopad-
hyay et al., 2022), didn’t add value. For the GAN
f
1
-score improved by 0.005 and for the BN it even
decreased by 0.004. The SSL learning strategy and
the fact that the large data variability of the TCGA
(Zuley et al., 2016) (that the model was trained on)
appear to already prepare the model for transferring
it to different data. Considering the high processing
time of the GAN-based approach (1300s vs. 279s for
the base and 280s for BN model), we stick to the non-
normalised solution in favour of the tool’s usability.
4 CONCLUSIONS
In this paper, we presented a novel slide viewer that
efficiently loads and displays WSI images. The pro-
posed solution is flexible and allows for use-case-
specific data processing and visualisation that can add
ICEIS 2024 - 26th International Conference on Enterprise Information Systems
736
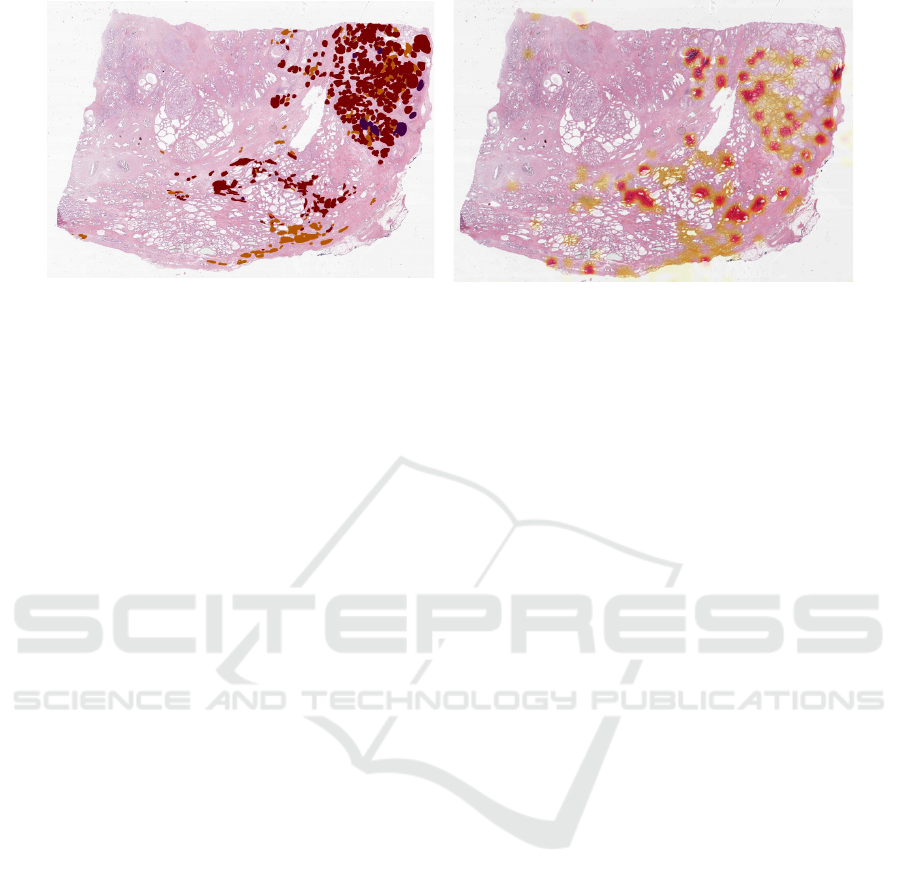
Figure 4: Prediction vs. ground truth (c.f. Fig 3). Slides with a lower tumour amount and high malignancy can generally be
graded, but result also in a lower f
1
score of 0.74.
great value to the pathological workflow. We demon-
strated the value of our work using two highly rel-
evant use cases. We conclude, that AI-based image
analysis as well as classical computer vision can as-
sist pathologists in their daily business. This can for
example be the case when analysing TURP-chips for
hyperplasia and iPCa or for tumour localisation. The
presented approach has the potential to reduce the re-
quired time-to-grade significantly. We also uncovered
current systematic weaknesses of current state-of-the-
art AI solutions.
Future work should focus on closing these gaps,
e.g., by using sophisticated sampling strategies and by
focusing on currently underrepresented tumours pat-
terns such as GG 5. Furthermore, the image viewer
should be extended with more requirements and func-
tionality, such as training and annotation capabilities.
5 DATA AVAILABILITY
The training data used in this work is publicly avail-
able and can be found in (Bulten et al., 2022) and (Zu-
ley et al., 2016). The code and tool described and
used in this work can be found at https://github.com/
mbu93/OpenProsIT. The internal data set cannot be
shared due to privacy requirements.
REFERENCES
Arvaniti, E., Fricker, K. S., Moret, M., Rupp, N., Hermanns,
T., Fankhauser, C., Wey, N., Wild, P. J., R
¨
uschoff,
J. H., and Claassen, M. (2018). Automated gleason
grading of prostate cancer tissue microarrays via deep
learning. Scientific Reports, 8(1).
Assran, M., Duval, Q., Misra, I., Bojanowski, P., Vin-
cent, P., Rabbat, M., LeCun, Y., and Ballas, N.
(2023). Self-supervised learning from images with
a joint-embedding predictive architecture. CoRR,
abs/2301.08243.
Bankhead, P., Loughrey, M. B., Fern
´
andez, J. A., et al.
(2017). QuPath: Open source software for digital
pathology image analysis. Scientific Reports, 7(1).
Bulten, W., Kartasalo, K., Chen, P.-H. C., et al. (2022).
Artificial intelligence for diagnosis and gleason grad-
ing of prostate cancer: the panda challenge. Nature
Medicine, 28(1):154–163.
Chattopadhyay, N., Gehlot, S., and Singhal, N. (2022). Fu-
sion: Fully unsupervised test-time stain adaptation via
fused normalization statistics. CoRR, abs/2208.14206.
Chen, R. J. and Krishnan, R. G. (2021). Self-supervised vi-
sion transformers learn visual concepts in histopathol-
ogy. Learning Meaningful Representations of Life,
NeurIPS 2021.
Chen, X., Fan, H., Girshick, R., and He, K. (2020). Im-
proved baselines with momentum contrastive learn-
ing. CoRR, abs/2003.04297.
CodePlex Foundation and OpenSeadragon contributors
(2009). An open-source, web-based viewer for
zoomable images, implemented in pure javascript.
https://github.com/openseadragon/openseadragon.
da Silva, L. M., Pereira, E. M., Salles, P. G., et al. (2021).
Independent real-world application of a clinical-grade
automated prostate cancer detection system. The Jour-
nal of Pathology, 254(2):147–158.
Dosovitskiy, A., Beyer, L., Kolesnikov, A., et al. (2020). An
image is worth 16x16 words: Transformers for image
recognition at scale. CoRR, abs/2010.11929.
Eloy, C., Marques, A., Pinto, J., Pinheiro, J., Campelos, S.,
Curado, M., Vale, J., and Pol
´
onia, A. (2023). Arti-
ficial intelligence–assisted cancer diagnosis improves
the efficiency of pathologists in prostatic biopsies. Vir-
chows Archiv, 482(3):595–604.
Epstein, J. I., Egevad, L., Amin, M. B., Delahunt, B.,
Srigley, J. R., and Humphrey, P. A. (2016). The 2014
international society of urological pathology (isup)
consensus conference on gleason grading of prostatic
carcinoma: Definition of grading patterns and pro-
posal for a new grading system. American Journal
of Surgical Pathology, 40(2):244–252.
Epstein, J. I., Grignon, D. J., Humphrey, P. A., Mc-
An Open-Source Approach for Digital Prostate Cancer Histopathology: Bringing AI into Practice
737

Neal, J. E., Sesterhenn, I. A., Troncoso, P., and
Wheeler, T. M. (1995). Interobserver reproducibil-
ity in the diagnosis of prostatic intraepithelial neo-
plasia. The American Journal of Surgical Pathology,
19(8):873–886.
Gildenblat, J. and contributors (2021). Pytorch li-
brary for cam methods. https://github.com/jacobgil/
pytorch-grad-cam.
Hor
´
ak, J., Furmanov
´
a, K., Kozl
´
ıkov
´
a, B., Br
´
azdil, T.,
Holub, P., Ka
ˇ
cenga, M., Gallo, M., Nenutil, R., By
ˇ
ska,
J., and Rus
ˇ
n
´
ak, V. (2023). xopat: explainable open
pathology analysis tool. Computer Graphics Forum,
42(3):63–73.
Kartasalo, K., Bulten, W., Delahunt, B., et al. (2021). Ar-
tificial intelligence for diagnosis and gleason grading
of prostate cancer in biopsies—current status and next
steps. European Urology Focus, 7(4):687–691.
K
¨
ollermann, J., Hoeh, B., Ruppel, D., Smith, K., Reis,
H., Wenzel, M., Preisser, F., Kosiba, M., Mandel, P.,
Karakiewicz, P. I., Becker, A., Chun, F. K. H., Wild,
P., and Kluth, L. A. (2022). The significance of the ex-
tent of tissue embedding for the detection of inciden-
tal prostate carcinoma on transurethral prostate resec-
tion material: the more, the better? Virchows Archiv,
481(3):387–396.
Lu, M. Y., Williamson, D. F., Chen, T. Y., Chen, R. J., Bar-
bieri, M., and Mahmood, F. (2021). Data-efficient
and weakly supervised computational pathology on
whole-slide images. Nature Biomedical Engineering,
5(6):555–570.
Matsakis, N. D. and Klock II, F. S. (2014). The rust lan-
guage. In ACM SIGAda Ada Letters, volume 34, pages
103–104. ACM.
Nagpal, K., Foote, D., Liu, Y., Chen, P.-H. C., Wulczyn, E.,
Tan, F., Olson, N., Smith, J. L., Mohtashamian, A.,
Wren, J. H., Corrado, G. S., MacDonald, R., Peng,
L. H., Amin, M. B., Evans, A. J., Sangoi, A. R., Mer-
mel, C. H., Hipp, J. D., and Stumpe, M. C. (2019). De-
velopment and validation of a deep learning algorithm
for improving gleason scoring of prostate cancer. npj
Digital Medicine, 2(1).
Oquab, M., Darcet, T., Moutakanni, T., et al. (2023). Di-
nov2: Learning robust visual features without super-
vision. CoRR, abs/2304.07193.
Park, T., Efros, A. A., Zhang, R., and Zhu, J.-Y. (2020).
Contrastive learning for unpaired image-to-image
translation. CoRR, abs/2007.15651.
Perincheri, S., Levi, A. W., Celli, R., Gershkovich, P.,
Rimm, D., Morrow, J. S., Rothrock, B., Raciti, P.,
Klimstra, D., and Sinard, J. (2021). An indepen-
dent assessment of an artificial intelligence system for
prostate cancer detection shows strong diagnostic ac-
curacy. Modern Pathology, 34(8):1588–1595.
Radboud Computational Pathology Group and ASAP con-
tributors (2009). Automated slide analysis platform.
https://github.com/computationalpathologygroup/
ASAP.
Sch
¨
uffler, P. J., Stamelos, E., Ahmed, I., Yarlagadda, D.
V. K., Ardon, O., Hanna, M. G., Reuter, V. E., Klim-
stra, D. S., and Hameed, M. (2022). Efficient visu-
alization of whole slide images in web-based viewers
for digital pathology. Archives of Pathology and Lab-
oratory Medicine, 146(10):1273–1280.
Singhal, N., Soni, S., Bonthu, S., Chattopadhyay, N.,
Samanta, P., Joshi, U., Jojera, A., Chharchhodawala,
T., Agarwal, A., Desai, M., and Ganpule, A. (2022). A
deep learning system for prostate cancer diagnosis and
grading in whole slide images of core needle biopsies.
Scientific Reports, 12(1).
Tolkach, Y., Dohmg
¨
orgen, T., Toma, M., and Kristiansen,
G. (2020). High-accuracy prostate cancer pathology
using deep learning. Nature Machine Intelligence,
2(7):411–418.
Vaswani, A., Shazeer, N., Parmar, N., et al. (2017). Atten-
tion is all you need. In Guyon, I., Luxburg, U. V.,
Bengio, S., Wallach, H., Fergus, R., Vishwanathan,
S., and Garnett, R., editors, Advances in Neural Infor-
mation Processing Systems, volume 30. Curran Asso-
ciates, Inc.
Yagi, Y., Yoshioka, S., Kyusojin, H., Onozato, M., Mizu-
tani, Y., Osato, K., Yada, H., Mark, E. J., Frosch,
M. P., and Louis, D. N. (2012). An ultra-high speed
whole slide image viewing system. Analytical Cellu-
lar Pathology, 35(1):65–73.
Yang, Z., Wang, X., Xiang, J., Zhang, J., Yang, S.,
Wang, X., Yang, W., Li, Z., Han, X., and Liu, Y.
(2023). The devil is in the details: a small-lesion
sensitive weakly supervised learning framework for
prostate cancer detection and grading. Virchows
Archiv, 482(3):525–538.
Ye, H.-L. and Wang, D.-H. (2022). Stain-adaptive self-
supervised learning for histopathology image analy-
sis. CoRR, abs/2208.04017.
Zuley, M., Jarosz, R., Drake, B., et al. (2016). The can-
cer genome atlas prostate adenocarcinoma collection
(tcga-prad). The Cancer Imaging Archive, last ac-
cessed 15.01.23.
ICEIS 2024 - 26th International Conference on Enterprise Information Systems
738
