
Sample-Based Cardinality Estimation in Full Outer Join Queries
Uriy Grigorev
1a
, Andrey Ploutenko
2b
, Aleksey Burdakov
2c
, Olga Pluzhnikova
1d
and Evgeny Detkov
1e
1
Bauman Moscow State Technical University, Moscow, Russia
2
Amur State University, Blagoveschensk, Russia
Keywords: Cardinality Estimation, CardEst, Sampling, Full Outer Join, Approximate Calculation of Aggregates.
Abstract: Efficient query planning is crucial in large smart databases, where the complexity of joining tables can exceed
a hundred. This paper addresses the pivotal role of cardinality estimation in generating effective query plans
within a Database Management System (DBMS). Over the past decade, various estimation methods have been
developed, yet their accuracy tends to decrease as the number of joined tables increases due to specific
constraints and prerequisites. This paper introduces EVACAR, a novel cardinality estimation method rooted
in the theory of approximate aggregate calculations. Unlike existing methods, EVACAR is designed to
alleviate limitations associated with increasing table joins. Our method not only matches but often surpasses
the accuracy of machine learning methods, achieving superior results for 75-88% of the evaluated queries
(subplans). This advancement signifies a promising step towards optimizing query performance in large-scale
smart databases.
1 INTRODUCTION
In the realm of modern Database Management
Systems (DBMSs), the query optimizer serves as an
indispensable component with the vital task of
crafting top-tier SQL query execution plans.
Cardinality estimation, known as CardEst, holds a
key position in the optimization of queries. CardEst
involves the proactive computation of record counts
for all subplans within each query, providing the
optimizer with the means to make informed choices
regarding table join operations. The accuracy and
efficiency of CardEst exert a profound influence on
the quality of the resultant query plans. Recognizing
its central importance in DBMSs, the CardEst
problem has received extensive attention from both
the academic and industrial communities.
Cardinality Estimation is conventionally
characterized as a statistical challenge (Han et al.,
2021). Consider a table, denoted as T, with attributes
A = {A
1
, A
2
, ..., A
k
}. Table T can represent either a
a
https://orcid.org/0000-0001-6421-3353
b
https://orcid.org/0000-0002-4080-8683
c
https://orcid.org/0000-0001-6128-9897
d
https://orcid.org/0000-0002-4276-8734
e
https://orcid.org/0009-0005-1147-9373
solitary relational table or a composite of joined
tables. Underlying this framework, the assumption
prevails that each attribute, A
i
, for every 1 ≤ i ≤ k, falls
into one of two categories: categorical, wherein
values can be mapped to integers, or continuous. The
comprehensive set of unique attribute values is
signified as D
i
. For any search query, Q, executed on
table T, a canonical representation emerges: Q={A
1
∈
R
1
∧ A
2
∈ R
2
∧ ... ∧ A
k
∈ R
k
}, where R
i
⊆ D
i
serves
as the specified constraints on attribute A
i
(i.e., R
i
acts
as a filtering predicate). The cardinality, denoted as
Card(T, Q), signifies the exact count of records within
T that satisfy all the constraints imposed by Q. The
fundamental objective of CardEst is to provide an
accurate estimation of Card(T, Q) without the need to
execute the query Q on the table T.
Within the existing literature, several CardEst
methods can be categorized into three distinct classes:
1) Traditional Methods: These methods primarily
rely on histograms and samples, finding widespread
utilization in Database Management Systems
Grigorev, U., Ploutenko, A., Burdakov, A., Pluzhnikova, O. and Detkov, E.
Sample-Based Cardinality Estimation in Full Outer Join Queries.
DOI: 10.5220/0012682000003705
Paper published under CC license (CC BY-NC-ND 4.0)
In Proceedings of the 9th International Conference on Internet of Things, Big Data and Security (IoTBDS 2024), pages 235-244
ISBN: 978-989-758-699-6; ISSN: 2184-4976
Proceedings Copyright © 2024 by SCITEPRESS – Science and Technology Publications, Lda.
235

(DBMSs). They often hinge on simplified
assumptions and heuristic expertise. A range of
enhancements has been proposed to bolster their
performance, such as: multivariate histogram-based
techniques (Gunopoulos et al., 2005), correcting and
self-tuning histograms, incorporating query feedback
(Khachatryan et al., 2015), approaches for updating
statistical summaries within the DBMS (Stillger et al.,
2001; Wu et al., 2018), sampling-based solutions
including kernel density methods (Heimel et al.,
2015; Kiefer et al., 2017), index-based methods (Leis
et al., 2017), and random walk-based techniques (Li
et al., 2016; Zhao et al., 2018). Some novel
methodologies, like the sketch-based approach (Cai et
al., 2019), explore innovative directions in CardEst.
2) Query-Based Machine Learning (ML)
Methods: These methods strive to train models that
can estimate Card(T, Q) directly from a query.
Advanced ML techniques have emerged, featuring
more complex models like deep neural networks
(DNNs) (Kipf et al., 2019) or gradient boosted trees
(Dutt et al., 2019).
3) Data-Driven ML Methods: These methods
exhibit query-agnostic characteristics by treating each
tuple in table T as a point drawn from the joint
distribution P
T
(A) = P
T
(A
1
, A
2
, ..., A
k
). The
probability corresponding to a query Q, P
T
(Q), can be
formulated as P
T
(A
1
∈ R
1
∧ A
2
∈ R
2
∧ ... ∧ A
k
∈ R
k
).
The cardinality Card(T, Q) can be expressed as the
product of P
T
(Q) and the size of table T.
Consequently, the CardEst problem is reduced to
modeling the Probability Density Function (PDF)
P
T
(A) for the table T. A variety of ML-based models
have been introduced for representing P
T
(A),
including the deep autoregressive model (Yang et al.,
2020), trained Probabilistic Graphical Models
(PGMs) such as Bayesian Networks (BN) (Wu et al.,
2020), a deep probabilistic model over database
(RSPN) (Hilprecht et al., 2020), and a novel
unsupervised graphical model (FSPN) (Zhu et al.,
2021). These methods differ in their estimation
approaches. Recent proposals aim to integrate diverse
ML methods based on queries and data (Wu et al.,
2021).
Currently, prevalent open-source and commercial
DBMSs predominantly employ two traditional
CardEst methods: PostgreSQL and MS SQL Server
utilize histograms, while MySQL and MariaDB make
use of sampling.
Nonetheless, existing cardinality assessment
methods suffer from various limitations, including:
Large evaluation times, scaling with the
number of subplans in the original query.
Limiting table joins to attribute equality.
Joined tables shall form an acyclic graph.
Simplified assumptions and "magic" numbers
for complex table filtering conditions.
Declining cardinality estimation accuracy as
the number of joined tables increases.
Lacking solid methodological justification,
often relying on heuristics.
In addition to these limitations ML-based methods
suffer from costly learning and tuning, selection-
based methods require dependency on indexes for
foreign key joins, while histogram-based methods
neglect correlations between selectivity and join
attributes.
This paper addresses these limitations by
introducing a cardinality estimation method
EVACAR grounded in the theory of approximate
aggregate calculations (sum, count, etc.) (Zhang et
al., 2016; Grigorev et al., 2021; Grigorev et al., 2022),
effectively overcoming the shortcomings of existing
approaches. EVACAR method was implemented,
based on the random selection of small blocks of
tables and their subsequent join. It is at least as
accurate and efficient as data-based machine learning
methods like BayesCard (Wu et al., 2020), DeepDB
(Hilprecht et al., 2020), and FLAT (Zhu et al., 2021).
2 DEVELOPMENT OF METHODS
FOR ESTIMATING THE
CARDINALITY OF TABLE
JOINS BASED ON SAMPLING
FROM A FULL OUTER JOIN
In the realm of database query optimization, the
meticulous estimation of cardinality plays a pivotal
role in enhancing the efficiency and accuracy of query
execution. In this section, we delve into a novel
approach for estimating the cardinality of subqueries,
shedding light on a practical methodology to navigate
the complexities of large join operations.
Method. Consider a set of subquery tables,
denoted as Q=(Q
1
, Q
2
, ..., Q
m
), which partake in a join
operation following the application of filtering
conditions dictated by the SELECT statement. These
tables are presented in a topological order as:
𝑐
(
𝑄
)
=𝑐
(
𝑄
,…,𝑄
)
=
|
𝑄
⊳⊲𝑄
…⊳⊲𝑄
|
=
∑∏
1
,
.
(1)
Where F represents the number of rows in a full
outer join (FOJ), and value 1
Qj,i
equals 0 if, in the i-th
row of FOJ = (Q
1
⊲⊳Q
2
...⊲⊳Q
m
), the attributes of
some Q
j
are equivalent to the empty symbol ∅,
IoTBDS 2024 - 9th International Conference on Internet of Things, Big Data and Security
236

signifying no join with the records from Q
j
.
Otherwise, it is equal to 1. Note: ⊳⊲ is an inner and
⊲⊳ is a full outer join (FOJ).
One of the key advantages of FOJ approach is its
ability to be sequentially constructed, traversing
through the tree structure of tables, including Q
1
, Q
2
,
..., Q
m
, as indicated in Figure 1a. It achieves this by
preserving joins solely between immediately adjacent
related tables in structures that share the same tree,
without necessitating verification of join conditions
from preceding tables. For example, Q1⊲⊳Q2,
Q2⊲⊳Q3, Q3⊲⊳Q4, Q2⊲⊳Q5, Q1⊲⊳Q6, and
Q6⊲⊳Q7. The execution of expression (1) is
achieved through navigation across these structures.
Implementing the FOJ method is inherently time-
consuming and generating a uniform sample from the
FOJ for approximate cardinality calculation (as in
expression (1)) becomes a formidable challenge,
especially in scenarios involving a significant number
of tables within the join (Zhao et al., 2018).
a)
b)
Figure 1: Implementation of a full outer join: a) without
breaking up tables of subqueries Q
j
into blocks, b) with the
breakdown of the original tables T
j
into blocks Q
j,i
.
This paper puts forward a distinct approach,
emphasizing the partitioning of source tables T
j
into
logical blocks of records, followed by the selection of
those blocks where records meet the filtering
conditions. These blocks, represented as Q
j,i
,
correspond to the i-th block of the j-th table, where j
ranges from 1 to m,
⋃
𝑄
,
⊆𝑇
;∀𝑖
,𝑖
(𝑄
,
∩
𝑄
,
=∅|𝑖
≠𝑖
) (Figure 1b demonstrates one block
for each table). Subsequently, the cardinality estimate
is expressed as:
𝑐(𝑄) =
∑
𝑐(𝑄
,
,…,
,...,
𝑄
,
)=
∑
𝑐
(
,…,
)
.
(2)
In expression (2), the function c(x) adheres to the
definition provided in (1). The summation spans
across all feasible combinations of blocks
(𝑄
,
,...,𝑄
,
)∈𝑅
×𝑅
...×𝑅
, where 𝑅
=
{𝑄
,
}
, set of blocks, Q
j,i
, whose records conform to
the filtering conditions.
However, it is important to acknowledge that the
number of combinations (𝑄
,
,...,𝑄
,
) in
expression (2) can become exceedingly large. To
mitigate the computational burden, we harness the
principles of approximate aggregate calculation
theory (Zhang et al., 2016; Grigorev et al., 2021;
Grigorev et al., 2022) for the summation in expression
(2).
With some probability π
g
, we select a
combination of blocks g = (i
1
, ..., i
m
) and build for
them FOJ
=FOJ(𝑄
,
,...,𝑄
,
). For this FOJ
g
,
we calculate the cardinality 𝑐
=𝑐(𝑄
,
,...,𝑄
,
)
using the formula (1). We repeat samples g n times.
Next, we estimate the cardinality using the formula:
𝑐(𝑄,𝑛) =
∑
(
)
.
(3)
As established in prior research (Grigorev et al.,
2022), 𝑐(𝑄,𝑛)
→∞
⎯
⎯
⎯
⎯
𝑐(𝑄) and ∀𝑛(𝐸(𝑐
(
𝑄,𝑛
)
)=
𝑐(𝑄)), where E is the sign of the mathematical
expectation. The estimate (3) is unbiased for any n.
Interestingly, these properties are valid for any
probability distribution {π
g
} satisfying the conditions
∑
𝜋
=1
and 𝑐
>0→𝜋
>0.
For the purpose of establishing confidence
intervals around the estimate expressed in formula
(3), we draw upon the Student's t-distribution with (n
- 1) degrees of freedom:
𝛥=
|()(,)|
()
≤𝑡
,
()
()
⋅
()
,
(4)
𝐷(𝑛) = (
∑
(
−𝑐(𝑄,𝑛))
)/𝑛.
(5)
Here, c(Q) = E(c(Q,n)) represents the mathematical
expectation of c(Q,n), in essence, the true cardinality
value. The coefficient t
n-1,α
is almost independent of n
for n>121, and can be standardized to values 1.645,
1.960, or 2.576 when α assumes values of 0.9, 0.95,
or 0.99, respectively.
It is imperative to acknowledge that the accuracy
of the estimate c(Q,n) is significantly influenced by
the probability distribution {π
g
} (Grigorev et al.,
2022).
Independent random sampling of blocks from
𝑅
={𝑄
,
}
, j = 1... m . For ∀ g we have:
𝜋
=
∏
(1/𝑅
)
.
(6)
Let us use the results of (Grigorev et al., 2022,
formula (10)), and for a sufficiently large n rewrite (4):
𝛥≤𝑡
,
(
с
()
∑
𝑐
−1)⋅
()
, 𝑁=1/
𝜋
.
(7)
Q
1
Q
2
Q
6
Q
3
Q
5
Q
4
Q
7
Q
1,i1
Q
2,i2
Q
6,i6
Q
3,i3
Q
5,i5
Q
4,i4
Q
7,i7
T
1
T
2
T
3
T
4
T
5
T
7
T
6
b
j
b
k
Sample-Based Cardinality Estimation in Full Outer Join Queries
237
To simplify the analysis of the formula (7),
assume that the cardinality value c (Q) is uniformly
distributed over K combinations (chains) g =(i
1
, ...,
i
m
). That is, with с
g
= c(Q)/K , |{g}|=K . Then we get:
𝛥≤𝑡
,
(
−1)⋅
()
. (8)
It follows that the larger K, that is, the number of
combinations g with non-empty block joins, the
smaller the relative error Δ.
3 ANALYZING METHOD FOR
CARDINALITY ESTIMATION
IN JOIN OPERATIONS:
COMPARATIVE INSIGHTS
AND TRADE-OFFS
In this section, we present a cardinality estimation
algorithm that can be employed to implement the
Method, which was introduced in the preceding
section.
Figure 2a illustrates the conventional scheme for
constructing a query plan and executing a database
management system (DBMS) query. During the plan
construction phase, the methods for retrieving records
from source tables are determined, and the records
themselves are accessed during query execution.
In our Method, during the plan construction
phase, we identify the methods for reading records
from the source tables, and we read the records at this
stage (Figure 2b). This approach enables more
accurate estimation of the joined tables cardinality
and leads to a more optimized query plan. The
cardinality estimation Method implementation is
detailed in Algorithm 1.
After executing Algorithm 1, the query optimizer
accesses each subplan S⊆Q to the card(S) function to
evaluate cardinality. The card(S) function calculates
the cardinality using the formula (3), where Q:=S ,
(1/𝜋
)=𝑁=
∏
𝑁
:
∈
, N
j
=|R
j
|. c
g
value is
determined by navigating through the str
g
structures,
which are prepared by Algorithm 1. The calculation
of c
g
is carried out in accordance with the expression
(1) for the FOJ
g
. It can be considered that the query
graph is cyclic (see below).
a)
b)
Figure 2: Reading records from source tables: a) query
execution stage, b) plan building stage.
Algorithm 1: Independent Random Sampling of Blocks.
Input: ' m ' subqueries (select) of the tables participating
in the join; number of records in block L
j
for the j-th
subquery, j =1...m.
Output: filled structures (
s
t
r
g
) for cardinality estimation.
1 Opening cursors for all select subqueries.
2
Defining for each subquery Q
j
: 1) number of records
|
Q
j
|
,2
)
number of lo
g
ical blocks
N
j
=
|
Q
j
|/
L
j
=
|
R
j
|
.
3 Cycle i=1... n // n - number of samples
g
4
Determination of random block numbers
g
=(i
1
,...,i
m
),i
j
=
N
j
⋅
random [0,1].
5
Reading blocks (Q
1,i1
,...,Q
m,im
) at offsets (i
1
,...,i
m
)
using cursors. | Q
j,i
|= L
j
.
6
Navigating the query tree and performing a
complete outer join of blocks Q
1,i1
, ..., Q
m,im
in
accordance with the join condition; saving the
compressed record numbers of child blocks in
str
g
structures (the structures are joined in
accordance with the query tree, Figure 1b).
7 End of cycle by i
8 Freeing memory allocated for blocks ( Q
1,i1
,..., Q
m,im
).
Let us note some important advantages of the
Method.
1) The blocks Q
ji
are small, so their FOJ
g
is fast.
2) Algorithm 1 does not access database indexes,
so their presence is not required.
3) The condition for joining tables can be
arbitrary, that is, it is not necessarily equality of keys.
Building Plan
Define methods
for record (Q
j
)
read from source
tables
Define order
and methods
for Q
j
join
Query Execution
Read records
(Q
j
) from
source tables
Q
j
Table Join
Building Plan
Define methods
and read records
(Q
j
) from source
tables
Define order
and methods
for Q
j
Join
Executing Query
Q
j
Table join
IoTBDS 2024 - 9th International Conference on Internet of Things, Big Data and Security
238

4) The accuracy of cardinality estimation and the
running time of Algorithm 1 are controlled by the
number of samples n and the block sizes L
j
. It is
simple to organize parallel sampling and processing
of blocks.
5) There are no problems with assessing the
selectivity of the source tables since the records are
joined after the subqueries are executed (Figure 2b).
6) The str
g
structures are created once for the
original query and then used to estimate the
cardinality of all subplans S⊆Q without additional
samples.
But there are also disadvantages of the Method.
The sample size n is limited, since the cardinality
assessment time should be short. From (8) follows
that if there are many sequences of blocks (i
1
, ..., i
m
)
give an empty join (K is small) and the product of the
number of blocks N
j
is large (N is large), then the error
in cardinality estimation Δ can be large.
This disadvantage can be compensated by
increasing the sample size n and parallel computation
(3).
Let us highlight two important advantages of the
proposed Method.
1) The cardinality of each subplan is estimated
from the sample for the original query Q, meaning no
additional overhead is required.
Algorithm 1 builds a tree of structures str
g
, where
the numbers of records of child blocks are stored in a
compressed form after constructing the FOJ
g
. Any
subplan S is a subtree of the original query tree Q.
Therefore, any subplan corresponds to a subtree in the
tree of joined blocks and structures with record
numbers (Figure 3).
Figure 3: Tree of blocks and structures.
The entire query is built, and then its subtrees are
used to evaluate the cardinality of any subplan (see
Algorithm 1). Therefore, evaluation of subplans is
performed quickly.
2) The join graph of query tables may contain
loops.
Existing methods allow one to estimate the
cardinality of joins for an acyclic query graph
(Figure 1a). But in practice, queries with cyclic graph
are used. Let us look at an example of such a request:
select * from A,B where A.a1=B.b1
and A.a2>
(select avg(C.c3) from C where
B.b2=C.c1 and C.c2=A.a3);
(9)
It can be noted that the join conditions
(A.a1=B.b1) - (B.b2=C.c1) - (C.c2=A.a3) form a
cyclic graph A-B-C-A. In addition, attribute a2 is
compared with the result of another select query
based on the inequality condition.
The main block includes join attributes: table
block A - attribute a1, table block B - attributes b1
and b2, table block C - attribute c1 (not shown in
Figure 4). Together with the main blocks, we read the
attributes a2, a3 (for A) and c2, c31 (for C), which
form additional blocks of tables A and C (Figure 4).
The values c31 are obtained by grouping the records
of block C by c1, c2.
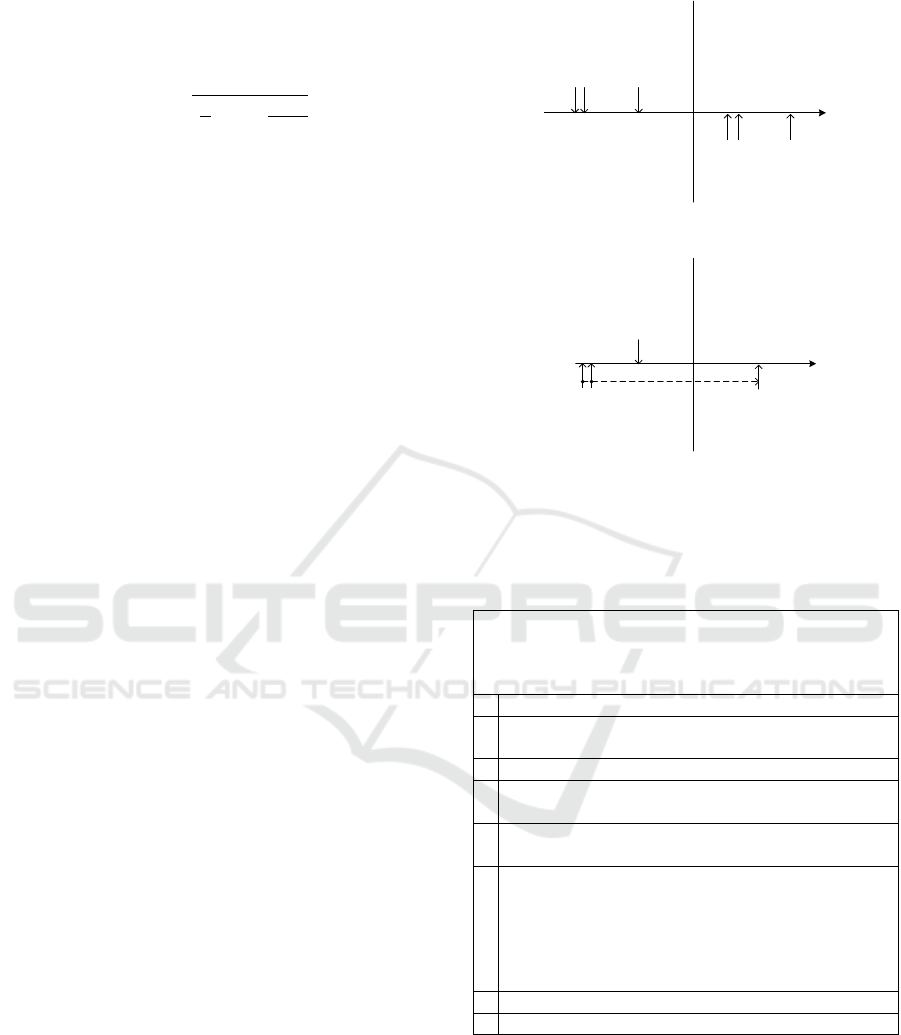
As already mentioned, cardinality c
g
in the
formula (3) is evaluated with expression (1). An
additional condition can be imposed on 1
Qj,i
=1. Let
there be a join of records (i
A,
i
B,
i
C
) of tables A, B, C.
If for rows i
A
and i
C
of additional blocks of tables A
and C an additional filtering condition is met (Figure
4), then only in this case we set 1
Qj,i
= 1 and add 1 to
the cardinality of the query.
Figure 4: Scheme of additional filtering of record joins for
example (9).
4 EXPERIMENTAL
EVALUATION
In this chapter, we delve into the experimental results
obtained from the implementation of the Method for
estimating the cardinality of query subplans, ,which
we refer to as EVACAR. The experiments were
conducted on a virtual machine (VM) with Ubuntu
Tree block and structure for query Q
Tree of blocks and
structures for
subplan S
Table block
Structure with record
numbers of a child
block after FAJ
g
is
built
C
i
B
Structures with
record numbers of
child blocks (to
obtain chains i
A
, i
B
,
i
C
)
i
A
i
C
Additional blocks
with table attributes
A
a2 a3
i
A
Additional filtration
conditions
a3=c2 and
a2>c31
c2
c31=
avg
c1,c2
(c3)
i
C
i
B
i
C
Sample-Based Cardinality Estimation in Full Outer Join Queries
239

18.04.5 OS, powered by Intel Core i5 CPU, 4GB of
RAM, and a 20GB disk. The EVACAR program was
developed using the C language and compiled with
the GCC compiler, resulting in a program size of 40
KB.
The primary dataset used for testing the Method
was the STATS dataset (Han et al., 2021), specifically
designed for evaluating Cardinality Estimation
(CardEst) methods. This dataset exhibits intricate
characteristics, including a high number of attributes,
substantial distributed skewness, strong attribute
correlation, and complex table join structures.
Notably, some table key values can be linked to zero
or one record in one table, while hundreds of records
are associated with another table. We deployed the
STATS database within the PostgreSQL 15 Database
Management System (DBMS) and employed the
libpq library to interface with the EVACAR prototype
(Matthew et al., 2005).
One of the most challenging queries in the STATS
dataset is Query Q57 (Han et al., 2021), involving six
table joins and several filtering conditions (we will
call them subqueries). The query, represented below,
served as a focal point for our assessments.
SELECT COUNT(*) // Q57
FROM posts as p, postLinks as pl,
postHistory as ph, votes as v,
badges as b, users as u
WHERE p.Id = pl. RelatedPostId AND
u.Id = p. OwnerUserId AND u.Id = b.
UserId AND u.Id = ph. UserId AND
u.Id = v.UserId
AND p.CommentCount>=0 AND
p.CommentCount<=13
AND ph.PostHistoryTypeId=5 AND
ph.CreationDate<='2014-08-13
09:20:10'::timestamp
AND v.CreationDate>='2010-07-19
00:00:00'::timestamp
AND b.Date<='2014-09-09
10:24:35'::timestamp
AND u.Views>=0 AND u.DownVotes>=0
AND u.CreationDate>='2010-08-04
16:59:53'::timestamp AND
u.CreationDate<='2014-07-22 15:15
:22'::timestamp;
(10)
Running Query Q57 on the virtual machine within
the PostgreSQL environment took approximately 17
minutes (measured considering interruptions by the
host machine). In terms of pure virtual machine time,
the query execution ran roughly 7 minutes, ultimately
yielding 17,849,233,970 records.
Table 1 below presents the characteristics of the
tables involved in Query Q57.
In the assessments, the 'users' table (No. 1 in Table
1) was designated as the root table for evaluating the
cardinality of query (10) and its subplans using the
Method, as defined in Algorithm 1 (Section 3).
Across all experiments, the product of the number of
blocks was maintained at N = Π
j =1...6
N
j
= 10
5
(as
indicated in Table 1), and the number of samples (g)
was set at n = 10. The experiments aimed to
investigate the impact of the number of blocks (1, 2,
4) in the root subquery on the accuracy and time
required for cardinality estimation, as denoted by
options 1, 2, and 3 in Table 1.
To evaluate accuracy, we employed the q-error
estimate, as defined in (Leis et al., 2015):
𝑞− 𝑒𝑟𝑟𝑜𝑟
=
𝑐
𝑐
,𝐼𝐹𝑐
≥𝑐
,
−
𝑐
𝑐
,𝐼𝐹𝑐
>𝑐
,
(11)
where c
true
represents the true cardinality value, and
c
estimate
signifies the estimated cardinality value.
Table 2 outlines the results of the experiments and
presents confidence intervals for the q-errors of the
EVACAR method. In Table 2, the second column
signifies the subplan tables, each denoted by their
respective numbers as presented in Table 1. For
instance, subplan {1,5} represents a join of
subqueries from the 'users' and 'posts' tables, while
subplan {1,2,3,4,5,6} comprises all subqueries of the
original query (10). The third column provides the
actual cardinality values of these subplans. Columns
4 to 6 depict the q-errors, representing the
discrepancies between the true and estimated
cardinality values when using the BayesCard (Wu et
al., 2020), DeepDB (Hilprecht et al., 2020), and
FLAT (Zhu et al., 2021) methods.
Columns 7 to 12 present the medians (M) and the
boundaries of the 95% confidence intervals for q-
errors across the examined options 1, 2, and 3. These
boundaries are derived from the results of 50 runs of
Algorithm 1 (see the Method in Section 2) for each
option. A specific notation system is employed for
these options, formatted as "n10-uX-vY," where n =
10 signifies the number of samples g, while X and Y
represent the number of blocks associated with the
'users' and 'votes' subquery tables, respectively.
An intriguing observation in Table 2 is that the
lengths of the confidence intervals tend to increase
with the number of blocks in the root subquery,
ranging from 1 to 4.
This phenomenon can be attributed to the
substantial distributed skewness within the STATS
dataset. This is explained by the fact that due to the
strong distributed asymmetry of the STATS data set,
the number of combinations g with non-empty block
joins decreases, the N/K ratio in (8) increases, and the
error Δ also increases.
IoTBDS 2024 - 9th International Conference on Internet of Things, Big Data and Security
240

Table 1: Characteristics of Query Tables.
No. Table name
Number of
records in
the database
Number of
records
returned by
subquery
Block size (number of records) and number of blocks N
j
in
experimental variants
Option 1 Option 2 Option 3
Size N
j
Size N
j
Size N
j
1 users 40,325 36,624 37,000 1 18,400 2 9,200 4
2 badges 79,851 79,400 8,000 10 8,000 10 8,000 10
3 postHistory 303,187 66,973 6,700 10 6,700 10 6,700 10
4 votes 328,064 327,982 3,300 100 6,600 50 13,200 25
5 posts 91,976 91,489 9,200 10 9,200 10 9,200 10
6 postLinks 11,102 11,102 11,102 1 11,102 1 11,102 1
Table 2: Experimental Results and Confidence Intervals for q-errors of the EVACAR Method.
#
Subplan
queries
Postgresql
(c
true
)
q -errors
existing methods for
assessin
g
cardinalit
y
Median (M ) and 95% confidence intervals (n.g. ÷c.g.) q -
errors of the new cardinality estimator ( EVACAR )
bayesca
rd
deepdb
flat
Option 1
Q57-n10-u1-v100
Option 2
Q57-n10-u2-v50
Option 3
Q57-n10-u4-v25
M
95%
M
95%
M
95%
1 2 3 4 5 6 7 8 9 10 11 12
1
{1.5}
79,662 1.0 1.5 -1.0
0.1
-1 .1 ÷1.1
1.0
-2.0 ÷1.5
-1.1
- 2.2 ÷1.9
2
{1,3}
58,416 -1.0 2.4 -1.1
0.1
-1 .1 ÷1.1
1.2
-2.0 ÷1.4
0.0
- 2.2 ÷1.8
3
{1,4}
31,148 1.1 1.0 -1.1
0.0
-1.4 ÷1.2
1.0
-2.0 ÷1.5
0.0
- 2.3 ÷1.7
4
{1,2}
71,547 1.0 -1.8 -1.0
0.0
-1.1 ÷1.1
1.0
-3.4 ÷1.4
-1.1
- 3.5 ÷2.0
5
{1,5,6}
8,909 3.1 15.3 8.6
-1.1
-1.7 ÷1.4
1.1
-3.9 ÷1.9
-1.1
- 4.2 ÷2.4
6
{1,5,3}
18,631,047 -1.0 1.0 -1.4
-1.0
-1.8 ÷1.4
1.0
-3.0 ÷1.6
-1.1
- 4.6 ÷2.0
7
{1,5,4}
2,409,832 -1.2 -1.1 -1.4
0.0
-2.3 ÷1.8
1.1
-4.1 ÷2.5
-1.1
- 7.2 ÷2.4
8
{1,5,2}
2,954,776 -1.1 1.1 -1.2
-1.0
-1.3 ÷1.4
1.1
-1.9 ÷2.1
-1.1
- 3.5 ÷2.9
9
{1,3,4}
5,699,168 -1.2 -1.1 -1.6
-1.0
-1.7 ÷1.5
-1.1
-3.2 ÷2.0
-1.4
- 6.3 ÷3.4
10
{1,3,2}
5,385,663 -1.0 -1.2 -2.2
0.0
-1.4 ÷1.3
1.1
-4.2 ÷1.8
-1.1
- 6.1 ÷3.2
11
{1,4,2}
858,085 1.0 -2.1 -1.3
-1.1
-2.1 ÷1.5
1.0
-3.5 ÷1.8
-1.1
- 4.7 ÷2.1
12
{1,5,6,3}
352,054 18.2 19.0 38.9
-1.2
-2.2 ÷1.8
-1.1
-3.4 ÷3.0
-1.3
- 5.6 ÷2.2
13
{1,5,6,4}
130,192 1.4 22.2 13.2
-1.0
-3.2 ÷2.3
-1.1
-3.4 ÷4.7
-1.3
- 9.5 ÷2.3
14
{1,5,6,2}
167,260 1.3 31.2 15.3
-1.1
-2.1 ÷2.1
1.1
-4.1 ÷3.3
-1.5
- 8.0 ÷4.0
15
{1,5,3,4}
5,383,224,109 -1.2 -1.2 -1.8
-1.1
-4.5 ÷2.0
-1.1
-4.6 ÷3.1
-2.0
- 17.7 ÷4.1
16
{1,5,3,2}
4,664,599,508 -2.2 -2.2 -2.4
-1.1
-2.3 ÷1.7
1.1
-2.3 ÷2.0
-1.4
- 7.2 ÷3.6
17
{1,5,4,2}
488,657,174 -1.4 -1.4 -8.6
-1.1
-3.1 ÷2.3
-1.2
-5.6 ÷2.6
-1.1
- 8.4 ÷5.0
18
{1,3,4,2}
1,389,418,172 -1.2 -1.2 -8.2
-1.1
-2.6 ÷1.8
-1.2
-3.4 ÷2.5
-1.4
- 12.5 ÷4.1
19
{1,5,6,3,4}
67,575,395 23.1 23.1 44.2
-1.2
-6.9 ÷5.1
-1.5
- 8.6 ÷6.0
-2.7
- 28.8 ÷7.7
20
{1,5,6,3,2}
58,582,347 -3.6 -3.6 3.4
-1.2
-4.5 ÷2.3
-1.0
-6.1 ÷4.1
-1.9
- 8.6 ÷3.3
21
{1,5,6,4,2}
9,726,255 -1.7 -1.9 -1.6
-1.3
-4.8 ÷4.8
-1.1
-4.8 ÷3.5
-1.5
- 13.4 ÷7.2
22
{1,5,3,4,2}
1,375,709,726,310 -2.8 -2.8 -3.3
-1.1
-5.7 ÷3.4
-1.1
- 7.0 ÷4.8
-2.0
- 19.1 ÷9.0
23
{5,6}
10,959 1.4 2.2 1.0
-1.0
-1.6 ÷1.5
-1.0
-2.1 ÷1.4
0.0
- 1.8 ÷1.6
24
{1,2,3,4,5,6}
17,849,233,970 -7.2 -7.2 2.4
-1.5
-9.8 ÷4.4
-1.6
- 14.7 ÷9.8
-3.4
-62.6 ÷12.7
The work (Han et al., 2021) highlights that data-
driven machine learning methods founded on
Probabilistic Graphical Models (PGMs) deliver
improved accuracy and performance in testing
scenarios. These methods strike an optimal balance
between the precision of cardinality estimation and
the assumption of parameter independence.
Consequently, this study undertook a comparison of
such methods, specifically BayesCard, DeepDB, and
FLAT. It is important to note that comparing these
methods posed a challenge because the source
Sample-Based Cardinality Estimation in Full Outer Join Queries
241
material (Han et al., 2021) only provides random
cardinality values for subplans.
To facilitate the comparison, q-errors were
computed (as depicted in columns 4-6 of Table 2) and
contrasted with the confidence intervals of q-errors
pertaining to options 1, 2, and 3. To quantify this
comparison, a metric was introduced:
𝑑=
𝑚𝑎𝑥(
|
LL
|
,UL) −
|
𝑒
|
|
𝑒
|
.
(12)
Within this context, LL (Lower Limit) and UL
(Upper Limit) represent the lower and upper bounds
of the confidence interval for the q-error during the
estimation of subplan cardinality, as delineated in
columns 8, 10, and 12 of Table 2. Meanwhile,
max(|LL|, UL) signifies the maximum q-error
observed for the newly developed EVACAR method
at a confidence level of 0.95, referred to as the
maximum q-error. Additionally, |e| corresponds to the
absolute value of the q-error encountered when
estimating subplan cardinality using any of the
compared methods.
When assessing the new EVACAR method, the
metric 'd' (12) was employed to discern its
performance. This metric takes into consideration the
relationship between the maximum q-error, observed
with EVACAR, and the absolute q-error when using
one of the compared methods.
Here is the interpretation of the metric 'd' in
different scenarios:
1) d≤0 signifies that the new EVACAR method
surpasses the other methods under
comparison. This outcome is deduced from
the maximum q-error being smaller than the
absolute q-error (|e|).
2) 0<d≤k, it implies that the maximum q-error
of EVACAR is comparable to |e| at a
specified level 'k'. In such cases, the
deviation from |e| is bounded by k⋅|e|.
3) d>k, it indicates that the maximum q-error of
EVACAR is not comparable to |e| at a level
'k'. In this scenario, the deviation from |e| is
higher than k⋅|e|.
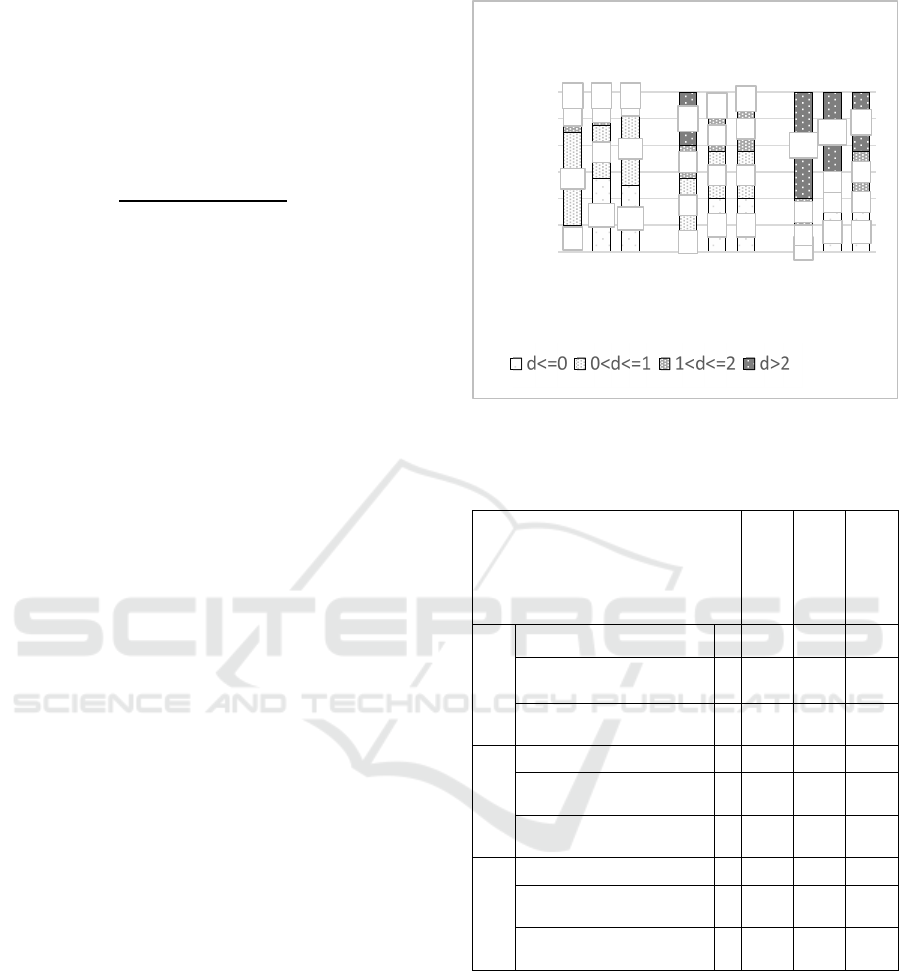
For each of the three options (1, 2, and 3), the
metric 'd' was calculated for the BayesCard (b),
DeepDB (d), and FLAT (f) methods, in conjunction
with the subplans outlined in Table 2. The distribution
of the number of subplans categorized by their 'd'
values is visually depicted in Figure 5. Utilizing this
data, a comparative analysis was performed to
evaluate the accuracy of cardinality assessment for
the methods under consideration. This comparison is
presented in terms of the percentage of subplans, as
detailed in Table 3.
Figure 5: Subplan number by 'd' value distribution.
Table 3: Comparison of methods by accuracy (in % of the
number of subplans in Figure 5).
BayesCard
(
b
)
DeepDB
(
d
)
FLAT
(
f
)
Option 1
more precisely 1 17 46 42
q - error is comparable
at level "1"
2 58 33 46
q - error is comparable
at level "2"
3 21 17 8
Option 2
more precisely 4 13 33 33
q - error is comparable
at level "1"
5 33 29 29
q - error is comparable
at level "2"
6 21 21 29
Option 3
more precisely 7 4 25 25
q - error is comparable
at level "1"
8 13 13 13
q - error is comparable
at level "2"
9 17 13 25
The analysis of Table 3 reveals that for option 1,
the EVACAR method consistently outperforms the
compared methods in terms of precision. Its
maximum q-error is on par with these methods at a
confidence level of "1" for a substantial majority of
the evaluated subplans, ranging between 75% and
88% (cumulative sum of lines 1 and 2 for Option 1).
Furthermore, at a confidence level of "2," the
EVACAR method demonstrates superior accuracy,
aligning with 96% of the subplans (sum of lines 1, 2,
and 3 for Option 1).
4
11
10
3
8 8
1
6 6
14
8
11
8
7 7
3
3 3
5
4
2
5
5
7
4
3
6
1 1 1
8
4
2
16
12
9
0
4
8
12
16
20
24
bd f bd f bd f
Number of subplans
Option 1 Option 2 Option 3
Distribution of the number of
subplans by metric value d
IoTBDS 2024 - 9th International Conference on Internet of Things, Big Data and Security
242

Table 4 and Table 5 present a detailed analysis of
the computational and temporal characteristics of the
established EVACAR method in comparison to the
existing cardinality estimation techniques as outlined
in (Han et al., 2021).
Table 4: Space-time characteristics of compared cardinality
estimation methods.
BayesCard DeepDB Fla
t
Average cardinality
estimation time per
subplan request, ms
5.8 87 175
Model size, MB 5.9 162 310
Training time, min 1.8 108 262
Model update time
when inserting 10
6
records into the DB, sec
12 248 360
The experiments featured in (Han et al., 2021) were
executed on two distinct Linux servers, each tailored
for specific purposes. The first server was equipped
with 32 Intel(R) Xeon(R) Platinum 8163 processors,
operating at 2.50 GHz, and boasted a Tesla GPU
V100 SXM2 alongside 64 GB of RAM, primarily
designated for model training. In contrast, the second
server relied on 64 Intel(R) Xeon(R) E5-2682
processors with the same clock speed, 2.50 GHz, for
the cardinality estimation tasks related to
PostgreSQL. It's important to emphasize that the
experiments involving the EVACAR method were
conducted on a virtual machine (VM) featuring a
single Intel CPU Core i5 processor with 4GB of
RAM.
When we focus on option 1, the EVACAR method
emerges as remarkably time-efficient when compared
to the Flat method for individual subplan requests.
Specifically, it takes only 92 ms to process a subplan
request, whereas the Flat method consumes nearly
double the time, clocking in at 175 ms per request. To
provide a more granular perspective, EVACAR
dedicates a mere 90 ms to assessing the cardinality of
24 subplans out of a total 2,200 ms, with the
remainder of the time predominantly allocated to
hashing table blocks.
Notably, the EVACAR method exhibits a
substantially lower memory consumption in terms of
RAM when contrasted with DeepDB and Flat. In the
context of the first option, EVACAR utilizes a mere
13.1 MB of memory, significantly less than
DeepDB's 162 MB and Flat's 310 MB. It is essential
to acknowledge that, by configuring EVACAR to
constrain the maximum number of records within a
block to 65,536 records (unsigned short), the
allocated memory footprint can be further reduced to
just 7.1 MB for option 1.
An additional distinguishing feature of the
EVACAR method is its independence from the need
for model training and updates. Conversely, DeepDB
and Flat involve substantial time and computational
resources for these training and model updating
processes, a distinction highlighted in Table 4.
5 CONCLUSION
This research highlights the potential of employing a
randomized selection of small blocks and conducting
full outer joins to leverage the theory of approximate
aggregate calculations (e.g., sum, count) for
estimating the cardinality of all subplans within the
original query. To address the limitations and
shortcomings of existing approaches, we have
developed a cardinality estimation method and an
accompanying algorithm.
Table 5: Space-time characteristics of the developed cardinality estimation method EVACAR.
Parameter Unit EVACAR Characterisitcs per variant
1: Q57-n10-u1-
v100
2: Q57-n10-u2-
v50
3: Q57-n10-u4-
v25
1. Total VM time (gprof) ms 2,200 3,000 5,800
2. Time for one sub
p
lan re
q
uest
(
1/24
)
ms 2,200/24= 92 3,000/24= 125 5,800/24=242
3. Cardinality calculation per subplan (1/24) of
VM time
ms 90 /24=3.8 60/24=2.5 50/24=2.1
4. Memory capacity (valgrind), n =10 MB 1.1(blocks)+1.2*n=
13.1
0.8+ 0.6*10=6.8 0.8+ 0.3*10=3.8
5. Memory (valgrind) (max. block size 65,536 rec.
(
ushort
))
MB 1.1+1.2/2*n =7.1 0.8+ 0.6/2*10=3.8 0.8+ 0.3/2*10=2.3
6. Memory capacity for one request (1/24) and one
sample from the FOJ (1
/
n =1/10)
MB (1.1+1.2)/ 24= 0.1 (0.8+0.6)/ 24=
0.06
(0.8+0.27)/24=
0.04
7. Memory for one request (1/24) and one sample
from the FOJ (1/ n =1/10) (max. block size 65,536
records
)
MB (1.1+1.2/2)/24=0.07 (0.8+0.6/2)/24=
0.05
(0.8+0.3/2)/24=
0.04
Sample-Based Cardinality Estimation in Full Outer Join Queries
243

The method offers the advantage of block
selection after the execution of subqueries from the
original query, eliminating the need for a priori
analysis of filtering conditions. This method allows
for arbitrary conditions when joining tables, without
a strict requirement for attribute equality.
Consequently, this opens up the possibility of more
precise cardinality estimation in scenarios involving
a larger number of table joins. This is particularly
significant since high-performing data-driven
machine learning (ML) methods for CardEst tend to
experience diminishing performance and accuracy as
the number of joined tables increases. Developed
method for cardinality estimation also accommodate
the presence of cycles within the query graph.
We implemented an EVACAR method and
conducted comparative evaluations with modern ML
methods such as BayesCard, DeepDB, and FLAT
using STATS test. The experimental results
unequivocally affirm the efficacy of the EVACAR
method. Our future work is focused on the estimation
error (3) reduction by finding a probability
distribution for choosing a combination of blocks that
is different from the uniform distribution.
REFERENCES
Cai, W. et al. (2019). Pessimistic cardinality estimation:
Tighter upper bounds for intermediate join
cardinalities. In Proceedings of the 2019 International
Conference on Management of Data.
Dutt, A. et al. (2019). Selectivity estimation for range
predicates using lightweight models. In Proceedings of
the VLDB Endowment.
Grigorev, U. et al. (2021). Approximate Query Processing
for Lambda Architecture. In Proceedings of the 6th
International Conference on Internet of Things, Big
Data and Security.
Grigorev, U. et al. (2022). Comparison of data sampling
strategies for approximate processing of queries to a
large database. In Information technologies.
Grigorev, U. (2023). Method for assessing the cardinality
of table joins in a relational DBMS. In Informatics and
control systems.
Gunopoulos, D. et al. (2005). Selectivity estimators for
multidimensional range queries over real attributes. In
The VLDB Journal.
Han, Y. et al. (2021). Cardinality Estimation in DBMS: A
Comprehensive Benchmark Evaluation. In Proceedings
of the VLDB Endowment.
Heimel, M. et al. (2015). Self-tuning, GPU-accelerated
kernel density models for multidimensional selectivity
estimation. In Proceedings of the 2015 ACM SIGMOD
International Conference on Management of Data.
Hilprecht, B. et al. (2020). DeepDB: Learn from Data, not
from Queries! In Proceedings of the VLDB Endowment.
Khachatryan, A. et al. (2015). Improving accuracy and
robustness of self-tuning histograms by subspace
clustering. In IEEE Transactions on Knowledge and
Data Engineering.
Kiefer, M. et al. (2017). Estimating join selectivities using
bandwidth-optimized kernel density models. In
Proceedings of the VLDB Endowment.
Kipf, A. et al. (2019). Learned cardinalities: Estimating
correlated joins with deep learning. In CIDR 19 - 9th
Biennial Conference on Innovative Data Systems
Research.
Leis, V. et al. (2015). How good are query optimizers,
really? In Proceedings of the VLDB Endowment.
Leis, V. et al. (2017). Cardinality Estimation Done Right:
Index-Based Join Sampling. In CIDR 2017 - 8th
Biennial Conference on Innovative Data Systems
Research.
Li, F. et al. (2016). Wander join: Online aggregation via
random walks. In Proceedings of the 2016 International
Conference on Management of Data.
Matthew, N. et al. (2005). Accessing PostgreSQL from C
Using libpq. In Beginning Databases with PostgreSQL:
From Novice to Professional.
Stillger, M. et al. (2001). LEO-DB2's learning optimizer. In
VLDB.
Wu, C. et al. (2018). Towards a learning optimizer for
shared clouds. In Proceedings of the VLDB
Endowment.
Wu, Z. et al. (2020). Bayescard: Revitalizing bayesian
frameworks for cardinality estimation. In arXiv
preprint arXiv:2012.14743.
Wu, Z. et al. (2021). A unified transferable model for ml-
enhanced dbms. In arXiv preprint arXiv:2105.02418.
Yang, Z. et al. (2020). NeuroCard: one cardinality estimator
for all tables. In Proceedings of the VLDB Endowment.
Zhang, X. et al. (2016). Sapprox: enabling efficient and
accurate approximations on sub-datasets with
distribution-aware online sampling. In Proceedings of
the VLDB Endowment.
Zhao, Z. et al. (2018). Random sampling over joins
revisited. In Proceedings of the 2018 International
Conference on Management of Data.
Zhu, R. et al. (2021). FLAT: fast, lightweight and accurate
method for cardinality estimation. In Proceedings of the
VLDB Endowment.
IoTBDS 2024 - 9th International Conference on Internet of Things, Big Data and Security
244
