
Geodetic Fundamentals in the Development of a Voxel Model for the
Subsoil of the City of Sevilla (Spain)
Andreas Fuls
1a
, Emilio J. Mascort-Albea
2b
, Francisco M. Hidalgo-Sánchez
2c
, Martin Kada
1d
,
Cristina Soriano-Cuesta
2e
, Rocío Romero-Hernández
2f
and Antonio Jaramillo-Morilla
2g
1
Institut für Geodäsie und Geoinformationstechnik, Methodik der Geoinformationstechnik,
Fakultät VI Planen Bauen Umwelt, Technische Universität Berlin, Berlin, Germany
2
Departamento de Estructuras de Edificación e Ingeniería del Terreno, Escuela Técnica Superior de Arquitectura,
Universidad de Sevilla, Sevilla, Spain
Keywords: Coordinate Reference System (CRS), Map Distortions, Digital Terrain Model (DTM), LiDAR, Vertical
Control Points.
Abstract: Current global challenges require a better understanding of the subsoil to optimise underground resources and
plan for sustainable development. This is a key issue in anthropised metropolitan environments, where the
high density of elements makes difficult to gain knowledge of this reality. The use of Geographic Information
Systems (GIS) enables spatial management and visualisation of the underground data obtained from
geotechnical surveys. The creation of 3D models in voxel format constitutes a pioneering and relevant line of
research. This paper evaluates the main factors resulting from the integration of different topographic sources
at a territorial level for the creation of surface models that efficiently adjust the geotechnical data collected,
which usually lacks global height values. This task involved designing a coordinate system and a reference
grid, as well as adjusting elevation data for the selected study case: the metropolitan area of Sevilla, Spain.
1 INTRODUCTION
The significance of understanding the underground
reality in highly anthropised urban and metropolitan
areas cannot be overstated. Accurate subsurface data
is crucial to the design of new constructions, the
conservation of existing ones and urban planning.
Nevertheless, current information techniques are
limited in their ability to provide detailed subsurface
data through the use of remote sensors that capture
information from the earth's surface on a massive
scale. To address this issue, efficient strategies are
required to collect data from geotechnical tests (such
as boreholes and soil penetrometer) for the precise
characterisation of the underground through the
generation of 2D cartographies and 3D models by
a
https://orcid.org/0000-0003-3633-7230
b
https://orcid.org/0000-0002-5737-9969
c
https://orcid.org/0000-0001-5310-1567
d
https://orcid.org/0000-0002-7490-7452
e
https://orcid.org/0000-0002-1814-7401
f
https://orcid.org/0000-0002-3468-4055
g
https://orcid.org/0000-0002-6075-5670
means of Geographic Information Systems (GIS).
Regarding this approach, proposals that use vector
and raster models to allow the visualisation of the
distribution of underground geotechnical strata in a
correlated way with the organisation of the urban
infrastructure should be considered (Nonogaki et al.,
2021; Soriano-Cuesta et al., 2023).
Given the interest of this line of work, the present
research raises the need to develop models that can
effectively manage detailed subsurface information
using the voxel format. The accurate correlation of
the subsurface information with the topographic
configuration of the surface is essential in all the cases
mentioned. Consequently, the current investigation
presents the geodetic fundamentals that allow a
rigorous adjustment of the relationship between
144
Fuls, A., Mascort-Albea, E., Hidalgo-Sánchez, F., Kada, M., Soriano-Cuesta, C., Romero-Hernández, R. and Jaramillo-Morilla, A.
Geodetic Fundamentals in the Development of a Voxel Model for the Subsoil of the City of Sevilla (Spain).
DOI: 10.5220/0012683000003696
Paper published under CC license (CC BY-NC-ND 4.0)
In Proceedings of the 10th International Conference on Geographical Information Systems Theory, Applications and Management (GISTAM 2024), pages 144-151
ISBN: 978-989-758-694-1; ISSN: 2184-500X
Proceedings Copyright © 2024 by SCITEPRESS – Science and Technology Publications, Lda.
surface information from different sources and
subsurface data obtained from geotechnical tests of a
spot nature. The study area chosen for this purpose is
Sevilla, a city located in the south of Spain with a high
heritage value and a metropolitan population of
approximately one million inhabitants (Sanchez
Fuentes et al., 2021) has been taken as a
representative study area. The case study is based on
a database of geotechnical tests that mostly lack
geometric information on the absolute height of the
test points, since they usually referenced their depth
in relation to the surface level.
2 REFERENCE SYSTEM
The municipality of Sevilla covers an area of 142 km²
and is located between 5°49’W and 6°02’W of
Greenwich and between 37°18’N and 37°27’N of the
equator. Since September 2012 the urban
development department of Sevilla (Gerencia de
Urbanismo y Medioambiente, 2023) has been using
the "European Terrestrial Reference System 1989"
(ETRS89), which is based on the GRS80 ellipsoid
and in accordance with the INSPIRE guidelines.
Coordinates are represented in the Universal
Transverse Mercator projection (UTM), zone 30N.
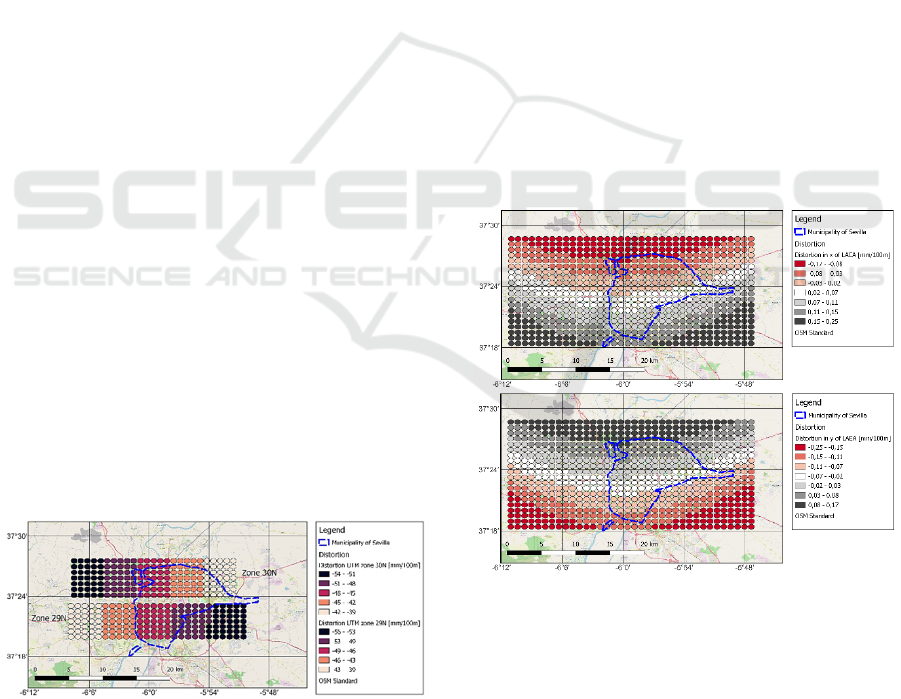
However, Sevilla is located on the western
periphery of UTM zone 30N and on the eastern
periphery of the neighbouring zone 29N, causing
distortions in distances, both in x and y direction,
between 40 and 50mm per 100m (Figure 1). We
chose the coordinate system of UTM zone 30N
because the main part of the city falls east of the 6th
degree of longitude west of Greenwich and thus in
UTM zone 30N. The resulting distortions between
ellipsoidal and projected distances had to be accepted
to comply with Spain's official reference system,
which also uses ETRS89 in conjunction with
cartographic projections in UTM zones.
Figure 1: Distortion of UTM zones 29N and 30N at the city
of Sevilla. Distortion values are given in mm per 100m and
they are identical in x- and in y-direction at one location
because of the conformal Transverse Mercator projection.
The official Spanish cadastre states that:
“Cadastral mapping has a nominal precision of +/- 0.5
m in urban and +/- 2 meters in rustic. This precision
is sufficient in most cases” (Dirección General del
Catastro. Gobierno de España, 2023).
However, the development of a voxel model for
the subsurface of the city of Sevilla (Spain) raises the
question of whether such an accuracy requirement is
adequate for geotechnical concerns. Volume
calculations of the subsurface rely on the results of
the area calculations on the surface and the strata
depth data. Any distortions in distance measurements
will inevitably lead to inaccuracies in area
calculations. Furthermore, the depth values are
provided without such a scale, which can cause a
distortion between horizontal and vertical dimensions
in the voxel model. For these reasons, a specific
reference system was defined for the geotechnical
project.
To ensure accurate area and volume calculations,
an equal-area projection is necessary. The Lambert
azimuthal projection was used for this purpose. The
centre of the projection should be within the urban
territory and was set to 37°24’N and 6°00’W (Figure
2). The GRS80 ellipsoid was used as the reference
ellipsoid which aligns with Spain's official reference
system.
Figure 2: Distortion of the Lambert azimuthal equal-area
(LAEA) projection in a) x-coordinates, b) y-coordinates.
Distortion values are given in mm per 100m.
By using the Lambert azimuthal equal-area
(LAEA) projection, distortions are minimized to less
than 0.2mm per 100m distance (or 2mm per km)
within the territory of Sevilla (Figure 2). The chosen
projection therefore allows for the creation of an
inherently true scale voxel model for the city of
Sevilla.
Geodetic Fundamentals in the Development of a Voxel Model for the Subsoil of the City of Sevilla (Spain)
145
3 REGULAR ANALYSIS GRID
A regular grid is frequently utilized in geotechnical
analysis. In statistical analysis, for instance, point
density is based on statistical units of equal size.
Another application is the organization of tiles of a
digital terrain model with equal sizes.
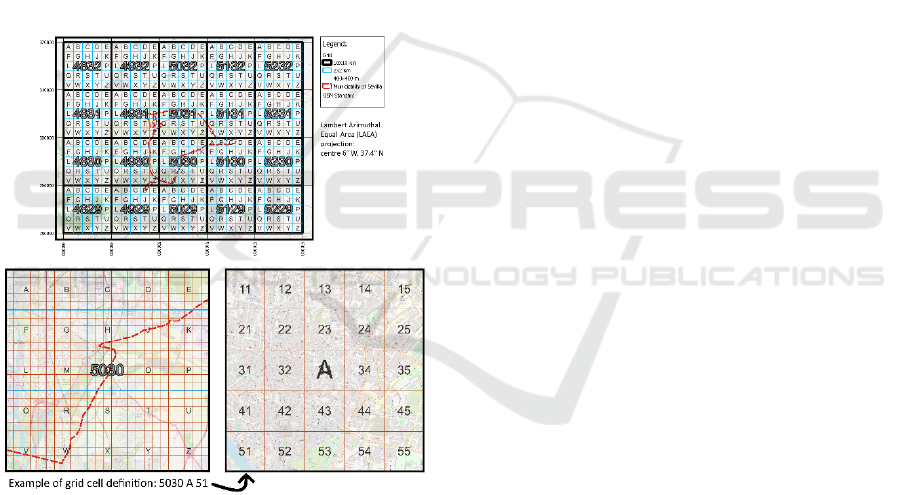
Based on the coordinate reference system LAEA-
Sevilla described above, a regular grid with three
zoom levels is defined. Zoom level 1 uses a 10 x 10
km cell size starting each cell at rounded coordinates
(Figure 3: top). The numbering of each cell refers to
the coordinate values of the upper left corner, rounded
to 10 km. Grid cell 5030, for example, covers the
range in x between 500000m and 510000m and in y
from 290000m to 300000m. A coordinate-based
numbering system is the most flexible option, as a
10km grid can be extended, without the need to
rename existing cells if necessary.
Figure 3: Definition of a regular grid with three zoom
levels: Level 1 (10x10km), Level 2 (2x2km), Level 3 (400
x400m). The grid based on the coordinate reference system
LAEA-Sevilla.
Each cell of Zoom level 1 is subdivided into 25
cells with a size of 2km x 2km (Zoom level 2). The
cells labeled with characters starting with ‘A’ in the
NW corner and continuing row by row from north to
south until character ‘Z’. Character ‘I’ is not used to
avoid any confusion with character ‘J’ (Figure 3:
bottom left).
For large scale studies a third Zoom level 3 is used
with a cell size of 400x400m. The 25 cells are labelled
through numerical codes in such a way, that the first
number refers to the relative cell position in the y-
direction and the second number refers to the position
in x-direction. Therefore, labelling of Zoom level 3
starts with ‘11’ and ends with ‘55’ (Figure 3: bottom
right).
The combination of the label for each zoom level
provides the complete information about the position
of the cell. Grid cell 5030 A 51, for example, covers
the square area from point (500000.00, 298000.00) in
the SW corner to point (500400.00, 298400.00) in the
NE corner.
Per definition, locations falling exactly between
two cells are assigned to the eastern cell and the
southern cell, respectively. This means, for example,
that a point at location (500000.00, 300000.00) falls
into cell 5030 A 11.
4 ELEVATION DATA
There are two primary sources of altitude information
for the urban area of Sevilla and the surrounding
countryside: cadastral survey points and LiDAR
measurements taken from an airplane (Centro
Nacional de Información Geográfica, 2020). Based
on LiDAR measurements from 2012 to 2022
(containing UTM coordinates and ellipsoidal heights)
a DTM has been created by the National Geographic
Institute and the National Center for Geographic
Information in Spain (Instituto Geográfico Nacional
(IGN) / Centro Nacional de Información Geográfica
(CNIG) (Mº Fomento)). Only filtered ground points
have been used to calculate the DTM, interpolating
the elevation values of areas covered by non-ground
points. In addition, satellite measurements and the
digital surface models derived from them are also
available: SRTM (National Aeronautics and Space
Agency -NASA-, 2013), ALOS AW3D (Japan
Aerospace Exploration Agency -JAXA-, 2021) and
MERIT (Global Hydrology Group, 2018). These
measurements can be used to determine the elevation
of boreholes (Table 1).
The vertical accuracy of global Digital Elevation
Models (DEMs) is partially dependent on the slope
(Uuemaa et al., 2020). For this reason, the MERIT
DEM was also used as a data source, as it removes
multiple error components and a comparison of
global DEMs has shown that in flat terrain the
MERIT DEM is more accurate than SRTM
(Yamazaki et al., 2017) and AW3D (Uuemaa et al.,
2020, p. 9). Comparing the LiDAR based DTM with
MERIT DEM results into a standard deviation of
±3.2m (1-sigma range; total grid coverage); the range
GISTAM 2024 - 10th International Conference on Geographical Information Systems Theory, Applications and Management
146

Table 1: Data sources of elevation, their Coordinate Reference System (CRS) and reference ellipsoid, horizontal resolution,
and accuracy of elevation for the area of the grid as well as for the city of Sevilla and in the rural area.
Source (year) Type of geometry CRS Ellipsoid
Horizontal
resolution
Elevation accuracy
IDE Sevilla Redes
Topo (2009)
point UTM 30N GRS 1980
accuracy ca.
±0.001
m
accuracy ca. ±0.001m
Cadaster
surveying (2001 to
2017)
point UTM 29N, 30N GRS 1980
accuracy ca.
±0.01m
accuracy ca. ±0.01m
LiDAR (from
2001 to 2015)
point UTM 29N, 30N GRS 1980 2.00m
±0.15m
(max. error <=0.6m)
LiDAR (from
2015 to 2022
)
DTM based on
filtered
g
round
p
oints
UTM 29N, 30N GRS 1980 2.00m
±0.15m
(
max. error <=0.6m
)
SRTM GL1
(
2000
)
DEM EPSG 4326 WGS 84
1 arcsec
(
ca. 30m
)
±3.4m
(
cit
y
±3.7m, rural ±1.8m
)
AW3D30 (from
2006 to 2011)
DEM EPSG 4326 WGS 84
1 arcsec
(ca. 30m)
±3.1m
(city ±4.3m, rural ±1.5m)
MERIT DEM EPSG 4326 WGS 84
3 arcsec
(
ca. 90m
)
±3.2m
(
cit
y
±2.8m, rural ±1.6m
)
of the differences, however, falls between -206m
because of gravel pits constructed after DEM data
collection and +45m because of buildings not
removed in the DTM but constructed after DEM data
collection. The standard deviation inside the city of
Sevilla is approximately ±2.8m due to the presence of
the numerous buildings, but in the rural area the
standard deviation is much smaller, around ±1.6m.
The AW3D30 DEM is a digital surface model that
includes all buildings, bridges etc. This means, that
men made features have not been removed in the
DEM. As a result, its standard deviation is greater
than for MERIT, especially inside the city of Sevilla
(Table 1). The same observation can be made for
elevation data of SRTM (Nikolakopoulos, 2020, p.
45).
To determine the local elevation for each borehole
location, a terrain model of the same time the
borehole was measured is required. The most precise
elevation data come from altimeter points and LiDAR
measurements. However, it is important to note that
both sources of data are time-dependent.
Additionally, a few building heights not recognized
in the LiDAR based DTM as well as altimeter points
not representing the terrain should be eliminated.
4.1 Filtering LiDAR Points
Only LiDAR points that are classified as ground
should be used to calculate the terrain model.
However, some LiDAR points are misclassified as
ground although they represent other objects such as
buildings or bridges. To eliminate misclassified
ground points, the following filter operations can be
performed:
1. Select only LiDAR points that are not
located within water areas such as rivers,
canals, lakes, artificial water tanks and
pools. The elevation values of water have
been set to ‘no data’.
2. Only select LiDAR points that are not
located within huge buildings of unusual
shape and roof type that are misclassified as
ground points. There are 22 buildings that
have been manually identified in the terrain
model and their elevation values have been
set to ‘no data’.
The result is a terrain surface with 2m horizontal
resolution but only including the elevation of the
terrain at the time of the LiDAR measurements.
4.2 Filtering Altimeter Points
In this research 504,818 surveying points fall within
the above defined area of the grid, but not all of them
represent the terrain. In order to filter altimeter points
with correct values of the elevation of the terrain, the
following filter operations must be performed.
1. Only select altimeter points with TTGGSS
028112.
2. Eliminate points with unknown elevation
(height = 0).
3. Eliminate points with incorrect elevation
values at surrounding towns that are placed
very close to the city of Sevilla as Olivares
(constant height = 160m) and Villanueva del
Ariscal (constant height = 150m).
4. Eliminate surveying points on top of
buildings with an elevation much greater
Geodetic Fundamentals in the Development of a Voxel Model for the Subsoil of the City of Sevilla (Spain)
147
than the local trend surface based on filtered
LiDAR ground points. In this case, the
threshold equals 0.5m, which is about 2.5
times of the maximum elevation error of
LiDAR.
The elevation of the surveying points can be
checked for gross errors through the comparison with
the LiDAR based DTM. The standard deviation of the
height differences of 1,199 precise surveying points
equals ±0.32m. There are 24 points that have a height
difference greater than 1m. Most of these points are
located on highways and bridges.
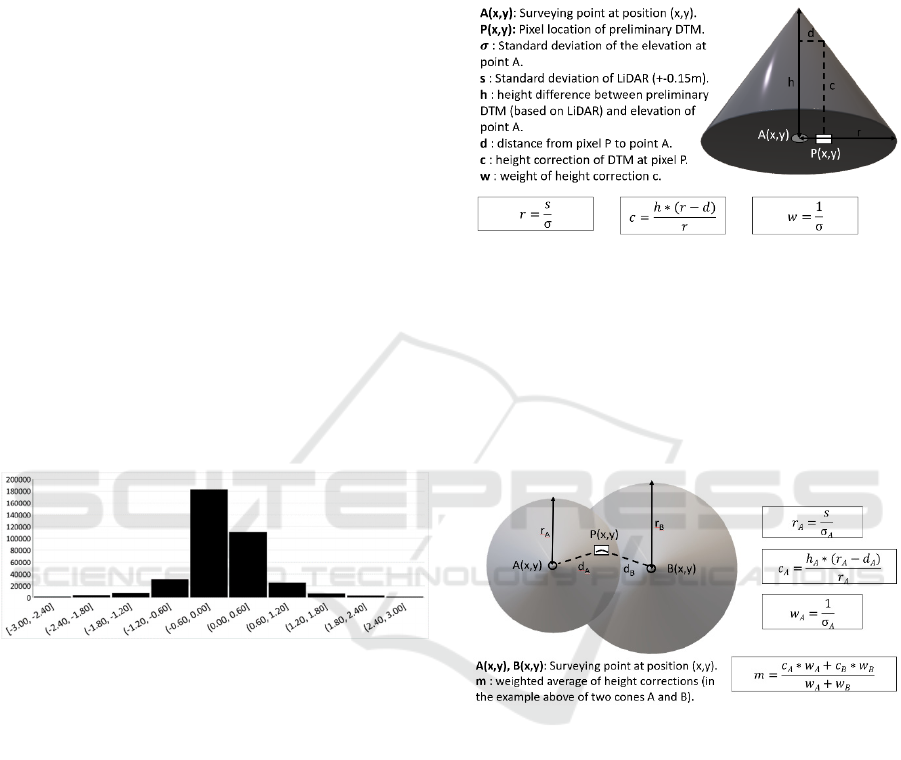
The standard deviation of the height differences
of 292,926 altimeter points with a supposed precision
of 1cm equals ±1.07m (Figure 4). This is due to
several points that exhibit a height difference of up to
21m in relation to the LiDAR based DTM. Taking the
time of measurement into account there seems to be a
trend that the accuracy in the years 2001 to 2003 and
2011 is about ±1m, but much greater in the years 2004
(±1.96m) and 2005 (±1.51m). Most precise are 14
points measured in 2012 with an accuracy of ±0.25m.
The reason for this is likely due to the fact that the
LiDAR measurements were performed closer to that
year than to other years.
Figure 4: Histogram of height differences between
surveying and altimeter points on one side and the LiDAR
based DTM on the other (range from -3m to +3m, excluding
outliers).
4.3 Correcting the LiDAR Based DTM
Finally, the filtered surveying and altimeter points
can be used to calculate a correction for each pixel of
the preliminary (LiDAR based) digital terrain surface.
Since the elevation values of surveying and altimeter
points are more precise than that of LiDAR points
(Table 1), we should base the DTM on these elevation
data. However, there are many areas without any
surveying and altimeter point, especially in the rural
areas outside of the city of Sevilla. In these “empty”
areas we must rely on the LiDAR points with third
highest vertical accuracy.
The cone model of DTM correction enables the
calculation of elevation correction at a pixel location
in the preliminary DTM using all exact elevation data
of the survey points from the surrounding area
(Figure 5a). The maximum sphere of influence is
described by a cone whose radius depends on the ratio
of the accuracy of the LiDAR heights (±15cm) to the
measurement accuracy (±1mm and ±1cm).
Figure 5a: Cone model of DTM correction describing the
method of calculating the DTM correction of a pixel
location in relation to a surveying point with a more precise
elevation of the terrain. The greater the distance d between
pixel and surveying point, the smaller is the correction c,
which also depends on the ratio r between both standard
deviations of the elevation values. The cone is defined
through height difference h and ratio r. At the centre of the
cone the correction equals h and is zero at the radius of the
cone.
Figure 5b: Overlap of two cones and calculation of the
weighted mean height correction m.
When cones from multiple survey points overlap,
correction values are weighted and averaged based on
the reciprocal of measurement accuracy of the
measurement and the distance between the pixel and
the survey point (Figure 5b). However, the
interpolation between a pixel and a survey point
should not be carried out across break lines. For this
reason, all areas with a slope greater than 30° have
been identified as potential breakline areas in the
preliminary DTM. The areas surrounding these have
been marked and vectorised as terrain zones. By
checking whether the interpolation takes place within
the same terrain zone and does not intersect any inner
breakline zone or the outer boundary, it was possible
to ensure that the interpolations do not take place
GISTAM 2024 - 10th International Conference on Geographical Information Systems Theory, Applications and Management
148
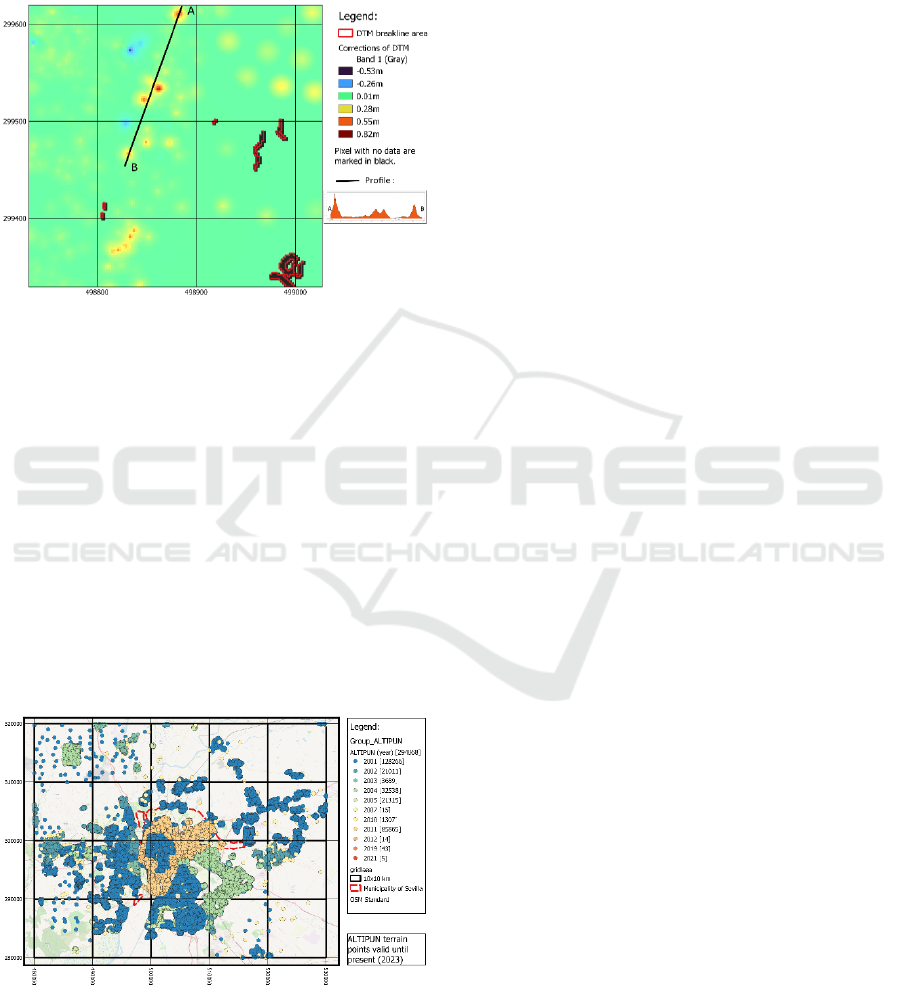
across artificial unevenness in the terrain, such as the
boundaries of rivers, lakes, bridges, ramps, docks,
and steep ditches. This also includes areas with
LiDAR points from buildings that were incorrectly
identified as ground points, such as buildings with
green roofs or unusual roof shapes.
Figure 6: Map of a test area representing the height
correction of the LiDAR based DTM.
In a final step the height corrections can be
applied to the elevation of the DTM (Figure 6). The
result is a digital terrain model with elevation values
of mixed accuracy. To address this, the estimated
accuracy of each elevation is stored in a second band
of the raster file.
4.4 Temporal Aspect of Elevation Data
The ground surface undergoes permanent changes,
especially in urban areas with numerous construction
projects. Therefore, it is necessity to take the temporal
aspect into account when developing a digital terrain
model (Figure 7).
Figure 7: Surveying points with a valid elevation until
present (year 2023).
However, the exact time of measurement is in most
cases unknown, and we can only provide a temporal
range at which measurements were performed.
LiDAR data are based on flights between 2015 and
2021, but the surveying work to obtain elevation data
was carried out between October 2001 and June 2022.
Most of the elevation points, however, were measured
from 2001 to 2005 and 2011, making them older than
the LiDAR data.
Most of the points at the old city center of Sevilla
were surveyed in 2001, but points at the modern part
of the city were measured as late as 2011. Surveying
points at the towns and villages outside of the
municipality of Sevilla were collected between 2001
and 2005. Any gaps without points must be filled up
with elevation data derived from LiDAR data to
calculate a continuous DTM. The temporal aspect,
however, has not been covered in this paper due to its
complexity which will be considered in future
analyses.
5 CONCLUSIONS
The paper presents a rigorous evaluation of the main
factors that affect the problems derived from the
creation of a voxel model at a territorial level based
on data from the primary sources of height
information. In this case, the paper has focused on
aspects related to topographic adjustment, but the
findings can be applied to future issues related to the
integration of subsurface information. In this sense,
the definition of a working grid at different scales
enables the evaluation of the quality and quantity of
the information collected by sector, and the
establishment of an efficient work plan. This
approach identifies areas with common
characteristics and problems that can be solved with
shared methods and strategies.
Regarding the creation of a voxel model of the
subsurface from the borehole data, an accurate Digital
Terrain Model (DTM) is required, which allows us to
determine the surface elevation of boreholes. Height
information of varying accuracy is available for the
area of Sevilla and its rural surroundings, which is
used to correct a DTM based on LiDAR
measurements. LiDAR data of bridges and buildings
often misidentified as ground points must be
eliminated in order to improve the preliminary DTM,
which is partially representing a Digital Surface
Model (DSM) instead of a Digital Terrain Model
(DTM) (Figure 8). The challenge here is to develop a
suitable method to determine DTM corrections from
Geodetic Fundamentals in the Development of a Voxel Model for the Subsoil of the City of Sevilla (Spain)
149
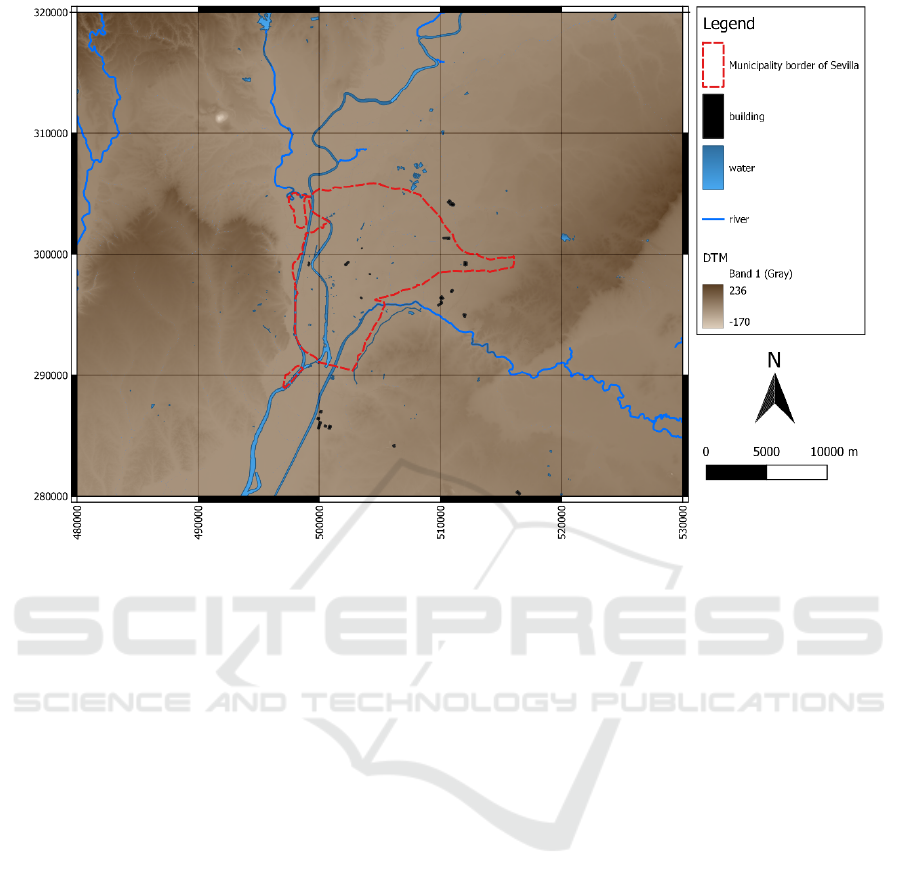
Figure 8: DTM of Sevilla. Water surfaces, rivers, and some buildings are marked as ‘no data’.
various height measurements with a different spatial
distribution and accuracy. The cone model of DTM
correction presented in this paper is a simplified
version of a local terrain correction. The method
analyses diverging height values from different
measurement points for each grid cell in the DTM.
However, further investigations are required in order
to combine the only punctual available height
measurements of high accuracy with the less accurate
but area-wide LiDAR data while preserving the
terrain profile. The correction of elevation data may
require a local trend surface to derive at a smooth
distribution of height corrections. Consequently, the
improvement of the methodology of incorporating
elevation data from various sources and accuracies
requires further research.
Finally, it is necessary to mention that the DTM
presented in this paper is based on the most recent
data valid until now (2023), but the test drillings
described in many reports were performed since 1970
until present (2023). Determining the exact elevation
of the surface above sea level for each location at the
time of the drilling is beyond the scope of the paper.
Not only has the terrain been modified over the years,
but also has undergone changes due to the
construction of basements, underground car parks and
metro lines. Therefore, the improvement of the
methodology of incorporating elevation data from
various sources and accuracies demands extensive
investigations.
ACKNOWLEDGEMENTS
The research and writing of this article were
supported by the following grants: (1) Grant for
Attendance and Participation in International
Scientific Conferences from the VII Research Plan of
the University of Sevilla for 2024 (VII PPI-US,
2024); (2) Grant for the International Mobility of
Research Staff from the VII Research Plan of the
University of Sevilla for 2022 (VII PPI-US, 2022).
Additionally, the authors would like to expressly
acknowledge the work of Julien Baerenzung
(Technische Universität Berlin) and M. Teresa
González-Silva (Universidad de Sevilla) for their
technical support.
SOFTWARE
The calculations and the cartographic outputs were
made with the help of QGIS (version 3.28.10) and a
PostgreSQL/PostGIS database.
GISTAM 2024 - 10th International Conference on Geographical Information Systems Theory, Applications and Management
150

REFERENCES
Centro Nacional de Información Geográfica. (2020).
Especificaciones Técnicas para la realización de vuelo
LIDAR que permita la obtención de información
altimétrica. In LIDAR 2
a
Cobertura (2015 -
Actualidad). https://pnoa.ign.es/resources/archivos/Esp
Tec/2020_Especificaciones_VL_Andalucía.pdf
Dirección General del Catastro. Gobierno de España.
(2023). Información básica sobre el servicio catastral
español. Registro Oficial Del Catastro. https://www.
catastro.minhap.es/esp/faqs_catastro_registro.asp#
Gerencia de Urbanismo y Medioambiente. (2023).
Servicios cartográficos básicos de la ciudad de Sevilla.
Infraestructura de Datos Espaciales de Sevilla
(IDE.Sevilla).
Global Hydrology Group. (2018). MERIT DEM: Multi-
Error-Removed Improved-Terrain DEM. https://
hydro.iis.u-tokyo.ac.jp/~yamadai/MERIT_DEM/
Japan Aerospace Exploration Agency -JAXA-. (2021).
ALOS Global Digital Surface Model (AW3D30).
https://portal.opentopography.org/raster?opentopoID=
OTALOS.112016.4326.2
National Aeronautics and Space Agency -NASA-. (2013).
NASA Shuttle Radar Topography Mission (SRTM).
Shuttle Radar Topography Mission. https://portal.open
topography.org/datasetMetadata?otCollectionID=OT.0
42013.4326.1
Nikolakopoulos, K. G. (2020). Accuracy assessment of
ALOS AW3D30 DSM and comparison to ALOS
PRISM DSM created with classical photogrammetric
techniques. European Journal of Remote Sensing,
53(sup2), 39–52. https://doi.org/10.1080/22797254.20
20.1774424
Nonogaki, S., Masumoto, S., Nemoto, T., Nakazawa, T.
(2021). Voxel modeling of geotechnical characteristics
in an urban area by natural neighbor interpolation using
a large number of borehole logs. Earth Science
Informatics 14, 871–882. https://doi.org/10.1007/s12
145-021-00600-x
Sanchez Fuentes, D., Mascort-Albea, E. J., Del Espino
Hidalgo, B., Hidalgo-Sánchez, F. M., & Gutiérrez, M.
A. (2021). Spatial data for the design of critical
cartographies in the metropolitan area of Sevilla
(Spain). In Reciprociudad: design diplomacy in Sevilla
design diplomacy in Sevilla (pp. 251–264).
Recolectores Urbanos. https://idus.us.es/handle/11441/
143692
Soriano-Cuesta, C., Romero-Hernández, R., Mascort-
Albea, E. J., Kada, M., Fuls, A., & Jaramillo-Morilla,
A. (2023). Evaluation of Open Geotechnical
Knowledge in Urban Environments for 3D Modelling
of the City of Sevilla (Spain). Remote Sensing, 16(1),
141. https://doi.org/10.3390/rs16010141
Uuemaa, E., Ahi, S., Montibeller, B., Muru, M., & Kmoch,
A. (2020). Vertical Accuracy of Freely Available
Global Digital Elevation Models (ASTER, AW3D30,
MERIT, TanDEM-X, SRTM, and NASADEM).
Remote Sensing, 12(21), 3482. https://doi.org/10.3390/
rs12213482
Yamazaki, D., Ikeshima, D., Tawatari, R., Yamaguchi, T.,
O’Loughlin, F., Neal, J. C., Sampson, C. C., Kanae, S.,
& Bates, P. D. (2017). A high‐accuracy map of global
terrain elevations. Geophysical Research Letters,
44(11), 5844–5853. https://doi.org/10.1002/2017GL07
2874
Geodetic Fundamentals in the Development of a Voxel Model for the Subsoil of the City of Sevilla (Spain)
151
