
A Regression Based Approach for Leishmaniasis Outbreak Detection
Ernie Baptista, Franco Vigil and Willy Ugarte
a
Universidad Peruana de Ciencias Aplicadas, Lima, Peru
Keywords:
Random Forest, Machine Learning, Leishmaniasis, NTDs, Outbreaks.
Abstract:
Leishmaniasis is part of a group of diseases called Neglected Tropical Diseases (NTDs) that affects poor and
forgotten communities and reports more than 5,000 cases in regions like Brazil, Peru, and Colombia being
categorized as endemic in these. In this study, we present a machine-learning model (Random Forest) to
predict cases in the future and predict possible outbreaks using meteorological and epidemiological data of the
province of la Convencion (Cusco - Peru). Understanding how climate variables affect leishmaniasis outbreaks
is an important problem to help people to perform prevention systems. We used several techniques to obtain
better metrics and improve our model performance such as synthetic data and hyperparameter optimization.
Results showed two important climate factors to analyze and no outbreaks.
1 INTRODUCTION
Neglected Tropical Diseases (NTDs) are a group of
diseases caused by a diverse group of pathogens such
as parasites, bacteria, and viruses. Affecting more
than 1 billion people worldwide, this group of dis-
eases mainly affects poor and forgotten communi-
ties leading to economic and social consequences
1
.
Leishmaniasis part of the NTDs, is a parasitic dis-
ease caused by a protozoa parasite and transmitted
to humans by the bite of infected sandflies. Cuta-
neous leishmaniasis (CL) is the most common form
of the disease with more than 700,000 new cases each
year
2
. Americas is one of the regions where leish-
maniasis had more impact, reporting cases of CL in
20 countries and categorizing 18 of them as endemic,
regions with the most cases of Cl are Brazil, Colom-
bia, and Peru with more than 5,000 cases reported
only in 2021
3
. According to the Peruvian Center for
disease control (CDC), 4,768 cases of CL were re-
ported with a cumulative incidence of 14.35 cases per
100,000, 847 and 529 of the total cases correspond
a
https://orcid.org/0000-0002-7510-618X
1
United States Agency for International Development
(USAiD) - https://www.usaid.gov/global-health/health-are
as/neglected-tropical-diseases
2
Centers for Disease Control and Prevention (CDC) -
https://www.cdc.gov/parasites/leishmaniasis/epi.html
3
World Health Organization (WHO) - https://www.wh
o.int/data/gho/data/themes/topics/topic-details/GHO/leish
maniasis
to the regions of Madre de Dios and Cusco
4
. In La
Convencion province located in the region of Cusco,
364 cases of CL were registered in 2022
5
. Covid-19
pandemic cause an impact on different programs es-
pecially those related to the detection of NTDs delay-
ing case detection and stopping some programs due
to the prioritization of the combat of the pandemic.
Identifying the elements that cause increases or out-
breaks of leishmaniasis cases is the main challenge
to creating models that predict those scenarios and
trying with them to help in creating early prevention
systems. Several studies are related to the study of
different diseases and their epidemics. In (Nejad and
Varathan, 2021) the authors use different ML mod-
els like Bayes net, Support Vector Machine, Naive
Bayes, and Decision Tables. Their main objective was
to identify climatic risk factors that cause dengue out-
breaks using techniques like the Pearson Correlation
Coefficient (PCC). Then, they found an important fac-
tor that combines the average temperature of the last
5 weeks and the accumulative rainfall of the last 2
weeks.
In (Xu et al., 2020), authors use LSTM, a deep
learning model to compare it with regression mod-
els like SVR, GBM, or GAM. This approach uses as
well meteorological data but this time in a monthly
4
Peruvian Center for disease control - https://www.dge.
gob.pe/epipublic/uploads/boletin/boletin 202252 31 153
743.pdf
5
Cusco Regional Health Management - http://www.di
resacusco.gob.pe/inteligencia/epidemiologia/boletines.htm
204
Baptista, E., Vigil, F. and Ugarte, W.
A Regression Based Approach for Leishmaniasis Outbreak Detection.
DOI: 10.5220/0012683900003699
Paper published under CC license (CC BY-NC-ND 4.0)
In Proceedings of the 10th International Conference on Information and Communication Technologies for Ageing Well and e-Health (ICT4AWE 2024), pages 204-211
ISBN: 978-989-758-700-9; ISSN: 2184-4984
Proceedings Copyright © 2024 by SCITEPRESS – Science and Technology Publications, Lda.

way. However, this process would not allow for bet-
ter disease tracking due to a monthly forecast and not
following the progress of the disease through days
or weeks. The key components of our approach are
mainly composed in the model of machine learning,
Random Forest, which is an ensemble method that
consists of the use of decision trees with the method
of bagging. Then, we train and test the model with
weekly data of confirmed cases of leishmaniasis from
2017 to 2022, obtained through a request form to
the Cusco Regional Health Management (GERESA -
CUSCO)
6
and meteorological data obtained from the
official web app of the National Meteorological and
Hydrological Service of Peru (SENAMHI)
7
.
Our main contributions are as follows:
• We build an ML model for weekly prediction of
CL cases based on meteorological data and con-
firmed cases.
• We have identified meteorological risk factors and
possible cases in La Convencion through weekly
predictions from 1 to 4 weeks ahead in 2023 as
well as reporting possible outbreaks.
• We have conducted an experimental analysis to
show the feasibility of our approach.
This paper is distributed in the next sections: First,
we review in Section 2 studies related to the study
and prediction of epidemics of viral infections and
neglected tropical diseases, and their risks. In sec-
tion 3, we will discuss the main contribution of our
research, introduce background and overview related
to the prediction and forecast of epidemics, to finally
explain the method of our approach. Then, in Sec-
tion 4, we present all the experiments performed with
the model of ML their metrics, and how we improve
those metrics. Finally, in Section 5 conclusions of our
work will be presented.
2 RELATED WORKS
Epidemiological study has been showing a big growth
in different diseases in recent years. The covid-19
pandemic set a huge increase in different studies and
approaches in areas like machine learning and deep
learning. Therefore, this area has diverse methods to
detect, predict or forecast using models of ML and
DL applying techniques like classification and regres-
sion. The next articles show a brief outlook on several
studies related to NTDs and the methods they used to
predict cases.
6
https://sites.google.com/view/geresacusco/inicio
7
https://www.senamhi.gob.pe/?&p=estaciones
In (Zhao et al., 2020), the authors propose a Ran-
dom Forest (RF) model that will compete against an
Artificial Neural Network (ANN), searching for the
best results at predicting dengue cases in Colombia,
with pooled national data and department data, this
data uses various predictors, like previous dengue
cases, air temperature, population counts and educa-
tion. Both models are evaluated with Mean Abso-
lute Error (MAE) and then compared using the Rel-
ative MAE. Instead, we are predicting cases of leish-
maniasis using RF, using data from a specific region
in Cusco called La Convencion, besides we don’t in-
clude data like population or socio-economic factors,
since we only look for a correlation between climate
data and its impact in the number of new cases.
In (Harvey et al., 2021), the authors use a combi-
nation of Gaussian Processes and Random Forest Re-
gressors to predict malaria cases over a period of 13
weeks in Burkina Faso, so it can validate a warning
system for a potential epidemic. They use data from
the Integrated e-Diagnostics Management of Child-
hood Illness (IeDA) for the confirmed diagnosis of
malaria, and after a selective process, they decide to
use rainfall, because it improves the precision of the
algorithm. Instead, we use data of confirmed cases
obtained from health organizations in Peru using it as
a target. The predictors that we use are: precipitation,
humidity, and temperature. And we only use Random
Forest for the prediction because, to the best of our
knowledge in the literature, we found that RF is the
most robust model for our scenario.
In (Elsheikh et al., 2021), the authors propose
an LSTM model to predict confirmed cases, recov-
ered cases, and deaths of COVID-19 in Saudi Arabia
three weeks ahead. Also, they compare the proposed
model with a statistical model called AutoRegres-
sive Integrated Moving Average (ARIMA), and an
AI model called Nonlinear AutoRegresive Artificial
Neural Networks (NARANN). The data they utilize
to train the models are from the official report from
the Ministry of Health using the confirmed cases, re-
covered cases, and deaths in three different periods of
time. The evaluation criteria, they use, for the models
are seven RMSE, R
2
, MAE, EC, OI, COV, and CRM.
On the other hand, our approach uses only confirmed
cases, because mortality rates of CL in Peru are low
having 1 confirmed death in 2022
5
, and data of recov-
ered cases are hard to obtain.
In (da Silva et al., 2021), the authors propose
a method that combines Ensemble Empirical Mode
Decomposition (EEMD) with Autoregressive Inte-
grated Average Exogenous inputs (ARIMAX), named
EEMD-ARIMAX to analyze the correlation between
human mobility and meteorological data with the
A Regression Based Approach for Leishmaniasis Outbreak Detection
205
number of COVID-19 cases in the capitals of Brazil.
For their data of COVID-19 cases, they use Brasil.io,
which is a website that compiles newsletters from the
State Health Secretariats of Brazil, for the meteoro-
logical data they use data from the Centro de Previsa o
de Tempo e Estudos Clim
´
aticos and used Minimum
and Maximum Temperature, Humidity, and Rainfall,
and the human mobility data they use the COVID-
19 Community Mobility Reports given by Google, it
shows the trends of mobility in certain places, like
Retail and recreation, Parks, Workplaces, etc. Us-
ing RMSE, ME, and MAE they evaluate the predic-
tions for their method, and they compare it with ARI-
MAX. They normalized their data, showing an im-
provement in their method in metrics like RMSEW.
In contrast, we use meteorological data and confirmed
cases to find correlations and predict the number of
cases weeks ahead, instead of finding patterns with
the trends of population or climate data using a time
series model like ARIMA.
In (Nguyen et al., 2022), the authors searched a
model that can accurately predict dengue cases in
Vietnam with meteorological factors, for this, they
compared Convolutional Neural Network (CNN),
Transformers, Long Short-Term Memory (LSTM),
and Attention-enhanced LSTM (LSTM-ATT) with
more traditional machine learning models like XG-
Boost, Super Vector Regressor (SVR), etc. Their
data was constituted with monthly incident confirmed
cases and deaths for dengue and meteorological data
like average monthly temperature, maximum average
monthly temperature, monthly rainfall, monthly av-
erage relative humidity, monthly evaporation, total
monthly sunshine hours, etc.
For the evaluation of models in a time period of
one to three months, they use RMSE and MAE, they
also assessed the months between outbreaks or not
for the model LSTM-ATT, for this epidemic detec-
tion they used four metrics, which are: accuracy, pre-
cision, sensitivity, and specificity. In contrast, we use
weekly data, due to that type of format data gives us
an opportunity to follow and visualize if there are me-
teorological patterns that could increase the spread of
CL, since the granularity of weekly data may cause a
loss of patterns.
3 CONTRIBUTION
3.1 Preliminary Concepts
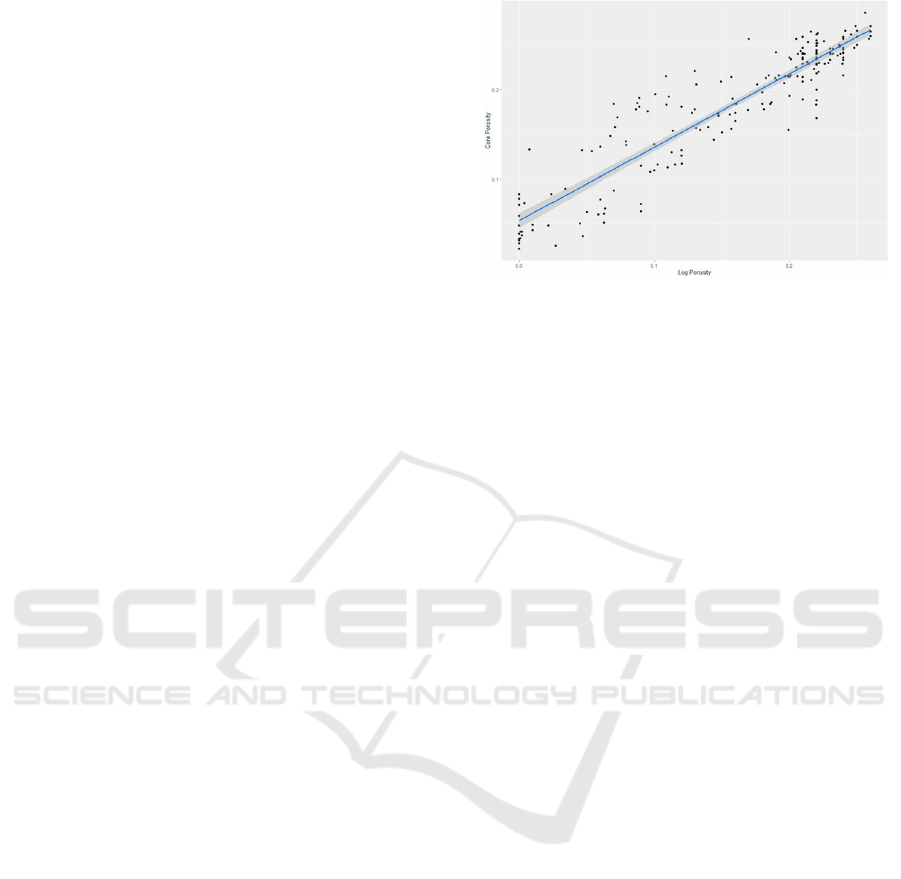
Definition 1 (Regression (Chandramouli et al.,
2018)). Regression is the process of finding an asso-
ciation or relation of a dependent variable, which is
Figure 1: Example of linear regression (Al-Mudhafar,
2020).
the variable that we want to predict, with independent
variables that are known as predictors.
Example 1 (Regression). Figure 1 represents the
structure of a linear regression model, showing the
relationship between two variables.
Definition 2 (Ensembled Models (Zhou, 2021; Sarkar
and Natarajan, 2019)). It’s a technique that combines
the outputs of different models of machine learning
to get a better result in comparison to each model on
their own, for this reason, they are usually built with
simpler models but it also applied to stronger models
so it can use less of them.
The ensemble has various techniques that include:
Averaging (taking the average of the outputs between
all the models to get its final result), Boosting (using
weak learners and, through multiple iterations, con-
verts them into strong learners, focusing on the mis-
takes of the hypothesis), Bootstrapping (the model
obtains a sampling that will be used as an input for
the models and the output will be the most voted or
an average if the case is a regression), Bagging (based
on bootstrap sampling, it takes a dataset with a num-
ber of samples, takes a random sample, and copies it
in the sampling set, it keeps the sample so it can be
chosen again and repeats the process several times).
Definition 3 (Decision Trees (Zhou, 2021)). It’s a
representation of the choices and decisions a person
can make in each situation in the structure of a tree,
being the branches as the multiple decisions that a
person can take, and the leaves being nodes of the
outcomes or states of every decision, and the root is
the initial state of the situation.
Definition 4 (Random Forest (Zhou, 2021)). It works
as an extension of the bagging method, using the ran-
domness of bootstrapping to create decision trees so
they are different from each other, so it can reduce
overfitting and make the outcome more precise. It
ICT4AWE 2024 - 10th International Conference on Information and Communication Technologies for Ageing Well and e-Health
206
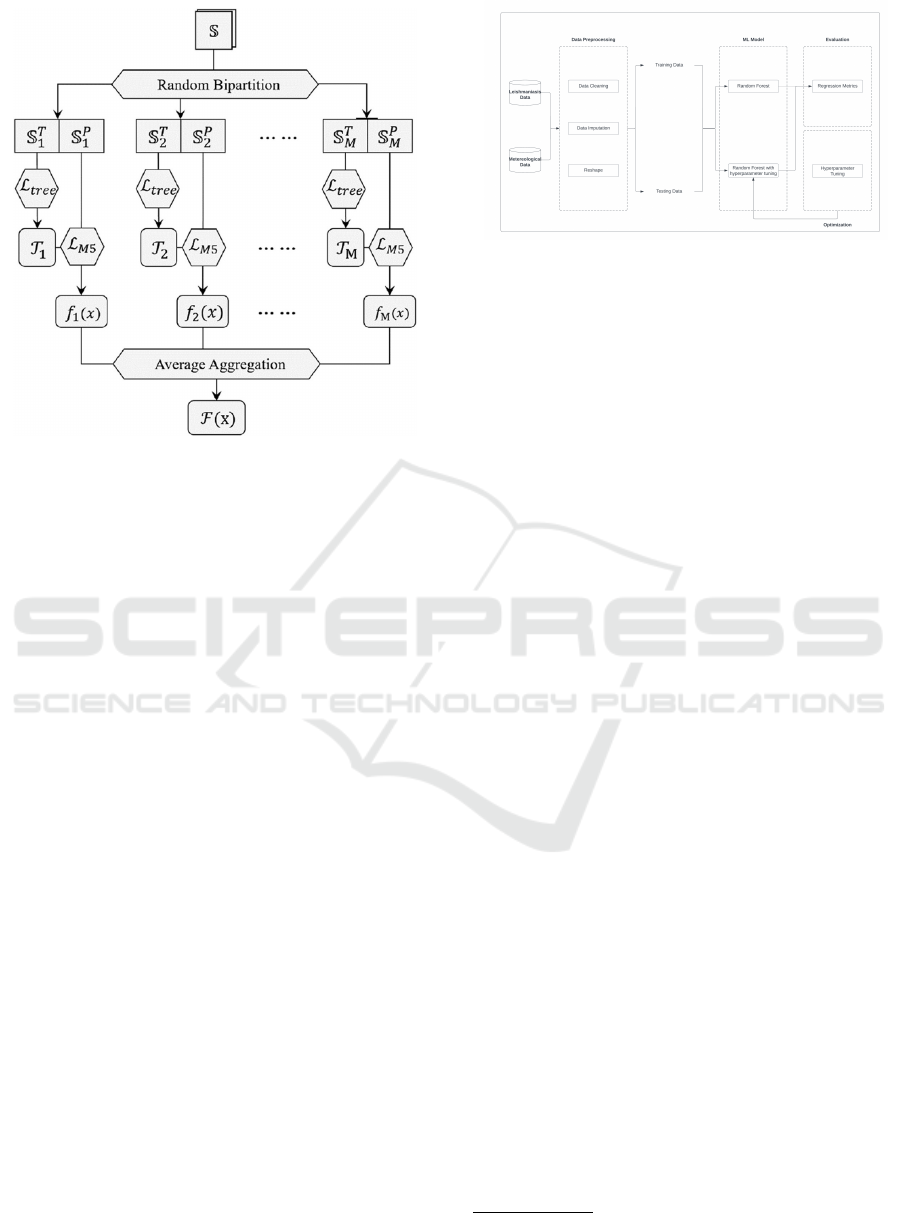
Figure 2: Structure of Random Forest (Ao et al., 2019).
usually starts with a lower performance with fewer
trees but with more learners it can get better perfor-
mance, also it has a low computational cost.
Example 2 (Random Forest). In Figure 2, we see the
structure of a Random Forest with the partitions of
samples for every decision tree, the outputs of these,
and the final solution made with average aggregation.
3.2 Method
The method designed to predict leishmaniasis out-
breaks consists of a group of stages. The whole pro-
cess begins with collecting the data, then we con-
tinue with Data preprocessing, which is involved the
process of cleaning the data detecting missing values
and removing noisy data; Data resampling, where we
change the format of the dataset to weekly variables
and we also apply feature engineering in this process
to get new variables like the average temperature of
the week. After the preprocessing stage, we have the
model stage, where we start setting the partition of
our dataset for training and testing. This second stage
is made with the Random Forest Regressor, we train
and test the model and we analyze the first results of
the model in the evaluation stage with regression met-
rics. The third stage corresponds to the optimization
process, different techniques will be used to get the
best parameters for our model and improve error pre-
dictions and improve our metrics (Figure 3).
Figure 3: Method Diagram.
3.2.1 Data Preprocessing
Two datasets were collected for this study, one of
them corresponds to meteorological data that was
obtained from the official website of the Meteoro-
logical Service of Peru
8
from 2017 to 2022. The
data was provided hourly, with attributes like tem-
perature, humidity, precipitation, wind direction, and
wind speed. Leishmaniasis data was obtained through
a request form to the Cusco Regional Health Man-
agement (GERESA - CUSCO)
9
, this dataset con-
tains only confirmed cases of leishmaniasis from the
province of La Convencion in a weekly format.
Data cleaning is the first technique used in this
stage, the meteorological dataset had a lot of miss-
ing values that were handled imputing those hours
and dates that were missing, then the meteorologi-
cal values were imputed with a linear interpolation
method. The percentage of missing values is pre-
sented in Table 1. The Leishmaniasis dataset had 28
weeks of missing data, to solve this problem we re-
moved those values in order to avoid noise. Clas-
sic imputation techniques can’t be applied directly to
this type of data due to the different behavior of the
disease through the weeks and its spread. Then, we
have the resampling process, due to the formats of the
datasets (hourly format and weekly format). This pro-
cess has two stages:
1. We resample the meteorological dataset in a daily
format here we also apply feature engineering to
get new variables: minimum, maximum, and av-
erage temperature and humidity of the day.
2. In the second stage, we resample the dataset to a
weekly format and we combine the whole dataset
with leishmaniasis cases.
After applying feature selection and considering epi-
demiological variables we found that wind direction
and wind speed won’t impact to the prediction of
the cases, due to their correlation coefficients (0.045,
8
https://www.senamhi.gob.pe/?&p=estaciones
9
https://sites.google.com/view/geresacusco/inicio
A Regression Based Approach for Leishmaniasis Outbreak Detection
207

Table 1: Missing Values %.
Attribute
Missing Values (%)
1 Temperature 8.47%
2 Humidity 8.53%
3 Precipitation 21.36%
4 Wind Speed 8.68%
5 Wind Direction 8.68%
0.12). The final dataset resulted in 233 rows, and
7 variables: mintemp, maxtemp, avgtemp, minhum,
maxhum, avghum and prec.
3.2.2 Synthetic Data
This technique consists in creating new artificial data
for the training set based on our existing dataset. We
propose this method due to a lack of data and its future
impact on the performance of the model. We use Syn-
thetic Data Vault (SDV) (Patki et al., 2016) to build
the new training dataset for our model. This process
consists in prepare the data for the training of the SDV
model, here we load the data and define the format of
each variable. Then we have the modeling stage, SDV
provides different models called synthesizers, for this
project FAST ML
10
was used. The model learns from
the existing data and then we sample new data based
on the number of new rows that we want.
3.2.3 Random Forest
RF is an ensemble model that uses decision trees with
a bagging method, so it can prevent overfitting. RF
has many decision trees that use different samples of
data and train separately from each other, each tree
produces different results that are ranked and select-
ing the best result. In this stage, we use the sklearn
library of the Random Forest Regressor
11
. For our
RF model, we define training and testing in a differ-
ent way, with our approach of using synthetic data
we cannot use all the original dataset to generate new
data, because while testing, the model will overfit, to
avoid this problem we split the original dataset having
only the 2022 data to testing and only generating new
data based on years 2017 - 2021.
3.2.4 Evaluation
The evaluation methods that will be used to evalu-
ate the regression model predictions are Mean Ab-
solute Error (MAE) and Root Mean Squared Error
10
https://docs.sdv.dev/sdv/single-table-data/modeling/s
ynthesizers/fast-ml-preset
11
https://scikit-learn.org/stable/modules/generated/skle
arn.ensemble.RandomForestRegressor.html
(RMSE). MAE calculates the sum of all the absolute
differences between the actual and the predicted value
and then divided by the total number of data points.
RMSE is the square root of MSE, and Mean Squared
Error (MSE) is basically the squared difference be-
tween actual and predicted value.
Both metrics represent similarities because they
determine how close is the prediction to the actual
values on average, even detecting large errors in the
case of RMSE. Low values of MAE and RMSE indi-
cate that de model is correctly predicting and larger
values represent poor prediction.
3.2.5 Optimization
In order to optimize our model and get better results in
our metrics we will use hyperparameter tuning. This
technique uses different methods to obtain the best
set of hyperparameter values that produce better re-
sults in the model’s performance. Random forest has
several hyperparameters that can be modified to get
better performance. Getting the best set of hyperpa-
rameters can be challenging if we do it manually, so
in this study, we will use different methods such as
random search, grid search, and Three-based Pipeline
Optimization (TPOT).
• Grid Search (GS). GS is one of the most common
techniques to optimize hyperparameters. Its func-
tionality is relatively simple, we create a grid of
different hyperparameters values then GS fits in
every combination, saves every performance for
each set created, and selects the best performance
as output.
• Random Search (RS). This technique uses a
method that chooses random values of a prede-
fined set of hyperparameters, then in each iter-
ation fits the model with a set chosen and re-
turns the best set after several iterations. Ran-
dom Search performs better when we have a large
search space and also takes less time than GS to
show results.
• Three-Based Pipeline Optimization (TPOT) (Le
et al., 2020). It’s a machine learning tool that
uses genetic programming to help to find the best
pipeline for a machine learning model. For this
study, we use TPOT to get the best set of hyper-
parameters for Random Forest.
ICT4AWE 2024 - 10th International Conference on Information and Communication Technologies for Ageing Well and e-Health
208

4 EXPERIMENTS
4.1 Experimental Protocol
All our was conducted with Google Colab, a free ver-
sion of a Python environment. Colab provides 12.7
GB of ram and 107.7 GB of disk to write and exe-
cute Python code and store files for up to 12 hours.
Dataset files were stored in google drive and imported
with a Python library gdown. For the optimization
stage, a dictionary of parameters was determined and
the possible values for each parameter are shown in
Table 2. Our code is publicly available in: https:
//github.com/RyzewitchChicken/LMR-Code.git
4.2 Results
The proposed work carried out several experiments in
order to get better metric values and reduce error pre-
diction. Those experiments are presented in different
scenarios where we defined hypotheses and present
the results of them.
Scenario 1. The first scenario performed is re-
lated to training and testing the model with the orig-
inal dataset. The experiment resulted in MAE and
RMSE values, 3.97 and 4.91 respectively.
Scenario 2. After several tests with synthetic data,
Table 2: Values for optimization.
Parameter Possible Value
Number of
estimators
100, 200, 300, 400, 500 - 1500
Max features sqrt, log2
Max depth 10, 20, 50, 65, 70, 90, 110, none
Min samples split 2, 5, 10
Min samples leaf 1, 2, 4
Table 3: Synthetic data values test.
Quantity of rows
MAE
1,500 3.91
4,500 3.90
7,500 3.91
10,500 3.77
13,500 3.89
Table 4: Result of Optimizers.
Optimizer
Quantity of
estimators
Min
samples
split
Min
samples
leaf
Max
features
Max
depth
Random
Search
700 10 2 sqrt 10
Grid
Search
1200 5 4 log2 90
TPOT 400 2 2 sqrt 65
we concluded by adding 10,500 new rows of data to
the original dataset based on the results of MAE val-
ues, see Table 3. In this experiment, we got better
value metrics in comparison with the original dataset,
3.77 in MAE and 4.56 in RMSE. The distribution of
new data in comparison with real data is shown in
Figure 4. Until this scenario, random forest hyper-
parameters were not modified, so settings were used
by default based on the sklearn library.
Scenario 3. Table 4 shows the optimizers’ best
results according to the values established in Table 2.
Random search performs slightly better in compari-
son to TPOT and grid search, having a better value in
RMSE with 4.42 (Table 5) and being faster than oth-
ers because of the random selection of hyperparam-
eters. On the other hand, grid search also has good
results but performs badly in RMSE getting 4.51, due
to its search space and all combinations evaluation,
grid search tends to be computationally slow.
Scenario 4. In order to get better metric values,
we propose a hypothesis that our model tends to per-
form badly due to the low case periods and according
to our research approach (predict outbreaks) we con-
sider that low case periods would be not necessary. In
this scenario, we performed two experiments: i) We
considered that cases lower than 5 cause low perfor-
mance. Our model struggles to predict minor values
causing large prediction errors and resulting in higher
MAE and RMSE values. We conducted an experi-
Figure 4: Distribution comparison between synthetic and
real data.
Table 5: Metric Results.
Experiment MAE RMSE
Random Forest (Original Dataset) 3.97 4.91
Synthetic Data 3.77 4.56
Random Forest + Random Search 3.65 4.42
Random Forest + Grid Search 3.67 4.51
Random Forest + TPOT 3.64 4.47
Random Forest + Cases > 5 2.79 3.48
Random Forest + Cases > 7 2.27 2.93
A Regression Based Approach for Leishmaniasis Outbreak Detection
209

(a) 8 weeks ahead.
(b) 16 weeks ahead.
Figure 5: Predicting Outbreaks.
ment where we deleted values lower than 5 and we
got better results, having 2.79 in MAE and 3.48 in
RMSE. And, ii) for the second experiment we tested
values higher than 7. In this case, we even got bet-
ter results in our metric error, MAE 2.27 and 2.93 in
RMSE, an improvement of 18.64% in MAE in com-
parison to the previous MAE value. Important to
mention that scenario 4 experiments were conducted
with our best model and the optimizer (Random For-
est + Random Search), a big improvement consider-
ing that MAE dropped from 3.65 to 2.27 and that our
model has problems predicting low values. All met-
ric values of the different experiments performed are
shown in Table 5.
Prediction. With our previous results in the fourth
scenario, we can finally generate predictions having
our best model. In Figure 5a and Figure 5b, we gen-
erate an 8-week and 16-week prediction, all these
predictions correspond to the first 4 months of 2023
(January, February, March, and April). Both Figures
present the cases of 2022 and the predictions gener-
ated, in both, we can see that the province of La Con-
vencion won’t show outbreaks and the trend shows no
outbreaks for the incoming months. The way that we
detect an outbreak is by using the Z-score method if
we detect an outlier in our set of predictions we define
that as an outbreak.
4.3 Discussion
Metrics. In order to get better metric values and re-
duce MAE and RMSE we performed several exper-
iments (Table 5). Considering that the lowest MAE
and RMSE value we get is the better our model per-
forms, we proposed a few techniques to achieve. The
first experiment gave us a perspective on how the
model is performing with the original dataset, we
found that missing values and zero values cause noise
and reduce our dataset size, therefore, our model per-
formed badly with high metric values and a higher
RMSE value of 4.91. Synthetic data helped us to get
more rows with a similar distribution to the original
dataset, showing that with this technique we can re-
duce error prediction going from 3.97 in MAE to 3.77
and 4.91 in RMSE to 4.56.
We compared three optimizer techniques where
Random Search performed a bit better than TPOT,
having similar results in MAE with 3.65 and 3.64 and
a slight difference in RMSE with 4.42 and 4.47. Grid
Search also performs similarly in MAE (3.67) but
struggles to get a good RMSE value getting 4.51. On
the other hand, we have Table 4 results. We put out at-
tention to the number of estimators and ”max depth”,
Grid Search costs a high computationally perfor-
mance due to the values in estimators 1200 and 90
in max depth, more estimators and higher depth for
a tree tend to have a higher training time. Random
Search and TPOT have different results, with more
estimators for RS with a lower depth tree but fewer
estimators for TPOT with a higher depth tree. Even
with more estimators RS performed a little faster than
TPOT, this is caused because of the depth. In RF,
max depth defines the number of splits for each de-
cision tree, so in the case of RS takes less time for
the model to train due to fewer splits. This experi-
ment shows that hyperparameter tuning was a good
approach because reduces significantly error predic-
tion, we went from 3.77 with synthetic data without
modifying hyperparameters and using it based on the
setting of sklearn to 3.65 testing different combina-
tions of hyperparameters.
Our last experiment proposed a hypothesis based
on how our model was performing until the last sce-
nario. We have shown that zero values caused noise
in the model and produced bad performance, but go-
ing deeper into the experiments, we noticed that the
model was still struggling with low values. Two tests
were conducted with a similar approach, dropping
those values that may cause trouble for the model.
These two experiments showed that having cases val-
ues higher than 5 and 7 caused better metric values,
in MAE and RMSE improved error prediction from
3.65 to 2.79 and 2.27, in the case of RMSE from 4.42
to 3.48 and 2.93. These major changes helped us in
predicting larger values to detect outbreaks in the fu-
ture which makes our model better to predict larger
cases but worst to predict lower cases.
Model. Feature importance is an important technique
ICT4AWE 2024 - 10th International Conference on Information and Communication Technologies for Ageing Well and e-Health
210

to analyze our model and how our attributes are con-
tributing to predicting leishmaniasis cases. Based on
our analysis maximum humidity is the most important
feature in the prediction, representing 18%. Average
temperature and minimum humidity represent another
15% and 14% of contribution while precipitation rep-
resents the lowest importance with 11%. We can see
that humidity has a good correlation with leishmania-
sis cases while there is a low correlation between pre-
cipitation and our target variable (cases), but we no-
ticed that this might be related to the meteorological
dataset.
5 CONCLUSION
In this work, we used a Random Forest model to pre-
dict leishmaniasis cases and possible outbreaks in the
future. As an ensembling model, RF shows good
results in predicting cases. We performed several
tests to get a better model with less error prediction,
showing that our original dataset was really small and
caused problems for the model. Even with synthetic
data, our error prediction was high, so an optimization
process was necessary. Optimizers showed great re-
sults, Random Search and a genetic algorithm (TPOT)
performed better than an approach like Grid Search
reducing error prediction in metrics like MAE from
3.77 to 3.64-65.
Our first approach was deleting 0 values due to the
noise that causes, but we noticed that low values cause
trouble. We proposed two experiments where we con-
sidered that low values won’t be necessary. After sev-
eral tests, we conclude that cases greater than 5 and 7
contribute to getting better metrics values with an im-
provement of 24% and 38% (MAE) respectively. That
experiment causes a model that is better at predicting
high values but worst at low values. Finally, we no-
ticed that humidity and temperature are the most im-
portant predictors.
As an extension of this work, a better and bigger
dataset is necessary to get a better model with the cor-
rect recollection of meteorological data and epidemi-
ological data. On the other hand, NTDs have several
diseases that cause problems in different parts of the
world.
REFERENCES
Al-Mudhafar, W. J. (2020). Integrating machine learning
and data analytics for geostatistical characterization of
clastic reservoirs. Journal of Petroleum Science and
Engineering, 195:107837.
Ao, Y., Li, H., Zhu, L., Ali, S., and Yang, Z. (2019). The
linear random forest algorithm and its advantages in
machine learning assisted logging regression model-
ing. Journal of Petroleum Science and Engineering,
174:776–789.
Chandramouli, S., Dutt, S., and Das, A. (2018). Machine
Learning. Pearson Education India, 1st edition.
da Silva, T. T., Francisquini, R., and Nascimento, M. C. V.
(2021). Meteorological and human mobility data on
predicting COVID-19 cases by a novel hybrid decom-
position method with anomaly detection analysis: A
case study in the capitals of brazil. Expert Syst. Appl.,
182:115190.
Elsheikh, A. H., Saba, A. I., Elaziz, M. A., Lu, S., Shan-
mugan, S., Muthuramalingam, T., Kumar, R., Mosleh,
A. O., Essa, F., and Shehabeldeen, T. A. (2021). Deep
learning-based forecasting model for covid-19 out-
break in saudi arabia. Process Safety and Environ-
mental Protection, 149:223–233.
Harvey, D., Valkenburg, W., and Amara, A. (2021). Predict-
ing malaria epidemics in burkina faso with machine
learning. PLOS ONE, 16(6):1–16.
Le, T. T., Fu, W., and Moore, J. H. (2020). Scaling tree-
based automated machine learning to biomedical big
data with a feature set selector. Bioinform., 36(1):250–
256.
Nejad, F. Y. and Varathan, K. D. (2021). Identification of
significant climatic risk factors and machine learning
models in dengue outbreak prediction. BMC Medical
Informatics Decis. Mak., 21(1):141.
Nguyen, V.-H., Tuyet-Hanh, T. T., Mulhall, J., Minh, H. V.,
Duong, T. Q., Chien, N. V., Nhung, N. T. T., Lan,
V. H., Minh, H. B., Cuong, D., Bich, N. N., Quyen,
N. H., Linh, T. N. Q., Tho, N. T., Nghia, N. D., Anh,
L. V. Q., Phan, D. T. M., Hung, N. Q. V., and Son,
M. T. (2022). Deep learning models for forecasting
dengue fever based on climate data in vietnam. PLOS
Neglected Tropical Diseases, 16(6):1–22.
Patki, N., Wedge, R., and Veeramachaneni, K. (2016). The
synthetic data vault. In DSAA, pages 399–410. IEEE.
Sarkar, D. and Natarajan, V. (2019). Ensemble Machine
Learning Cookbook. Packt Publishing, 1st edition.
Xu, J., Xu, K., Li, Z., Meng, F., Tu, T., Xu, L., and Liu,
Q. (2020). Forecast of dengue cases in 20 chinese
cities based on the deep learning method. Interna-
tional Journal of Environmental Research and Public
Health, 17(2):453.
Zhao, N., Charland, K., Carabali, M., Nsoesie, E. O.,
Maheu-Giroux, M., Rees, E., Yuan, M., Garcia Bal-
aguera, C., Jaramillo Ramirez, G., and Zinszer, K.
(2020). Machine learning and dengue forecasting:
Comparing random forests and artificial neural net-
works for predicting dengue burden at national and
sub-national scales in colombia. PLOS Neglected
Tropical Diseases, 14(9):1–16.
Zhou, Z.-H. (2021). Machine learning. Springer, Gateway
East, Singapore.
A Regression Based Approach for Leishmaniasis Outbreak Detection
211
