
Metrics to Estimate Model Comprehension: Towards a Reliable
Quantification Framework
Bastian Tenbergen
1 a
and Marian Daun
2 b
1
Department of Computer Science, State University of New York at Oswego, Oswego, U.S.A.
2
Center of Robotics, Technical University of Applied Sciences W
¨
urzburg-Schweinfurt, Schweinfurt, Germany
Keywords:
Model-Based Software Engineering, Graphical Representations, Model Comprehension, Model Quality,
Empirical Study.
Abstract:
Model-driven development has established itself as one of the core practices in software engineering. Increases
in quality demands paired with shorter times to market and increased mission-criticality of software systems
have sensitized software engineering practitioners to make use of not only formal, but also semi-formal mod-
els, particularly graphical diagrams to express the system under development in ways that facilitate collabo-
ration, validation & verification, as well as configuration and runtime monitoring. However, what does and
does not constitute a “good” model, i.e., a model that is fit for a practical purpose? While some model quality
frameworks exist, the trouble with most of these is that they often lack the ability to concretely quantify and
thereby objectively differentiate a “good” from a “poor” model, i.e., models that can be easily understood by
the model reader. Without being able to reliably produce easily comprehensible models, training new team
members during on-boarding or educating software engineering students is dramatically hindered. In this
paper, we report on a research trajectory towards reliably measuring the comprehensibility of graphical dia-
grams.
1 INTRODUCTION
Model-based engineering has been taught for decades
at universities and in the past decennium it has widely
spread into industrial use and become an established
technique, particularly in safety critical domains.
While graphical models also serve a purpose of doc-
umentation (i.e., serving a permanent role in the sys-
tem’s specification), their most essential characteristic
is to facilitate stakeholder communication (i.e., serv-
ing a transient role in knowledge exchange). Hence,
key to successful communication is to create models
that are understood by all users the same way. No
ambiguity may exist among the stakeholders regard-
ing what the model expresses. This comprises both
the need for the model to adequately reflect the se-
mantics of the universe of discourse, but also be free
from syntactic errors. It must be noted that in many
cases, errors both with regard to semantic adequacy
and syntactic correctness can in practice be forgiven,
as it is often desirable to create a ”quick and dirty”
a
https://orcid.org/0000-0002-0145-4800
b
https://orcid.org/0000-0002-9156-9731
model in order to move forward the discussion with
the team. However, when the models are meant to be-
come part of the specification and when not all team
members have the same understanding of the ”quick
and dirty” model, the development process can be
slowed down dramatically. Moreover, inadequacies
or defects in models can remain covert, thereby hid-
ing mistakes from developers until their rectification
becomes much more costly in later phases of develop-
ment (Boehm, 1984) or, in the worst case, can remain
covert until loss of life or severe security breaches oc-
cur during operation.
It is therefore essential to sensitize established
practitioners as well as educate software engineer-
ing graduates to the quality of conceptual models
through dedicated training. While of course educa-
tors, coaches, and practitioners employ certain ped-
agogical strategies to foster model quality (Muller,
2015; Daun et al., 2017), an objective, repeatable way
to ascertain the semantic and syntactic comprehensi-
bility largely depends on the domain or the involved
individuals. While several model quality frameworks
to assess comprehensibility (among other factors)
have been proposed in the past (e.g., (Krogstie et al.,
498
Tenbergen, B. and Daun, M.
Metrics to Estimate Model Comprehension: Towards a Reliable Quantification Framework.
DOI: 10.5220/0012684800003687
Paper published under CC license (CC BY-NC-ND 4.0)
In Proceedings of the 19th International Conference on Evaluation of Novel Approaches to Software Engineering (ENASE 2024), pages 498-505
ISBN: 978-989-758-696-5; ISSN: 2184-4895
Proceedings Copyright © 2024 by SCITEPRESS – Science and Technology Publications, Lda.

2006; Nelson et al., 2012)), these often suffer from a
lack of practical applicability and are abstract.
In this paper, we propose a framework of con-
crete metrics for model comprehension that may en-
able practical applicability. We furthermore propose
an empirical experimental design to investigate which
of these concrete metrics are suitable over others and
how they relate to one another. The goal of this is to
find the best way to objectively quantify the compre-
hensibility of a given model. In future work, we shall
experimentally validate our proposed measurements
and generalize our framework.
This paper is structured as follows. Section 2
discusses the backgroud on good and poor models
and summarizes the related work on model compre-
hension metrics. Section 3 outlines our proposed
framework using the Goal Question Metric frame-
work (Basili and Rombach, 1994). Section 4 pro-
poses an experimental design to validate the frame-
work. Section 5 concludes this manuscript.
2 RELATED WORK
2.1 Aspects Model Comprehension
The term ”model comprehension” commonly refers
to stakeholders’ ability to understand a graphical dia-
gram in a way that facilitates a shared understanding
of all stakeholders’ regarding a system under develop-
ment (Hermann et al., 2022). Who these stakeholders
are may differ between development projects and in
consequence, the choice of modeling languages will
differ as well. For example, highly formalized petri-
nets may not be adequate to discuss the needs of end
users, but may be exactly the right tool to discuss tim-
ing concerns with safety auditors. Similarly, semantic
and syntactic aspects related to adequacy or correct-
ness may impair understanding if, e.g., the modeler
does not understand the meaning of the elements in
modeling language or makes syntactic mistakes when
creating a diagram. Yet, while guidance is available
regarding the choice of modeling language (Brambilla
et al., 2017), and while problem catalogs can help ad-
dress issues in semantic and syntactic understanding
through directed training efforts (Reuter et al., 2020),
practical factors and visual properties of a diagram
may impair its comprehension. Take for example the
following two diagrams shown in Fig. 1 and Fig. 2,
created as part of a undergraduate course in safety
software engineering. Both figures represent UML
state machine diagrams and both describe the same
system under development: a robot that traverses a
labyrinth while avoiding obstacles.
There is quite obviously a subjective quality dif-
ference between both models. Both diagrams contain
states labeled with ”discretized” gerund forms remi-
niscent of actions (e.g., ”entering path waypoints” or
”driving forward”). On the one hand, Fig. 1 is sim-
plistic to the point of superficial, yet process execu-
tion and triggering events are quickly understandable.
Events are represented using transitions depicted as
Bezier-type arrows. Details pertaining to implemen-
tation details are not depicted, but perhaps could be
part of lower-level diagrams detailing the inner work-
ings of the state. Unfortunately, the student modelers
neglected to provide these with their solution, hence
decreasing model completeness. However, there are
no syntactic errors.
On the other hand, Fig. 2 shows a model with
much higher level of detail, to the point of seeming
complete. The modelers availed themselves of some
advanced features of state machine diagrams, such
as hierarchical and parallel substates as well as event
guards. Transitions are depicted using straight arrows
with rounded corners, however, some of them look
”crooked” (i.e., are not perfectly horizontal or ver-
tical). However, syntactic errors show a state with
no exit transition ”store and location” in an other-
wise unexplained parallel substate ”waiting for end”,
which the student modelers neglected to further ex-
plain. Overall, the diagram has a much higher infor-
mation density.
Which of these two diagrams is better? Should
a modeler sacrifice completeness for ease of under-
standability or be as complete as possible in a dia-
gram? Does layout and connector spacing aid under-
standing or impair it? Are the labels such that they
assist implementation or raise questions instead? All
of these factors and many more have been proposed in
the past as factors influencing model comprehension,
which we will explore in the next section.
2.2 Factors Influencing Model
Comprehension
Research on model comprehension differentiates be-
tween factors concerning the model interpreter, the
process in which the model is used (e.g., the software
development process), and the model itself. In this
paper, we focus on factors pertaining to the model
itself. In previous work, we investigated metrics to
determine the quality of model comprehension by the
model interpreter. For instance, in (Daun et al., 2021),
we have shown that self-rated experience and confi-
dence are bad predictors for the quality of model com-
prehension. In other work, we compared the effect
different modeling languages have on the user. We
Metrics to Estimate Model Comprehension: Towards a Reliable Quantification Framework
499
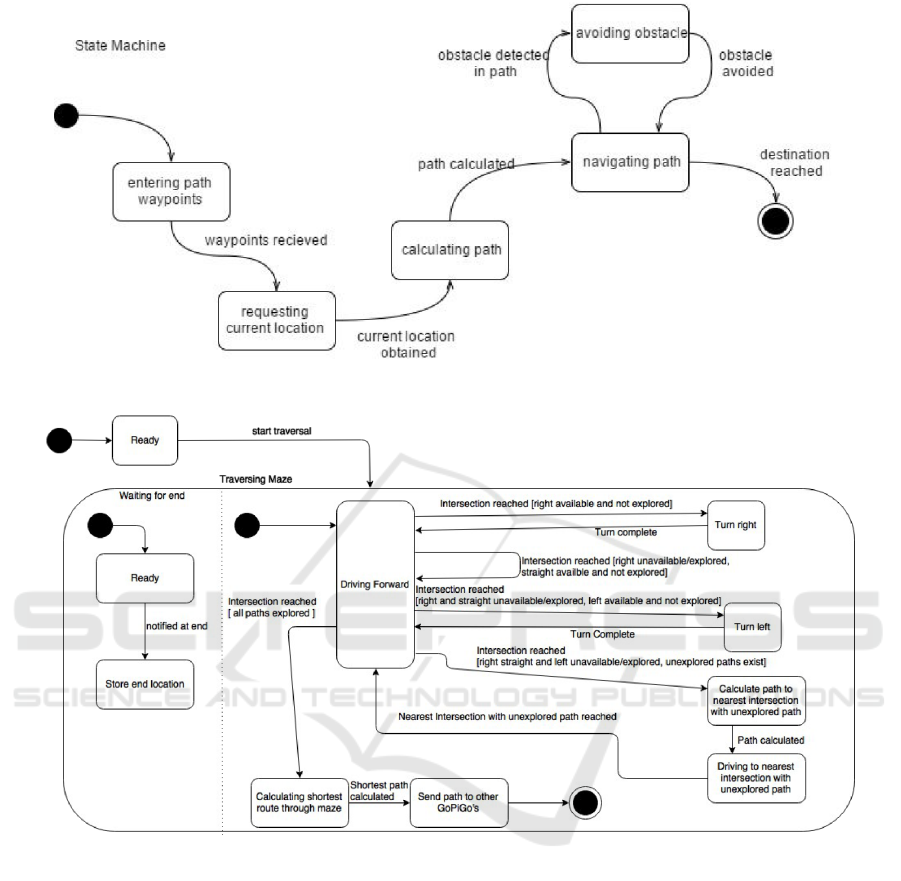
Figure 1: Example of a UML State Machine Diagram with ”poor” apparent quality.
Figure 2: Example of a UML State Machine Diagram with ”high” apparent quality.
have shown that depicting the same situation in mod-
els of different modeling languages is differently per-
ceived. For instance, the quality of model comprehen-
sion is higher when interpreting sequence charts com-
pared to functional specifications (Daun et al., 2019).
Other findings include that the generation of dedi-
cated views can improve understanding but the need
for investigating multiple orthogonal views can de-
crease understanding of the overall specification (Ten-
bergen et al., 2018; Bandyszak et al., 2018).
In (Hermann et al., 2022), we conducted a system-
atic literature survey of 109 included primary studies
from 1995 to 2018 to find research dealing with met-
rics that explain model comprehension. Our analy-
sis revealed that the most commonly studied factors
influencing model comprehension are visual features
and layout (45 out of 109 primary studies), mostly
in UML class (24 primary studies) and BPMN dia-
grams (27 primary studies). From more than 79 pri-
mary studies dedicated to experimental evaluation of
model comprehension, we elicited 30 factors influ-
encing model comprehension (for details, see (Her-
mann et al., 2022)).
Investigations so far suggest an impact of the
model size on the model’s quality for model compre-
hension. For instance, the number of classes and their
relationships has an impact for class diagrams (Gen-
ero et al., 2001; Genero et al., 2000). Other studies for
class diagrams suggest that the number of aggrega-
tions and hierarchy relations used has an impact (Figl,
2012), or relationships in general (Lange et al., 2005;
Esperanza Manso et al., 2009; Yusuf et al., 2007) or
ENASE 2024 - 19th International Conference on Evaluation of Novel Approaches to Software Engineering
500

the overall size in terms of number of classes, rela-
tionships, and aggregations (Lange et al., 2005).
Other factors are the naming and semantics of a
model. For instance the use of guidelines for label-
ing elements can improve communication and un-
derstanding (Huang, 2008). In particular, the use
of semiotically clear language has a positive impact
on model comprehension (Sharif and Maletic, 2009)
as well as the simplicity of symbols used (Di Cerbo
et al., 2011). Other metrics target the complexity of
a model, for instance, the amount of information con-
tained within a model (Marriott et al., 2012) or the
nestedness of a diagram (Cruz-Lemus et al., 2005).
A further category of approaches deals with the lay-
out of a model like the proximity of model elements
to each other (Abrah
˜
ao et al., 2013), the number of
crossing edges (Genero et al., 2002) or the connect-
edness of a model (Anda et al., 2001).
In the next section, we present out framework for
measuring the quality of model comprehension which
we created using the Goal Question Metric (GQM) to
structure the metrics presented above.
3 A FRAMEWORK FOR
MEASURING THE QUALITY
OF MODEL COMPREHENSION
3.1 Goal Question Metric
As we saw in Section 2, some of the metrics identified
in our literature survey (Hermann et al., 2022) are not
operationalized. This means that there are no con-
crete instructions to quantify a diagram (e.g., “degree
of semiotic clarity” in (Krogstie et al., 2006)). To al-
leviate this issue, we employ the Goal Question Met-
ric (GQM) approach. GQM is a systematic method
to arrive at concrete ways to measure properties in
software engineering purposefully (Basili and Rom-
bach, 1994). The underlying premise is that concrete
metrics can only be defined when considering their
purpose with regard to a common goal. Intermedi-
ate questions help refine the goal from the perspec-
tive of a specific stakeholder involved in a task. To
this end, the GQM approach defines a top-level con-
ceptual goal, intermediate level operationalizations of
the goal (“questions”), and a quantitative level with
specific data that can be measured (“metric”). Goals
are usually defined for an object under study, such
as a software engineering process or artifact. Ques-
tions refine the goal, sometimes in several subordinate
levels, and are usually posed to characterize proper-
ties about the object under study, which in turn are
concretely measured through metrics. In the follow-
ing section, we will make use of the GQM approach
to identify concretely measurable metrics for non-
operationalized metrics from the literature.
3.2 Metric Candidates for a Model
Comprehension Framework
To refine the set of candidate metrics from Section 2
into less vague and concretely measurable metrics, we
pursued two goals: (1) to combine equivalent metrics
from the literature, and (2) to systematically quantify
non-countable metrics. In doing so, we strictly fol-
lowed Berander and J
¨
onsson’s approach to arrive at
an efficient measurement framework (Berander and
J
¨
onsson, 2006) shown in Figure 3.
As can be seen, the framework differentiates be-
tween metrics that quantify diagram size, specifically
the number of nodes and entities and edges and re-
lationships. This is because most of the metrics in
Section 2 indicate aspects pertaining to the size of
the model as one of the dominant characteristics in-
fluencing comprehension. In fact, the literature sug-
gests a negatively reciprocal relationship between size
and comprehension: the larger the model, the harder
to comprehend (Hermann et al., 2022). The size
of the model is typically understood as the number
of nodes or entities therein. Nodes and entities in-
clude UML classes, lifelines, states or partitions, but
also model elements typically associated with rela-
tionships between elements, such as decision/merge
nodes or fork/joins.
The framework further recognizes metrics pertain-
ing to layout. While at first glance, these metrics seem
easily quantifiable, the problem with such metrics is
that their quantification is not transferable between
two diagrams, regardless of model type. Even if two
diagrams document the same subject and are of the
same model type (e.g., activity diagrams document-
ing the procedure of a user logging in to an online
account), differences in layout may decrease visual
clarity and thereby comprehensibility. It is therefore
essential to quantify these metrics relative to the over-
all physical size of the diagram as measured, e.g., in
pixels, inches, or centimeters.
Finally, the framework contains metrics that must
be qualified cognitively. These metrics not only dif-
fer in objectivity between two diagrams of the same
type and content, but also between the persons who
read the diagram. Generally, less required explana-
tion, complexity, and simpler names make a diagram
easier to understand. Yet, to what degree the dia-
gram is understandable cannot be counted, as it re-
lates to an internal cognitive process within the model
Metrics to Estimate Model Comprehension: Towards a Reliable Quantification Framework
501
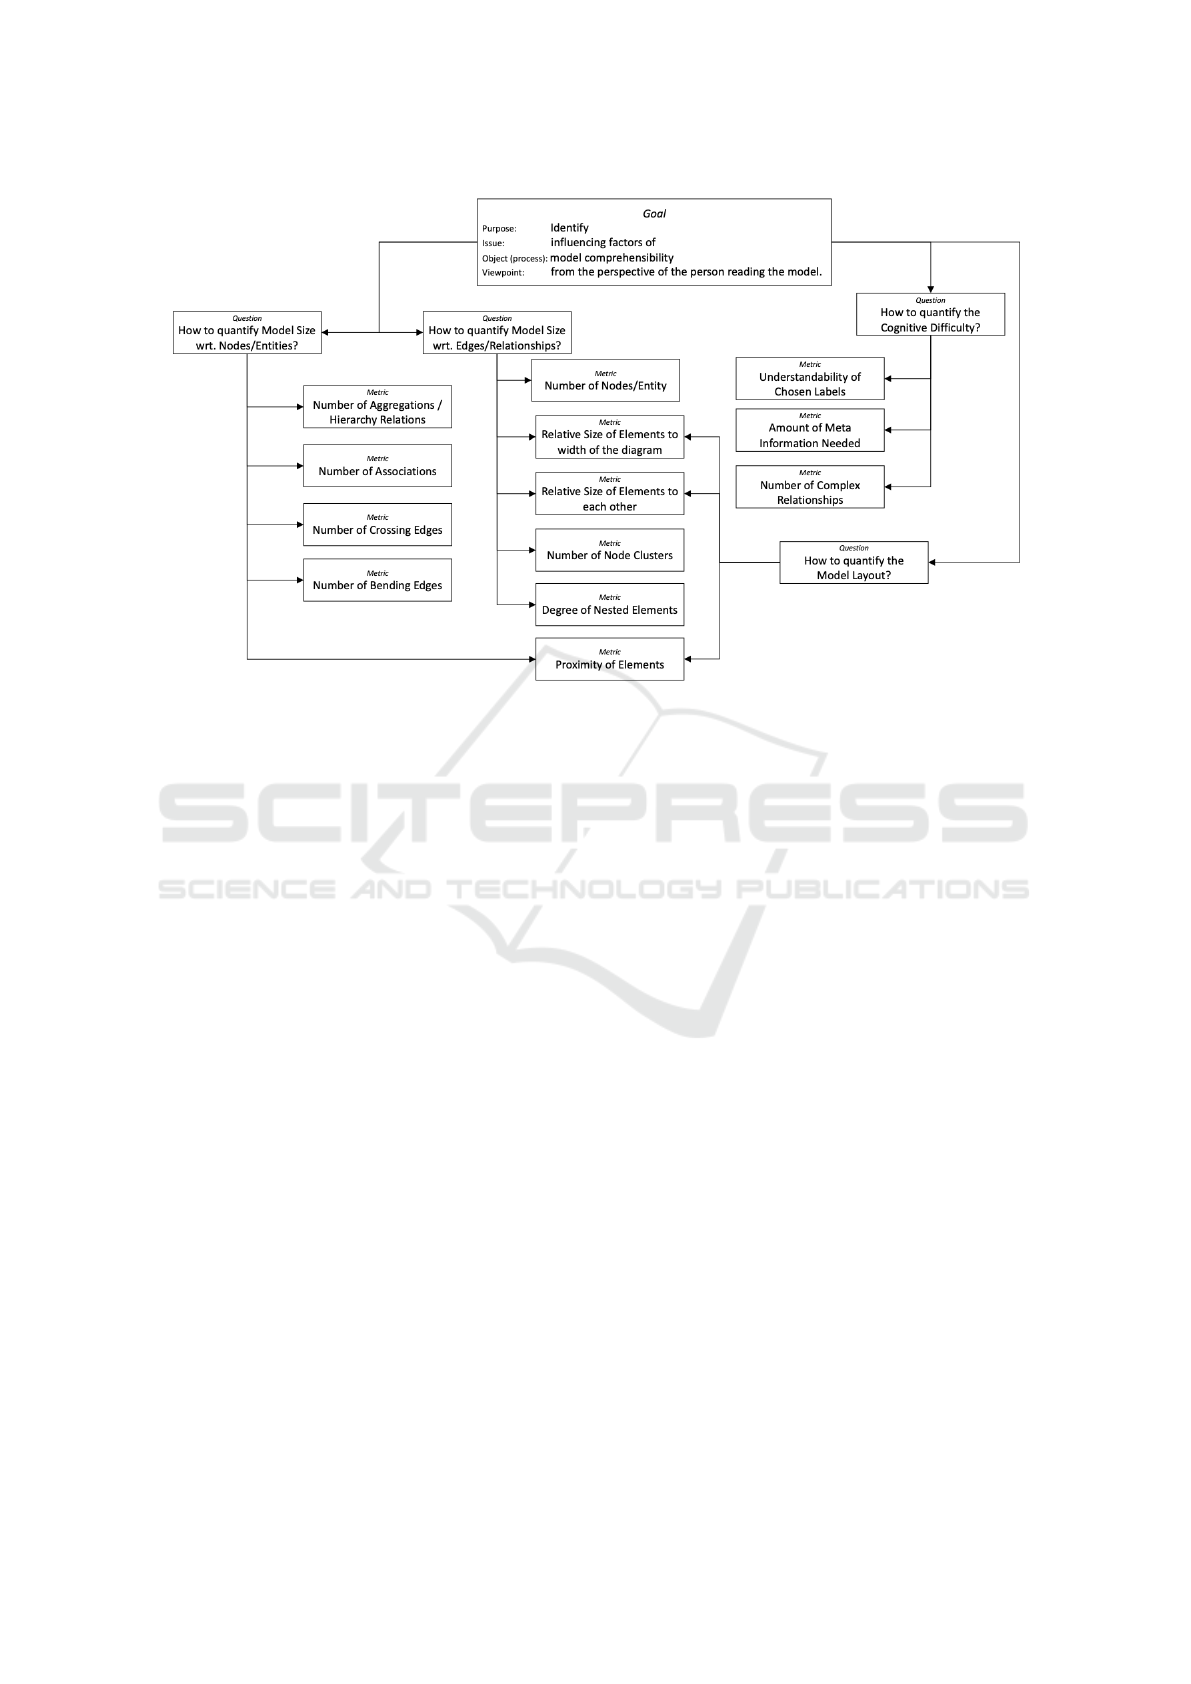
Figure 3: GQM Measurement Framework of Model Comprehension Metrics from the Literature (Hermann et al., 2022).
interpreter that may even differ on the current mood
and level of attention the person has. It is there-
fore necessary to adopt a quantification approach that
introduces comparability between two model inter-
preters’ assessments. Commonly used are five-point
scales ranging from “strongly agree” to “strongly dis-
agree”. Yet, while such scales allow quantification,
they lack comparability. For example, both a software
engineering researcher and a person who served on
OMG’s standardization body drafting the UML may
strongly agree with the notion of being an expert in
UML modeling, yet there might be considerable dif-
ferences in the details of the standard or pragmatism
of UML modeling between the two. We therefore pro-
pose using quantifiable statements with points associ-
ated to categories of experience. For the metric named
above, this could for example be:
• 4: No additional information is needed.
• 3: I needed additional information to understand
one or two model elements or had to ask someone
for help.
• 2: I needed additional information to understand
several model elements or had to ask several peo-
ple for help.
• 1: I needed additional information to understand
all or nearly all model elements, or was not able
to understand the model despite receiving help.
4 STUDY DESIGN AND FUTURE
WORK
In this section, we propose an experimental design to
investigate the suitability of the metrics identified in
Section 3. We are following the structure of reporting
empirical studies proposed by (Wohlin et al., 2012),
as reflected in the following subsections. The goal of
this empirical design is not to elicit a definitive set of
metrics that are valid for any model, but instead to
compare metrics beyond what their original authors
proposed.
4.1 Research Questions & Hypotheses
To experimentally validate our framework from Sec-
tion 3, we define the following research questions:
1. RQ: Which metrics are an adequate measurement
of the perceived comprehensibility of a model,
given the model type?
2. RQ: Which metric or set of metrics are an ade-
quate predictor of model quality, given the model
type?
3. RQ: Are there any metrics that predict model
quality regardless of model type?
To answer these questions, we quantify student-
created models using each metrics outlined in Section
ENASE 2024 - 19th International Conference on Evaluation of Novel Approaches to Software Engineering
502

3 and compare the quantified metric to a score as-
signed by instructors as well as peer reviews (see Sec-
tion 4.2 for details on the model stimuli). We there-
fore define the following hypotheses:
1. HP: There exists a correlation between the quan-
tified value of the metric and the score assigned to
a model.
2. HP: There exists a correlation between the quanti-
fied value of the metric and at least one other met-
ric from different quality properties, for which we
failed to reject HP1.
3. HP: There exists a correlation between the quanti-
fied value of the metric and the score assigned for
at least one more model of a different type.
Correlations may be negative for metrics that min-
imize a value (e.g., fewer line crossings are better)
or positive for metrics that maximize the value (e.g.,
more nodes are better). Hypothesis HP1 directly an-
swers RQ1. Hypothesis HP2 will be accepted if
any two metrics correlated with model score (HP1),
but are from different model quality properties (e.g.,
model size: number of relationships and layout: num-
ber of crossing edges, see Section 3). The result of
HP2 is therefore a set of metrics that together ade-
quately quantify model properties and therefore pre-
dict model quality in the sense of RQ2. Research
question RQ3 is directly addressed by HP3. We ac-
cept evidence in favor of HP3 for any metric for which
we failed to reject HP1 for at least two models, as long
as the models are of a different type (e.g., number of
crossing edges in class diagrams and number of cross-
ing edges in activity diagrams).
4.2 Experimental Stimuli
We will use student-created models from a Require-
ments Engineering course (Tenbergen and Daun,
2019). In this course, students create goal models, use
case diagrams, sequence diagrams, class diagrams,
activity diagrams, and state machine diagrams in as-
signment sheets. The assignment sheets take the form
of providing the students with a natural language de-
scription of a universe of discourse and the task to cre-
ate a specific diagram based on the content of the de-
scription. Scored out of 15 points, the purpose of the
assignment sheets is to practice the creation of graph-
ical models for the purpose of elicitation and docu-
mentation of requirements. The course has been of-
fered annually since 2017 and typically comprises six
assignment sheets, prepared in teams of two students,
evaluated by the instructor. Since 2021, calibrated
peer reviews have been adopted in the course (Ten-
bergen and Daun, 2022), in which student teams eval-
uate and score at least three solutions from their peers
in addition to creating their own solution. Conversely,
each team is evaluated by at least three other teams;
the total score of their solution is calculated from the
average of peer-assigned scored. For peer evaluations,
grading rubrics are created by the instructor and pro-
vided to the evaluating teams. Each year, an average
of 20 students enroll in the course, paired in 10 teams
and creating 8 models across all assignment sheets,
yielding approximately 80 student-created models per
year. This means that overall, more than 500 candi-
date models and their scores can be subjected to each
of the metrics from Section 3. We believe this to be
a robust data set from which to calculate correlations
from.
4.3 Data Preparation & Analysis
To prepare the data for analysis and hypothesis test-
ing, the following steps will be undertaken:
1. All models from all assignments sheets, students,
and years will be collected, striped from informa-
tion identifying students, and instead assigned a
unique identifier.
2. Afterward, all models will be reviewed to assess if
they are suitable for inclusion in this study. While
all models for this course would by default be
included, exclusion criteria may include models
containing profanity, models that were plagiarized
from another team or year, are accidental dupli-
cates, or models that semantically do not fit the
task at hand (e.g., the assignment sheet calls for
creating a class diagram, but the students created
an activity diagram instead). A definitive list of
inclusion and exclusion criteria will be created
once data preparation is under way, but shall be
strictly enforced for all models.
3. For all remaining included models, their ID, their
model type, and score as well as point deductions
(including value of deductions) will be recorded
in a spreadsheet, one row per model.
4. In the spreadsheet, a column will be created for
each metric from Section 3.
5. For each model, a quantified value for each metric
will be calculated and recorded.
Once these calculations are complete, the resulting
data set can be filtered by model type and correla-
tions can easily be computed for each metric and
the models’ scores. Since this mode of analysis is
a merely quantified approach, it is likely that certain
qualitative observations may emerge. For example,
an open question remains if peer reviews gravitate
Metrics to Estimate Model Comprehension: Towards a Reliable Quantification Framework
503

towards naturally applying similar metrics when re-
viewing model quality. Any such observation shall be
recorded by the experimenters.
4.4 Threats to Validity
Like any study, certain threats to validity that stem
from the experimental design remain despite our best
efforts. We have created this experimental design
using pre-existing stimuli out of convenience and
to reduce the time needed for this preliminary re-
search thrust. Therefore, the main remaining threat
to validity concerns generalization and reproducibil-
ity. Since the experimental stimuli are conveniently
selected and the experiment relies on systematic ap-
plication of measurements instead of participant per-
formance, results may not allow conclusively reject-
ing or accepting hypotheses. The stimuli were not
designed with this experiment in mind, their inherent
properties might influence experimental outcome and
hence require secondary validation through follow-up
experimentation. Moreover, the experimental stim-
uli mainly feature UML diagrams, hence yielding
a validation of the framework with regard thereto.
Hence, follow-up experimentation with a dedicated
experiment measuring comprehension of participants
in modeling and model reading tasks must be con-
ducted in order to conclusively validate the frame-
work. Furthermore, since we seek to validate a frame-
work of our own making, experimenter bias impairing
conclusion validity seems applicable. However, the
framework is based on metrics proposed in the litera-
ture and not on our work. In contrast, we seek to re-
ject flawed aspects of this framework early and rigor-
ously, so we can improve it. We are therefore reason-
ably certain that the experimental design we chose is
adequate to validate the framework and generate pre-
liminary insights that can be addressed in follow-up
studies.
5 SUMMARY
In this paper, we have made a case in favor of provid-
ing a generalizable, quantifiable framework to mea-
sure the comprehensibility of graphical models. Such
a framework will assist in reducing the effort needed
in onboarding developers to a project, and assist edu-
cators in teaching aspiring model-driven software en-
gineers in what makes a “good” model. We have
briefly summarized results from our detailed litera-
ture review regarding factors influencing model com-
prehension and used the GQM approach to propose
a framework with concrete quantifiable metrics. We
furthermore presented the design of a preliminary em-
pirical study using readily available stimuli to validate
and improve the framework. Albeit the anticipated
conclusions using this design will be limited due to
the fact that the stimuli were not designed specifically
to measure comprehension, we are confident that our
design will generate initial, reliable insights and allow
us to design a more rigorous follow-up study. This
shall be the topic of future work.
REFERENCES
Abrah
˜
ao, S., Gravino, C., Insfran, E., Scanniello, G., and
Tortora, G. (2013). Assessing the effectiveness of dy-
namic modeling in the comprehension of software re-
quirements: results from a family of five experiments.
IEEE Trans. Softw. Eng, 39(3):327–342.
Anda, B., Sjøberg, D., and Jørgensen, M. (2001). Qual-
ity and understandability of use case models. In
ECOOP 2001—Object-Oriented Programming: 15th
European Conference Budapest, Hungary, June 18–
22, 2001 Proceedings 15, pages 402–428. Springer.
Bandyszak, T., Daun, M., Tenbergen, B., and Weyer, T.
(2018). Model-based documentation of context un-
certainty for cyber-physical systems. In 2018 IEEE
14th International Conference on Automation Science
and Engineering (CASE), pages 1087–1092. IEEE.
Basili, V. R. and Rombach, H. D. (1994). The goal question
metric approach. Encyclopedia of software engineer-
ing, pages 528–532.
Berander, P. and J
¨
onsson, P. (2006). A goal question metric
based approach for efficient measurement framework
definition. In Proceedings of the 2006 ACM/IEEE Int
Symp on Empirical Software Engineering, ISESE ’06,
page 316–325, New York, NY, USA. Association for
Computing Machinery.
Boehm, B. W. (1984). Software engineering economics.
IEEE transactions on Software Engineering, (1):4–21.
Brambilla, M., Cabot, J., and Wimmer, M. (2017). Model-
driven software engineering in practice. Morgan &
Claypool Publishers.
Cruz-Lemus, J. A., Genero, M., Manso, M. E., and Piat-
tini, M. (2005). Evaluating the effect of composite
states on the understandability of uml statechart dia-
grams. In Proceedings of the 8th Int Conf MoDELS
2005, pages 113–125. Springer.
Daun, M., Brings, J., Aluko Obe, P., and Stenkova, V.
(2021). Reliability of self-rated experience and confi-
dence as predictors for students’ performance in soft-
ware engineering: Results from multiple controlled
experiments on model comprehension with graduate
and undergraduate students. Empirical Software En-
gineering, 26(4):80.
Daun, M., Brings, J., Obe, P. A., Pohl, K., Moser, S., Schu-
macher, H., and Rieß, M. (2017). Teaching conceptual
modeling in online courses: Coping with the need for
individual feedback to modeling exercises. In 2017
ENASE 2024 - 19th International Conference on Evaluation of Novel Approaches to Software Engineering
504

IEEE 30th Conf on Software Engineering Education
and Training (CSEE&T), pages 134–143. IEEE.
Daun, M., Weyer, T., and Pohl, K. (2019). Improving man-
ual reviews in function-centered engineering of em-
bedded systems using a dedicated review model. Soft-
ware and Systems Modeling, 18(6):3421–3459.
Di Cerbo, F., Dodero, G., Reggio, G., Ricca, F., and
Scanniello, G. (2011). Precise vs. ultra-light activ-
ity diagrams-an experimental assessment in the con-
text of business process modelling. In Product-
Focused Software Process Improvement: 12th Inter-
national Conference, PROFES 2011, Torre Canne,
Italy, June 20-22, 2011. Proceedings 12, pages 291–
305. Springer.
Esperanza Manso, M., Cruz-Lemus, J. A., Genero, M.,
and Piattini, M. (2009). Empirical validation of
measures for uml class diagrams: A meta-analysis
study. In Models in Software Engineering: Work-
shops and Symposia at MODELS 2008, pages 303–
313. Springer.
Figl, K. (2012). Symbol choice and memory of visual mod-
els. In 2012 IEEE Symp on Visual Languages and
Human-Centric Computing, pages 97–100. IEEE.
Genero, M., Miranda, D., and Piattini, M. (2002). Defin-
ing and validating metrics for uml statechart diagrams.
Proceedings of QAOOSE, 2002.
Genero, M., Olivas, J. A., Piattini, M., Romero, F. P., and
de Calatrava, R. (2001). A controlled experiment for
corroborating the usefulness of class diagram metrics
at the early phases of oo developments. In ADIS.
Genero, M., Piattini, M., and Calero, C. (2000). Early mea-
sures for uml class diagrams. L’objet, 6(4):489–505.
Hermann, J., Tenbergen, B., and Daun, M. (2022). Metrics
to estimate model comprehension quality: Insights
from a systematic literature review. Complex Systems
Informatics and Modeling Quarterly, (31):1–17.
Huang, W. (2008). An eye tracking study into the effects of
graph layout. arXiv preprint arXiv:0810.4431.
Krogstie, J., Sindre, G., and Jørgensen, H. (2006). Process
models representing knowledge for action: a revised
quality framework. European Journal of Information
Systems, 15:91–102.
Lange, C. F., DuBois, B., Chaudron, M. R., and Demeyer,
S. (2005). Experimentally investigating the effective-
ness and effort of modeling conventions for the uml.
Lecture Notes in Computer Science, 4364:91–100.
Marriott, K., Purchase, H., Wybrow, M., and Goncu, C.
(2012). Memorability of visual features in network
diagrams. IEEE Transactions on Visualization and
Computer Graphics, 18(12):2477–2485.
Muller, G. (2015). Challenges in teaching conceptual mod-
eling for systems architecting. In Advances in Con-
ceptual Modeling: Proceedings of ER 2015 Work-
shops, pages 317–326. Springer.
Nelson, H. J., Poels, G., Genero, M., and Piattini, M.
(2012). A conceptual modeling quality framework.
Software Quality Journal, 20:201–228.
Reuter, R., Stark, T., Sedelmaier, Y., Landes, D., Mottok, J.,
and Wolff, C. (2020). Insights in students’ problems
during uml modeling. In 2020 IEEE Global Engineer-
ing Education Conference, pages 592–600.
Sharif, B. and Maletic, J. I. (2009). The effect of layout
on the comprehension of uml class diagrams: A con-
trolled experiment. In 2009 5th IEEE International
Workshop on Visualizing Software for Understanding
and Analysis, pages 11–18. IEEE.
Tenbergen, B. and Daun, M. (2019). Industry projects in
requirements engineering education: application in a
university course in the us and comparison with ger-
many. In Proceedings of the 52nd Hawaii Int Conf on
System Sciences.
Tenbergen, B. and Daun, M. (2022). Calibrated peer re-
views in requirements engineering instruction: Appli-
cation and experiences. In Proceedings of the 55th
Hawaii Int Conf on System Sciences.
Tenbergen, B., Daun, M., Obe, P. A., et al. (2018). View-
centric context modeling to foster the engineering
of cyber-physical system networks. In 2018 IEEE
Int Conf on Software Architecture, pages 206–20609.
IEEE.
Wohlin, C., Runeson, P., H
¨
ost, M., Ohlsson, M. C., Reg-
nell, B., and Wessl
´
en, A. (2012). Experimentation in
software engineering. Springer Science & Business
Media.
Yusuf, S., Kagdi, H., and Maletic, J. I. (2007). Assess-
ing the comprehension of uml class diagrams via eye
tracking. In 15th IEEE Int Conf on Program Compre-
hension, pages 113–122. IEEE.
Metrics to Estimate Model Comprehension: Towards a Reliable Quantification Framework
505
