
Machine Learning Support for Time-Efficient Processing Dangerous
Driving Detection Using Vehicle Inertial Data
Matheus Jo
˜
ao Silva de Almeida, Julia Kerkoff Ladeira, Caio Gabriel Vicentin,
Andre V. Carvalho Costa, Marcia Pasin
a
and Vin
´
ıcius K. Marini
Centro de Tecnologia, Universidade Federal de Santa Maria, Brazil
Keywords:
Efficient Processing, Dangerous Driving, Artificial Intelligence, Machine Learning Techniques.
Abstract:
Detection of dangerous driving behavior is a key component to improving road safety. It can be successfully
carried out using data collected by sensors widely available in smartphones. Current work focuses on two
groups: either they classify drivers in a binary way, into good and bad drivers, or they provide a scoring
scale, allowing for a larger group of categories. This detection of dangerous driving behavior can be done
with high granularity, evaluating a total distance covered by the driver on a trip, or with minute granularity,
through the evaluation of small sections of driving, also making it possible to identify which maneuvers the
driver is carrying out negligently. However, the process of collecting data for dangerous driving behavior is
complicated because the driver needs to carry out these maneuvers, so that a classifier can later detect them,
adding to situations of insecurity in traffic. Moreover, the solution needs to execute efficiently, so that the
detection of dangerous driving behavior can be carried out in real time. Given this problem, we propose a
time efficient dangerous driving detection system using vehicle inertial data. In contrast to other works, we
collected data in a simulation environment with a model car that allows us to perform risky maneuvers, which
would not be possible in a real environment. We identify in our small dataset the dangerous driving behavior
pattern. Thus, given the established pattern, we applied a machine learning method to generate a classifier to
enable the detection of dangerous driving behavior. The resulting system achieved a total average accuracy of
85.61% in our experiments using a small dataset as input towards efficient data processing.
1 INTRODUCTION
The use of motorized vehicles is augmenting more
and more in our country (see Fig. 1). In fact, mo-
tor vehicles are key elements in urban mobility. In
this context, even though there is a few tendency to
improve over the last few years, the number of traf-
fic accidents is still extremely relevant. Due to the
driver behavior, lack of vehicle maintenance, bad road
and bad environment conditions, accidents occur fre-
quently, e and this impacts negatively people’s quality
of life and also on the economy of countries. The
main causes of motor vehicle accidents are human
factors, such as drowsiness while driving or driver
distraction.
Given the human factor, detection of dangerous
driving behavior is mandatory to improve road safety.
It can be successfully carried out using data collected
by sensors widely available in smartphones, such as
accelerometer (ACC) and gyroscope (GYRO). These
a
https://orcid.org/0000-0001-6649-1488
0
50
100
150
200
2007
2008
2009
2010
2011
2012
2013
2014
2015
2016
2017
2018
2019
2020
2021
2022
Brazillian Country Fleet (in millions)
Years
cars
trucks
motorcycle
bus
deaths
accidents
Figure 1: History data of the number of vehicles in circu-
lation
1
, the number of deaths due to traffic accidents
2
, and
the number of accidents on public highways in Brazil
3
.
Figure 1: History data of the number of vehicles in
circulation
1
, the number of deaths due to traffic accidents
2
,
and the number of accidents on public highways in Brazil
3
.
sensors can also be easily embedded in vehicles to-
gether with other sensors such as those to detect driver
1
https://cidades.ibge.gov.br
2
https://datasus.saude.gov.br
3
https://cnt.org.br/painel-acidente
Silva de Almeida, M., Ladeira, J., Vicentin, C., Costa, A., Pasin, M. and Marini, V.
Machine Learning Support for Time-Efficient Processing Dangerous Driving Detection Using Vehicle Inertial Data.
DOI: 10.5220/0012686200003690
Paper published under CC license (CC BY-NC-ND 4.0)
In Proceedings of the 26th International Conference on Enterprise Information Systems (ICEIS 2024) - Volume 1, pages 997-1004
ISBN: 978-989-758-692-7; ISSN: 2184-4992
Proceedings Copyright © 2024 by SCITEPRESS – Science and Technology Publications, Lda.
997

alcohol ingestion (Abu Al-Haija and Krichen, 2022)
(Willis et al., 2019) (Shreshtha et al., 2020), or cam-
eras to capture the driver behaviour inside the vehicle
or even outside the vehicle, which can be used to de-
tect the use of smartphones (Wang et al., 2014) (Yasar,
2017), for example, or any other type of bad driver be-
havior during trips.
Moreover, classifying driver behavior can support
commercial applications such as ride-sharing services
and vehicle insurance services, provide information to
authorities, or serve as support for Advanced Driver
Assistance Systems (ADAS). However, the process of
collecting data for dangerous driving behavior is com-
plicated because the driver needs to carry out these
maneuvers, so that a classifier can later detect them,
adding to situations of insecurity in traffic.
In this paper, we propose a dangerous driving de-
tection system with the support of machine learning
approach which consumes inertial data extracted by
ACC and GYRO devices, towards efficient data pro-
cessing. The analysis of ACC and GYRO data, which
is a feature easily captured through sensors embedded
in the vehicle itself and even in smartphones, is one of
the commonly investigated alternatives to detect dan-
gerous driving behavior. In contrast to other works
(Jeong et al., 2013) (Chen et al., 2015) (Nuswantoro
et al., 2020), to conduct our experiments, we col-
lected data in a simulation environment with a model
car that allows us to perform risky maneuvers which
would not be possible in a real environment. Typi-
cally, the use of data collected in real drive scenarios
allows some form of driver anonymization, while im-
age processing require filters to drive anonymization.
However, as drivers are subject to complying with the
law when driving on the streets, this represents a lim-
itation on the driver’s opportunities to perform risky
maneuvers. Moreover, our solution seeks to perform
efficiently in terms of classification time, so that the
detection of dangerous driving can be carried out in
real time.
Controversially, features associated with acceler-
ation events did not play a significant role in drivers
classification (Van Ly et al., 2013). Braking and turn-
ing events can be more significant potential in drivers
classification. Time headway in high flow freeways
can also impact the accident risk. Headway is the time
interval between successive vehicles’ head in a lane.
Shorter headway corresponds to higher risk of acci-
dents, and was found for drivers with prior accidents
or violations, young drivers, male drivers, drivers with
no passengers and as well as drivers not wearing seat
belt (Evans and Wasielewski, 1983). With regard to
the vehicles characteristics, shorter headway was as-
sociated with newer vehicles and vehicles of interme-
diate mass. Thus, a classifier for detecting danger-
ous driving needs to consider more parameters, such
as headways, braking (Lattanzi and Freschi, 2021)
and turning events, than just vehicle acceleration. We
have not yet added the headway computing to our so-
lution, but we take data from a complete trip in the
analysis, precisely to consider braking and turning
events in our classification approach.
This work is organized as following. In, Section 2,
we describe and categorize previous related work. In
Section 3, we present our methodology to detect dan-
gerous drive behaviour. In Section 4, we discuss the
obtained results. Finally, in Section 5, we present the
paper conclusion.
2 RELATED WORK
Regarding the classification of drivers with regard to
dangerous driving behavior, the detector’s output can
be binary (aggressive/non-aggressive behavior), or on
a scale, with three or more distinct groups. In fact,
proposed techniques for detecting dangerous driving
behavior are nothing new. However, the concept of
dangerous driving sometimes involves particular as-
pects of each country. For instance, some country
legislation do not tolerate the drinking of alcoholic
beverages by drivers (e.g. Brazil, Czech Republic,
Romania, Slovakia), while others allows the ingestion
of a low amount of alcohol. Blood Alcohol Content
(BAC) drink driving limits across many Europe coun-
try usually is 0.5 grams per litre
4
.
In academia, early works did not apply Machine
Learning (ML) techniques for the detection of dan-
gerous driving behavior. A popular metric for detect-
ing dangerous driving has been the analysis of vehicle
speed. Speed and acceleration data acquired with the
support of sensors and GPS embedded in the vehi-
cle can be used to model and analyze driver behav-
ior with the support of data mining techniques (Con-
stantinescu et al., 2010). Drivers were divided into
5 types: non-aggressive, slightly aggressive, neutral,
moderately aggressive and very aggressive. Also, Dy-
namic Time Warping (DTW) can be used to binary
classify drivers (non-aggressive and aggressive) us-
ing as input data ACC measurements, GYRO, mag-
netometer, GPS, and videos (Johnson and Trivedi,
2011). DTW is a method to calculate the optimal
matching, usually with regard to time, between two
data sequences. However, evaluation was conduced
using a modest dataset. Vehicle speed can also be
used to driver classification, such as in (Eboli et al.,
4
https://etsc.eu/issues/drink-driving/blood-alcohol-
content-bac-drink-driving-limits-across-europe/
ICEIS 2024 - 26th International Conference on Enterprise Information Systems
998

2017). A percentage of the average vehicle speed (50-
80%) can be used as parameter to categorize driving
behaviors as safe, unsafe and safe, but potentially dan-
gerous.
Nowadays, in the academia, Machine Learning
(ML) techniques have been frequently applied to
detect dangerous driving using ACC and GYRO
achieved data. The most popular classifiers, with re-
gard to dangerous drive detection, are Support Vec-
tor Machine (SVM) (Jeong et al., 2013) (Chen et al.,
2015) (Nuswantoro et al., 2020) (Lattanzi and Fres-
chi, 2021) e CNN, which has gain more attention is
recent years (Baheti et al., 2018) (Shahverdy et al.,
2020) (Masood et al., 2020) (Zhang et al., 2020).
SVM can be applied to detect lateral hazardous
driving movements, such as lane changes and zigzag
driving (Jeong et al., 2013). Data from 172 hazardous
driving movements was collected using the vehicle’s
onboard GYRO. An average total accuracy of ≈85%
was achieved in the experiments. A set of six types
of abnormal driving behaviors was identified: weav-
ing, swerving, sideslipping, fast U-turn, turning with
a wide radius and sudden braking. Experiments were
conducted in real driving environments with 20 vol-
unteers driving during 4 months, and the proposed ap-
proach achieved an average total accuracy of ≈ 95%.
Another work (Chen et al., 2015) also applied SVM
classifier to detect the dangerous drive behaviour but
using data from ACC and GYRO devices present in a
smartphone.
Recent works also compared SVM with other
classifiers, such as in (Nuswantoro et al., 2020) and
(Lattanzi and Freschi, 2021). Artificial Neural Net-
work (ANN) and SVM can be used for classifying
a broad set of driver movements (normal behaviour,
zig-zag, sleepy, turn right, turn left, U-turn, sudden
braking, sudden acceleration, and speed bumps) per-
formed by motorcycle drivers, such as in (Nuswan-
toro et al., 2020). Experiments were conducted in real
driving environments with 5 volunteers driving all the
movements. The proposed approach with ANN clas-
sifier outperformed the SVM classifier with an aver-
age total accuracy of ≈96% and ≈87%, respectively.
A combination SVM and Feed-Forward Neural
Network (FFNN) classifiers were used to recognize
safe and unsafe driving behaviors, such as in (Lattanzi
and Freschi, 2021). Acceleration, braking and vehicle
speed values were collected in the experiments with
more than 26 hours of driving by 10 drivers. The con-
ducted experiments shown an average accuracy above
90% for both classifiers with a slight advantage of the
FFNN classifier.
Deep learning can also be applied to the detection
of dangerous driving using inertial data from the vehi-
cle, GPS and images captured by cameras, such as in
(Khodairy and Abosamra, 2021). The classifier out-
put was proposed in order to meet different demands
such as driver protection, needs of the automotive in-
surance industry and ADAS requirements. Two clas-
sification outputs were used, one with three classes
(normal, drowsy and aggressive behaviors) and a bi-
nary classification model (safe/unsafe).
A method for dangerous driving behavior predic-
tion using a combination of cloud data and Elman
neural network (CM-ENN), based on vehicle mo-
tion state estimation and passenger’s scores about the
drivers, was proposed by (Xiang et al., 2021). Ex-
periments were conducted in real traffic scenarios and
demonstrate that the proposed method is more ac-
curate and robust than classical neural network ap-
proaches.
Convolutional Neural Networks (CNN) have been
also widely applied to classify driver behavior us-
ing vehicle data (such as acceleration, gravity, RPM,
speed, and throttle (the amount of accelerator pedal
is pushed)) (Shahverdy et al., 2020), and/or images
obtained obtained through in-vehicle cameras (Zhang
et al., 2020) (Masood et al., 2020) (Baheti et al.,
2018). In fact, the most recent academic works show
a trend towards using the CNN classifier. A research
question that is still under wide discussion is the need
to divide drivers in a binary way or in a more detailed
classification. In a recent work (Shahverdy et al.,
2020), the CNN classifier is able to distinguish driver
behaviour into five classes: safe or normal, aggres-
sive, distracted, drowsy, and drunk driving. (Baheti
et al., 2018) (Masood et al., 2020) (Zhang et al., 2020)
divided driver behaviour in a much larger number of
classes.
In this work, the classifier delivers a binary classi-
fication but the methodology can be easily adapted to
deliver a more detailed classification. The classifier
process data achieved from ACC and GYRO avail-
able in a GoPro 10 Black camera. In contrast to other
works, which use data from real drivers, we use data
achieved from a remote-controlled scale vehicle plat-
form, which allows us to perform riskier maneuvers.
3 METHODOLOGY
In the following, we detail the methodology for clas-
sifying drivers’ behavior into safe and unsafe, using
the neural network as classifier.
Machine Learning Support for Time-Efficient Processing Dangerous Driving Detection Using Vehicle Inertial Data
999
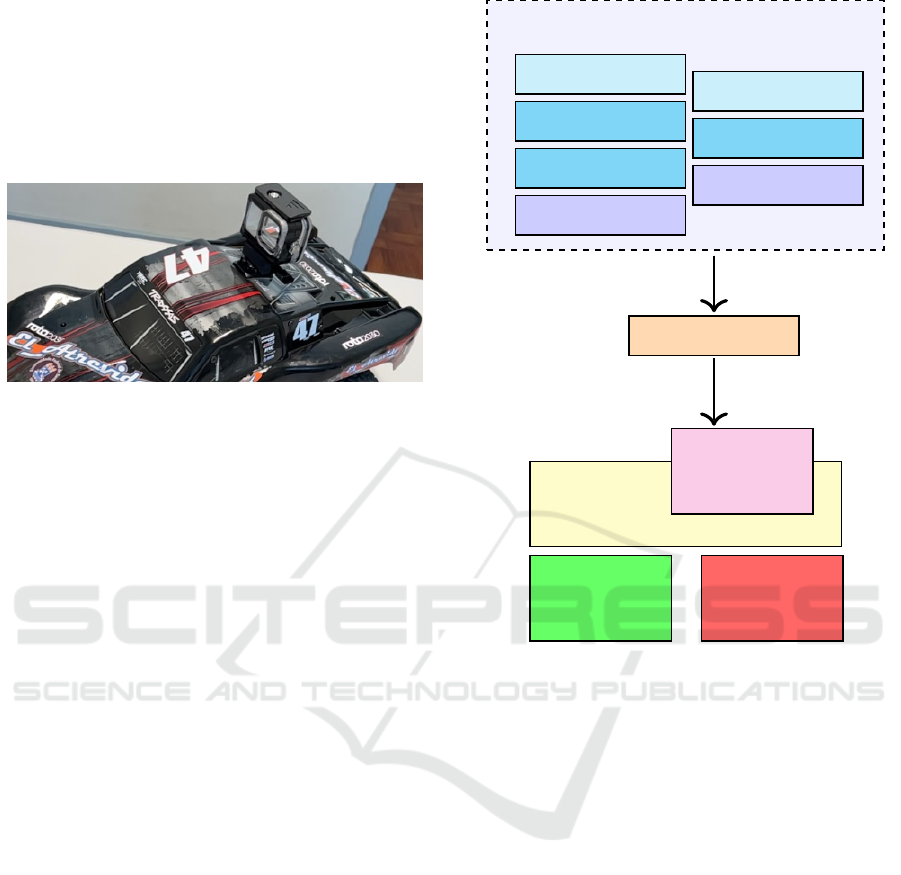
3.1 Data Acquisition
In this project, a remote-controlled scale vehicle plat-
form was used to obtain inertial and ranging sensors
data. For this purpose, a GoPro 10 Black camera
was attached to the rear face of the vehicle shell (see
Fig. 2).
Figure 2: Assembly of the prototype for the remote-
controlled vehicle used in the data acquisition process.
The GoPro camera has a 5.3K-maximum resolu-
tion imaging sensor, which is also capable of captur-
ing video at 2.7K resolution with maximum frame
rate at 240 Hz (Kirschenbaum, 2021). At the same
time, it carries a Bosch BMI 260 inertial unit (Sen-
sortec, 2019) alongside the image sensor, which pro-
vides the acceleration and turning rate data onto the
video mp4-file metadata.
The GoPro 10 captures images in several resolu-
tions and frame rates, configured with a 4K image at
60 Hz frame rate for generating videos and their meta-
data. The mp4 video files from the camera were in-
terpreted through a bin2csv converter tool applied to
binary data from the ffmpeg codec for extracting the
embedded inertial data at a sampling rate of 400 Hz,
with location data sampled at 10 Hz (Irache, 2020).
In order to successfully detect dangerous driving
behaviour through the use of inertial data, it is es-
sential to complement the hardware capability with
software that can make the data useful. Therefore,
a scheme of our data acquisition system setup is de-
picted in Fig. 3.
Raw data achieved from the system is post-
processed to generate a set of features that are in-
dicative of the driving behavior. The data collec-
tion process is iterative, involving initial data gath-
ering, preliminary model training, and evaluation of
the model’s performance. Based on the model’s per-
formance, further data may be gathered to cover iden-
tified gaps or to improve performance in areas where
the model currently underperforms.
Location
≈10 Hz
≈400 Hz
≈60 Hz
Acceleration
Roll/Pitch/Yaw
Image
GoPro (image/inertial unit)
Raw Data (.csv)
Safe
Driving
Dangerous
Driving
ML
Signal
Filters
Figure 3: Data acquisition/filtering approach.
3.2 Driving Scenarios
The recognition of dangerous driving behaviour re-
quires a dataset containing data about driving move-
ments such as accelerating, braking, driving straight
and cornering, with differentiating between safe sce-
narios with moderate driving and more complex and
potentially dangerous maneuvers such as sharp turns,
sudden braking, aggressive acceleration, and erratic
lane changes. Varying road surface conditions can
lead to changes in traction, leading to different de-
grees of tire slip and subsequently, changes in accel-
eration and angular velocity.
In the same manner, the track layout, whether it is
straight or curved, and if the road has bumps and de-
pressions, this significantly impacts the forces experi-
enced by the vehicle and hence the data captured by
the onboard sensors. The experimentation with driv-
ing scenarios was carried out in a flat track with rough
tarmac with a total length of ≈30 m as represented in
Fig. 4.
Each driver started riding around 15 m straight
line to proceed performing curves over six poles
spaced 3 m from each other, and then running back
ICEIS 2024 - 26th International Conference on Enterprise Information Systems
1000
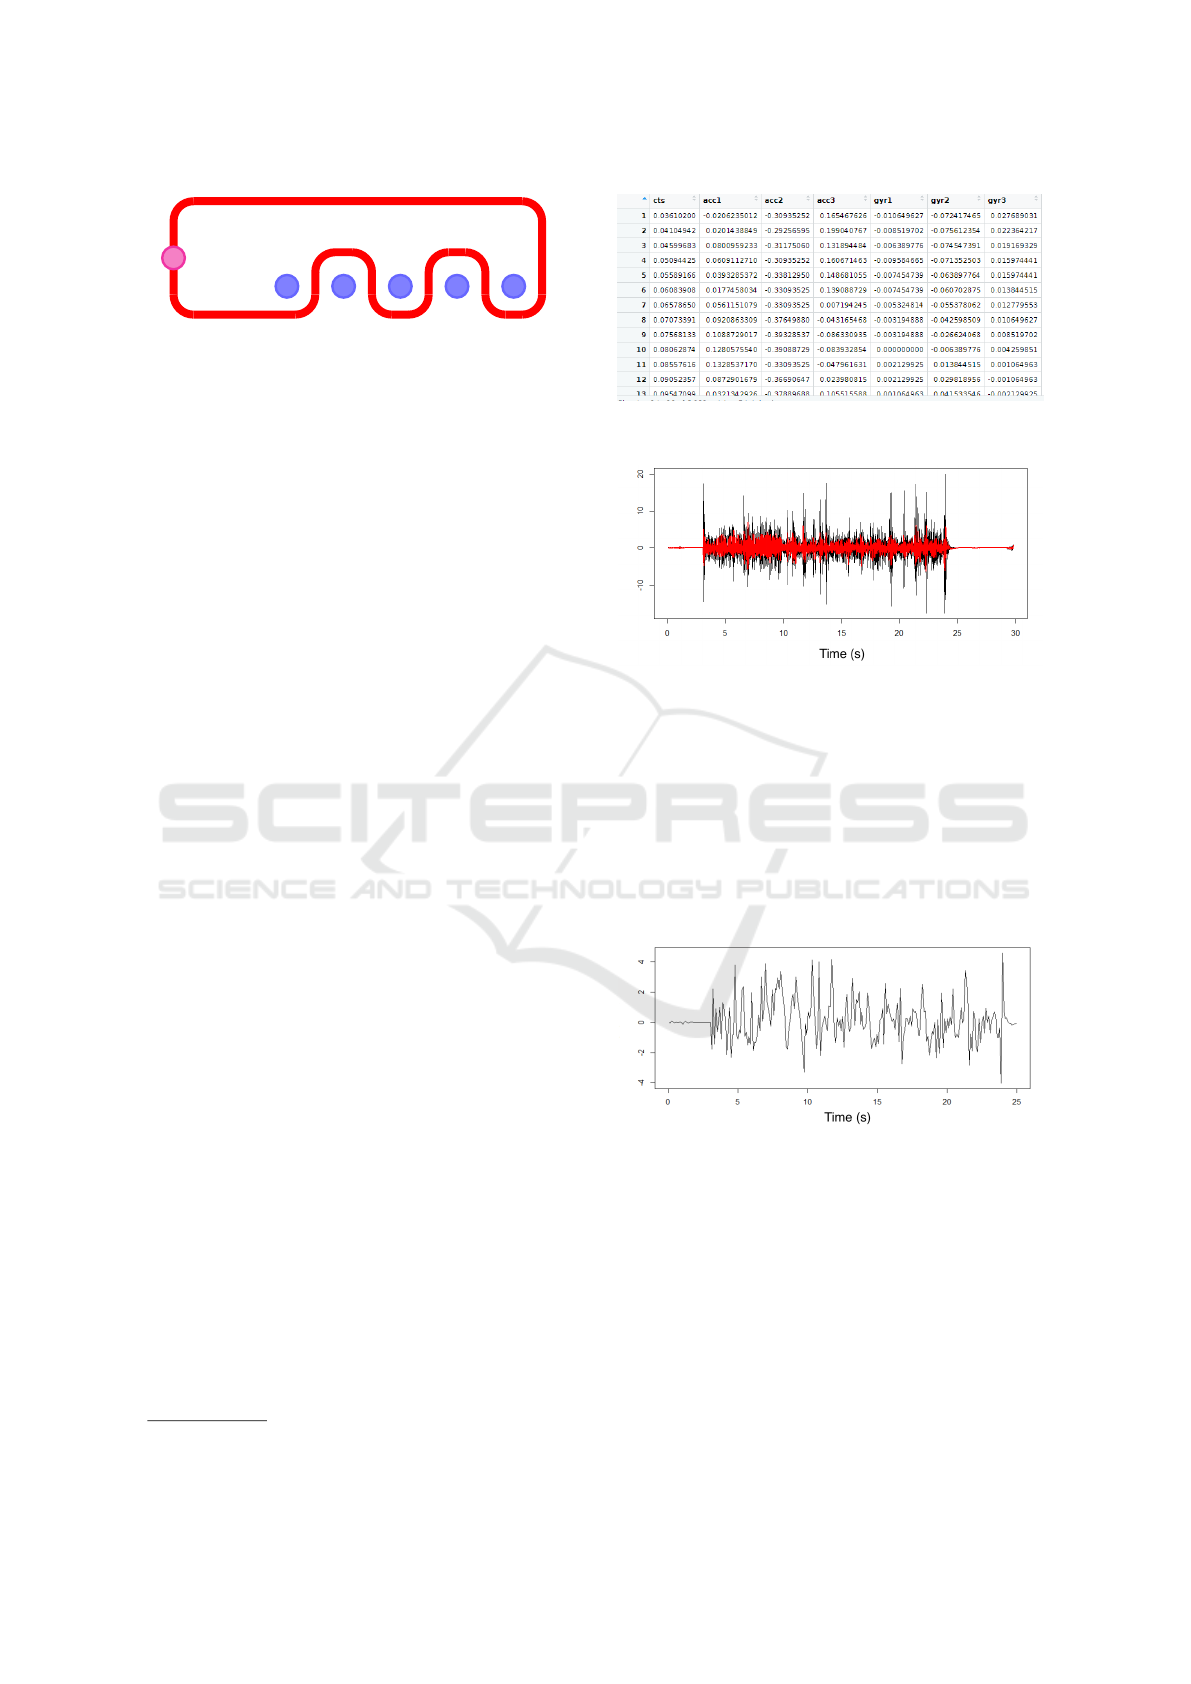
4
3 5 6
2
1
Figure 4: Schematic of the track on which driving scenarios
were performed.
to the starting line after the sixth pole.
For the purpose of gathering data, 8 drivers us-
ing the remote-controlled vehicle platform performed
laps following the track layout above with speeds up
to 10 m/s. The driving sessions were organized in
safe driving runs, and then in dangerous driving runs.
Node 1 indicates the start/end of the route and each
of the nodes 2-6 indicates a pole the driver should
swerve around. The process of acquiring the dynamic
driving data accounted for wet and dry tarmac con-
ditions - there were two driving sessions - alongside
the safe and dangerous driving scenarios, aiming to
improve the output accuracy of the detection model.
3.3 Data Pre-Processing
The data pre-processing phase involves the identifi-
cation and treatment of noise and situations that the
data may manifest. Therefore, it is necessary to have
the appropriate tools that help in the identification and
processing of data.
Therefore, our dataset was reformatted and pro-
cessed before the neural network processing. In this
work, GoPro telemetry data was extracted using a free
online tool, GoPro Telemetry Extractor
5
.
When extracting data relating to ACC and GYRO
by the tool, it is accompanied by data relating to the
camera temperature, date and recording time in ms in
a tabular .csv file. The columns are renamed to more
accessible names and unnecessary data needs to be re-
moved, leaving only the recording time and ACC and
GYRO data in the 3-axes x, y and z. Additionally, the
data on the vertical axis must have the gravity value
(9.8) subtracted and the recording time is converted to
seconds for convenience. Fig. 5 depicts a sample of
the dataset after the conclusion of the pre-processing
step.
In the data, there is still a lot of high-frequency
noise, so it is necessary to filter it using a LowPass
Filter (LPF). LPFs are a good way to remove noise
(both mechanical and electrical) from the ACC. The
LPF used is the Infinite Impulse Response (IIR) filter.
The IIR filter is used so that the computing process
can be carried out as quickly as possible. IIR filters
5
https://goprotelemetryextractor.com/free/
Figure 5: Sample of the dataset after the conclusion of the
pre-processing step.
Figure 6: ACC data: in red, filtered data. In back, raw data.
do not have a phase delay, so there is no time delay.
Fig. 6 depicts a sample of our data before and after
the application of the IIR filters.
Subsequently, downsampling in the data fre-
quency must be carried out so that they can be pro-
cessed quickly by the neural network. The GoPro col-
lects data at a frequency of 200 Hz, which has been re-
duced to 10 Hz. Fig. 7 depicts a sample of our dataset
after frequency downsampling to 10 Hz.
Figure 7: ACC data after downsampling to 10 Hz.
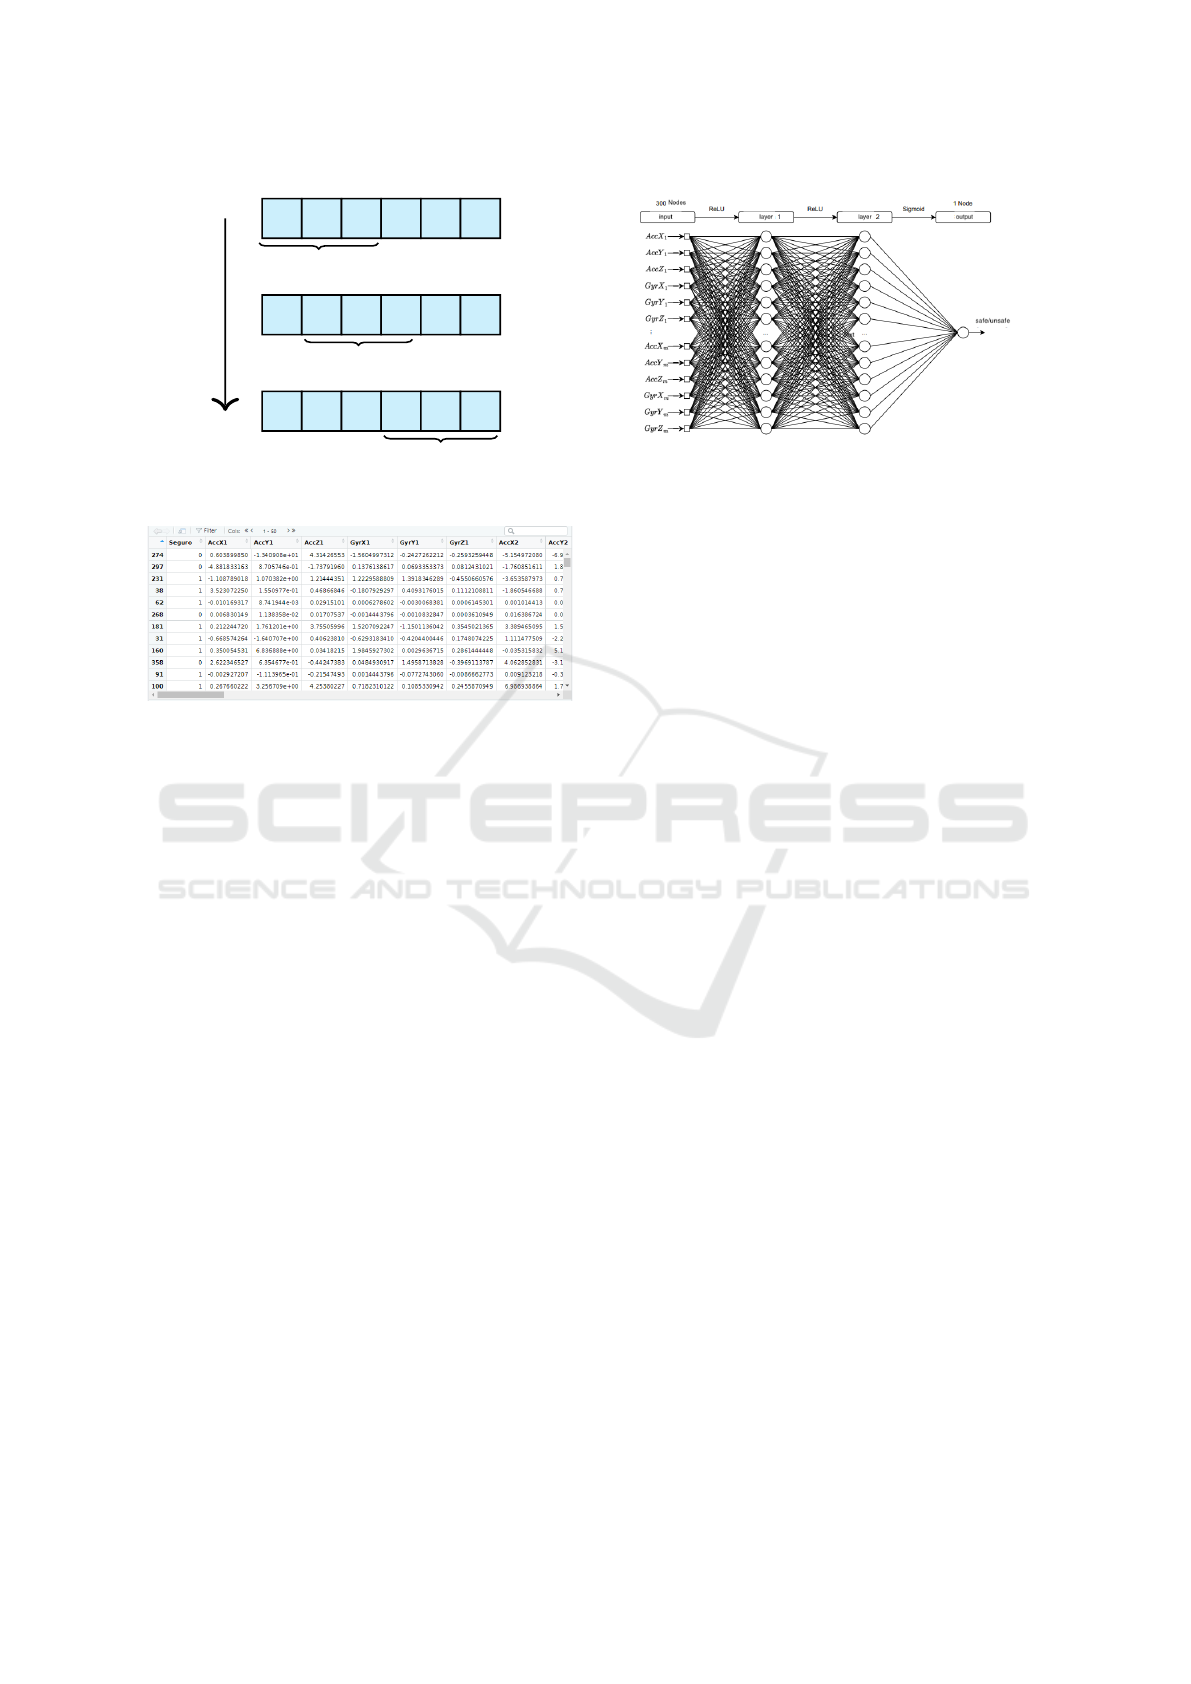
Finally, each 5s stretch within the dataset will be-
come an observation labeled as safe or dangerous. To
extend our dataset, the concept of sliding window was
applied: between 0-5s will be considered a stretch,
between 1-6s also and so on, as depicted in Fig. 8. A
sample of the final dataset is depicted in Fig. 9.
3.4 Dataset Calibration
For experimental evaluation, a total of 374 cases were
collected, of which 268 were safe and 106 (size) were
Machine Learning Support for Time-Efficient Processing Dangerous Driving Detection Using Vehicle Inertial Data
1001
t
0
t
1
t
2
t
3
...
t
n
t
0
t
1
t
2
t
3
...
t
n
t
0
t
1
t
2
t
3
...
t
n
sliding window
sliding window
sliding window
Figure 8: Sliding window approach.
Figure 9: Sample of the final dataset.
dangerous. Since, each data in our dataset contains
6 kbytes, the total dataset size is 2244 kbytes or ≈ 2
Mbytes. The imbalance in the dataset occurred due
to the speed at which the dangerous laps were per-
formed, which ended up generating shorter videos.
The treatment of datasets with unbalanced data is
a recent problem. Algorithms used to training neural
networks have difficulty to learn in the presence of
unbalanced data, i.e. when there is a large difference
in the number of samples in each class (safe/unsafe).
This difference can lead the classifier to have a biased
output, favoring the outstanding class.
Because of this and to prevent the data from being
trained in an unbalanced way in the neural network,
162 safe cases were removed from the dataset. The
remaining 212 cases were divided between a training
dataset containing 180 data and a testing dataset con-
taining 32 cases.
3.5 Neural Network Model
Our classifier, which the code is depicted in Fig. 11,
follows a neural network schematic model used in this
work consists of three layers, as depicted in Fig. 10.
In each network layer, with a set of artificial neurons,
the network can learn about the data, by extracting its
characteristics.
The input layer has 300 nodes (ACC and GYRO
data for 5 seconds of the section at a frequency of
10 Hz). The two dense intermediate layers with the
Figure 10: Neural network schematic model.
ReLU activation function, have 256 nodes and with
128 nodes, respectively. The output layer with the
sigmoid activation function, the values close to 1.0
indicate a safe trip and values close to 0.0 indicate a
dangerous trip.
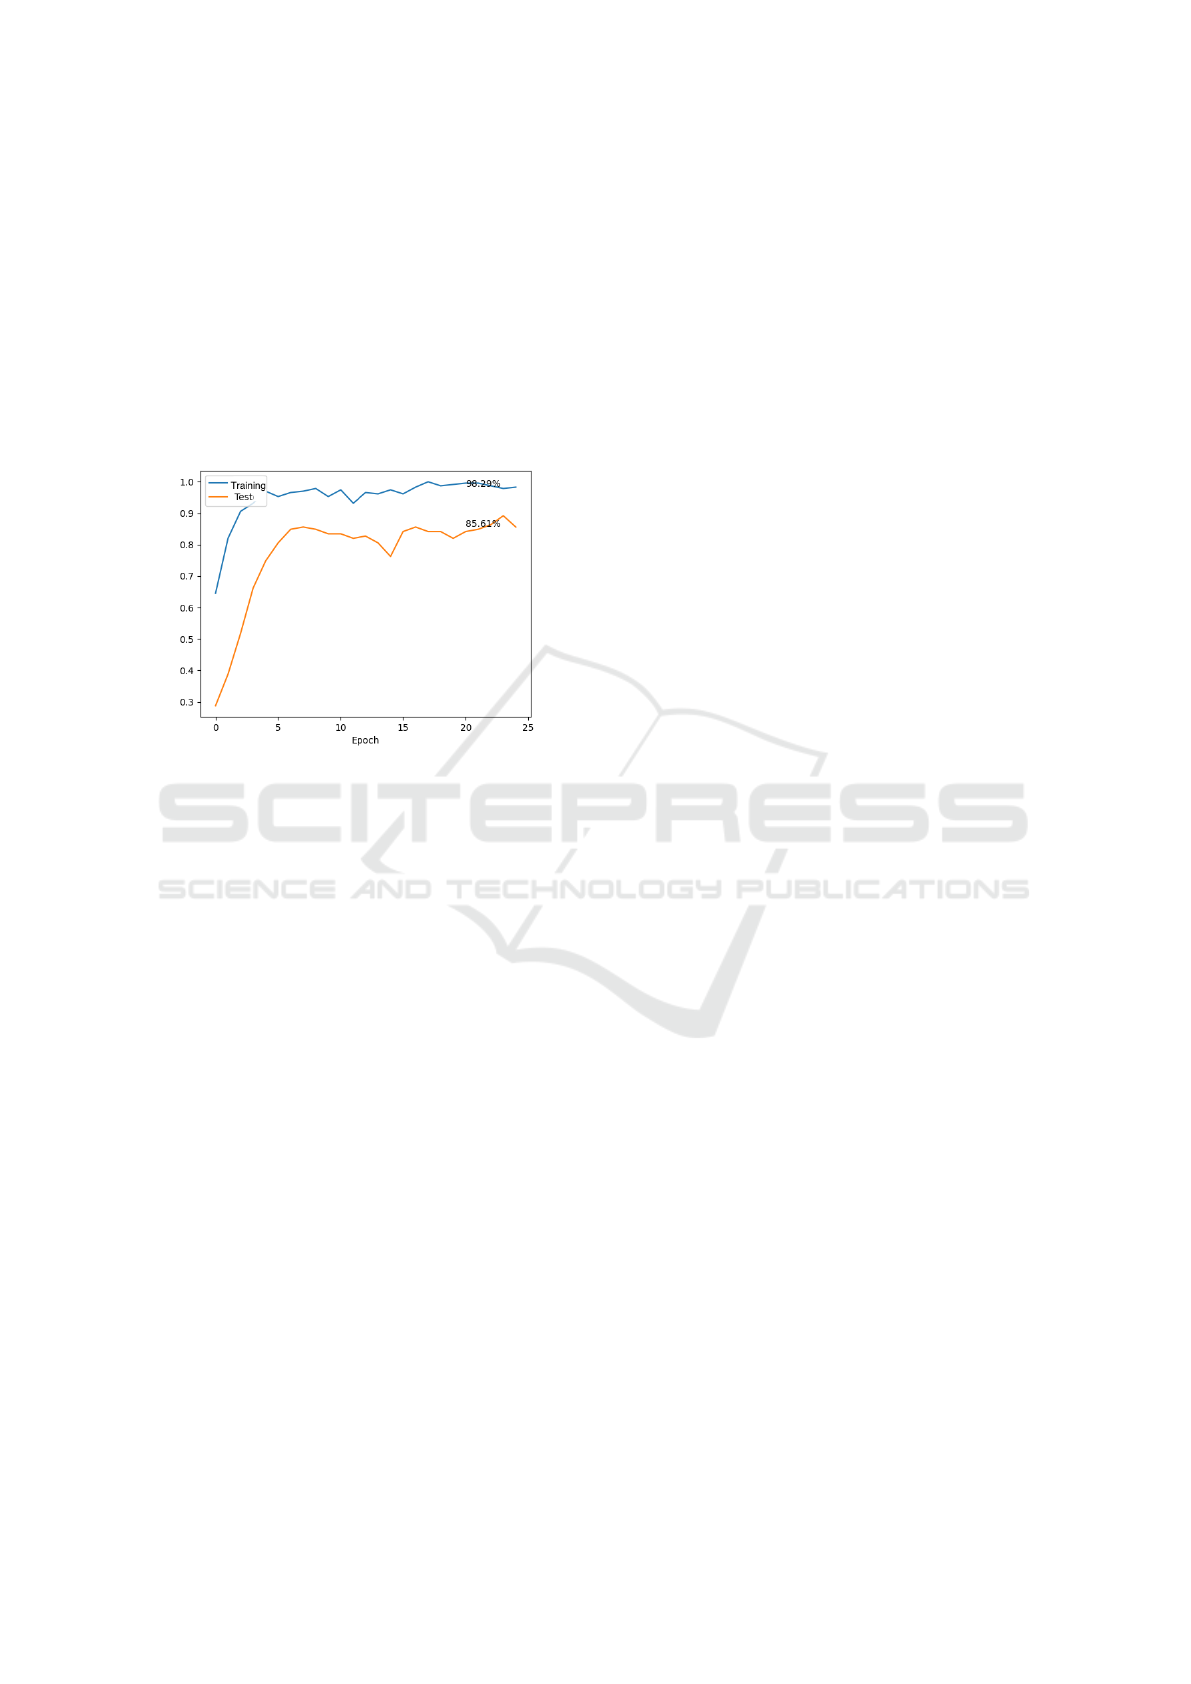
3.6 Training
The training process of the neural network occurs ev-
ery round or every epoch. During each epoch, the
process of updating the weights takes place in order
to improve the results obtained. The weights are ad-
justed in the neural network during the learning pro-
cess.
After running all epochs, the trained model is ob-
tained, which has learned features about the dataset
used as input. Therefore, when displaying new infor-
mation to this network, which is within the class in
which the model was trained, in this case the detec-
tion of dangerous driving behavior, it is expected that
the model will have the ability to correctly classify the
information presented (in safe/unsafe).
All our experiments were conducted with a con-
ventional entry-level laptop from 2016: Intel(R)
Core(TM) i7-5500U CPU @ 2.40GHz, 8GB DDR3
RAM and a Nvidia GeForce 940M 2GB DDR3 GPU
running Linux Mint 21.1. We divided our training
dataset with 180 examples into batches of 16 exam-
ples. Training was carried out using 25 epochs (as
depicts Fig. 12).
4 RESULTS
The proposed model achieved an accuracy rate of
85.61% for test cases that were not seen by the neu-
ral network during training (again see Fig. 12). The
achieved accuracy rate indicates that there is a pat-
tern to be found in the trips, however, it is not a high
enough rate for the purpose of classifying and report-
ing dangerous driving, since it presents many false
ICEIS 2024 - 26th International Conference on Enterprise Information Systems
1002
model = tf.keras.Sequential([
preprocessing_layer,
tf.keras.layers.Dense(256, activation = ’relu’),
tf.keras.layers.BatchNormalization(),
tf.keras.layers.Dropout(0.1),
tf.keras.layers.Dense(128, activation = ’relu’),
tf.keras.layers.BatchNormalization(),
tf.keras.layers.Dropout(0.1),
tf.keras.layers.Dense(1, activation=’sigmoid’),
])
model.compile(
loss=’binary_crossentropy’
optimizer = tf.keras.optimizers.Adam(learning_rate=0.01),
metrics =[’binary_accuracy’]
)
Figure 11: Classifier implementation.
Figure 12: Neural Network Learning Curve with regard to
the accuracy.
negatives. This happens because the dataset needs to
be better calibrated. However, we want to keep the
amount of data small, so that the neural network can
readily process it. To achieve better accuracy results,
possible solutions are (i) expanding the database, (ii)
improving pre-processing phase and (iii) testing dif-
ferent hyper-parameters.
5 CONCLUSION
Data quality is one of the main concerns for ML al-
gorithm’s output. Most of the available methods in-
duces knowledge strictly from the data, without using
any external information. Thus, the quality of the al-
gorithm’s output largely determined by the quality of
the input data.
In this way, future work includes to augment the
database data and to improve data pre-processing
phase, seeking precisely to improve the accuracy of
the algorithm here applied. Furthermore, we aim
to improve the neural network accuracy, using other
techniques such as recurrent neural networks, in addi-
tion to evaluating the use of different neural network
models to solve the given problem, such as multi-
class classifiers for identifying maneuvers performed
by the vehicle or for recognizing drivers. Finally, we
aim to apply the classification of dangerous detection
behavior in a real time environment to evaluate the
performance of the solution given the computational
power and resources available in the vehicle.
ACKNOWLEDGEMENTS
We would like to thank the Brazilian Government and
the FUNDEP Foundation for supporting this project
under the Rota 2030 program, and we appreciate the
support provided by the following people at the Poly-
technic College at the University of S
˜
ao Paulo work-
ing with us in the project: Prof. Marcelo K. Zuffo,
Prof. Agenor T. Fleury, Prof. Fl
´
avio Trigo.
REFERENCES
Abu Al-Haija, Q. and Krichen, M. (2022). A lightweight
in-vehicle alcohol detection using smart sensing and
supervised learning. Computers, 11(8).
Baheti, B., Gajre, S., and Talbar, S. (2018). Detection of dis-
tracted driver using convolutional neural network. In
Proceedings of the IEEE conference on computer vi-
sion and pattern recognition workshops, pages 1032–
1038.
Chen, Z., Yu, J., Zhu, Y., Cheny, Y., and Li, M. (2015).
D3: Abnormal driving behaviors detection and identi-
fication using smartphone sensors. 2015 12th Annual
IEEE International Conference on Sensing, Commu-
nication, and Networking (SECON), pages 524–532.
Constantinescu, Z., Marinoiu, C., and Vladoiu, M. (2010).
Driving style analysis using data mining techniques.
International Journal of Computers, Communications
& Control (IJCCC), V:654–663.
Eboli, L., Guido, G., Mazzulla, G., Pungillo, G., and
Pungillo, R. (2017). Investigating car users’ driv-
ing behaviour through speed analysis. Promet - Traf-
fic&Transportation, 29(2):193–202.
Evans, L. and Wasielewski, P. (1983). Risky driving related
to driver and vehicle characteristics. Accident Analysis
& Prevention, 15(2):121–136.
Irache, J. (2020). Gopro metadata format parser. Technical
report, GoPro.
Jeong, E., Oh, C., and Kim, I. (2013). Detection of lat-
eral hazardous driving events using in-vehicle gyro
sensor data. KSCE Journal of Civil Engineering,
17(6):1471–1479.
Johnson, D. A. and Trivedi, M. M. (2011). Driving style
recognition using a smartphone as a sensor platform.
In 14th International IEEE Conference on Intelligent
Transportation Systems (ITSC), pages 1609–1615.
Khodairy, M. A. and Abosamra, G. (2021). Driving
behavior classification based on oversampled sig-
nals of smartphone embedded sensors using an opti-
mized stacked-LSTM neural networks. IEEE Access,
9:4957–4972.
Machine Learning Support for Time-Efficient Processing Dangerous Driving Detection Using Vehicle Inertial Data
1003

Kirschenbaum, M. (2021). Gopro hero 10 teardown. Tech-
nical report, GoPro.
Lattanzi, E. and Freschi, V. (2021). Machine learning tech-
niques to identify unsafe driving behavior by means
of in-vehicle sensor data. Expert Systems with Appli-
cations, 176:114818.
Masood, S., Rai, A., Aggarwal, A., Doja, M. N., and Ah-
mad, M. (2020). Detecting distraction of drivers us-
ing convolutional neural network. Pattern Recognition
Letters, 139:79–85.
Nuswantoro, F. M., Sudarsono, A., and Santoso, T. B.
(2020). Abnormal driving detection based on ac-
celerometer and gyroscope sensor on smartphone us-
ing artificial neural network (ann) algorithm. In 2020
International Electronics Symposium (IES), pages
356–363.
Sensortec, B. (2019). BMI260 : Accurate, low-power In-
ertial Measurement Unit (IMU). Bosch Sensortec
GmbH.
Shahverdy, M., Fathy, M., Berangi, R., and Sabokrou, M.
(2020). Driver behavior detection and classification
using deep convolutional neural networks. Expert Sys-
tems with Applications, 149:113240.
Shreshtha, S., Singh, P., Singh, R., Arif, S., and Sinha, D.
(2020). Non-invasive alcohol detection for drunk driv-
ing prevention. In 2020 2nd International Conference
on Advances in Computing, Communication Control
and Networking (ICACCCN), pages 332–337.
Van Ly, M., Martin, S., and Trivedi, M. M. (2013). Driver
classification and driving style recognition using iner-
tial sensors. In 2013 IEEE Intelligent Vehicles Sympo-
sium (IV), pages 1040–1045. IEEE.
Wang, D., Pei, M., and Zhu, L. (2014). Detecting driver
use of mobile phone based on in-car camera. In 2014
Tenth International Conference on Computational In-
telligence and Security, pages 148–151.
Willis, M., Zaouk, A., Bowers, K., Chaggaris, C., Shannon-
Spicer, R., Bahouth, G., and Strassburger, R. (2019).
Driver alcohol detection system for safety (DADSS)
- pilot field operational tests (PFOT) vehicle instru-
mentation and integration of DADSS technology. In
NHTSA – 26th International Technical Conference on
The Enhanced Safety of Vehicles (ESV).
Xiang, H., Zhu, J., Liang, G., and Shen, Y. (2021). Predic-
tion of dangerous driving behavior based on vehicle
motion state and passenger feeling using cloud model
and elman neural network. Frontiers in Neurorobotics,
15.
Yasar, H. (2017). Detection of driver’s mobile phone us-
age. In 2017 IEEE 9th International Conference on
Humanoid, Nanotechnology, Information Technology,
Communication and Control, Environment and Man-
agement (HNICEM), pages 1–4.
Zhang, C., Li, R., Kim, W., Yoon, D., and Patras, P. (2020).
Driver behavior recognition via interwoven deep con-
volutional neural nets with multi-stream inputs. IEEE
Access, 8:191138–191151.
ICEIS 2024 - 26th International Conference on Enterprise Information Systems
1004
