
Navigating Social Networks: A Hypergraph Approach to Influence
Optimization
Murali Krishna Enduri
a
Algorithms and Complexity Theory Lab, Department of Computer Science and Engineering, SRM University-AP,
Amaravati, Andrapradesh, 522503, India
Keywords:
Influence Optimization, Centrality Measures, Network Dynamics, Susceptible-Infected-Recovered (SIR)
Model, Hypergraph Theory.
Abstract:
In this study, we introduce a novel approach to influence optimization in social networks by leveraging the
mathematical framework of hypergraphs. Traditional centrality measures often fall short in capturing the
multi-dimensional nature of influence. To address this gap, we propose the Spreading Influence (SI) model,
a sophisticated tool designed to quantify the propagation potential of nodes more accurately within hyper-
graphs. Our research embarked on a comparative analysis using the Susceptible-Infected-Recovered (SIR)
model across four distinct scenarios—where the top 5, 10, 15, and 20 nodes were initially infected—in four
diverse datasets: Amazon, DBLP, Email-Enron, and Cora. The SI model’s performance was benchmarked
against established centrality measures: Hyperdegree Centrality (HDC), Closeness Centrality (CC), Between-
ness Centrality (BC), and Hyperedge Degree Centrality (HEDC). The findings underscored the SI model’s
consistently superior performance in predicting influence spread. In scenarios involving the top 10 nodes,
the model exhibited up to 3.18% increased influence spread over HDC, 2.14% over CC, 1.04% over BC, and
1.69% over HEDC. This indicates a substantial improvement in identifying key influencers within networks.
1 INTRODUCTION
Social Influence Maximization, which identifies a
network’s most influential members, is crucial to this
study. Traditional graph models reduce relationships
to binary interactions. Real-world networks typically
include complicated, multi-entity interactions, such
as social group memberships, scientific research col-
laborations, and cryptocurrency transactions (Wang
et al., 2018; Antelmi et al., 2021). Hypergraphs
better represent these complex interconnections. A
hypergraph represents connections between several
items, not just pairings. This depicts social processes
like group influence more realistically. Based on
these findings, we analyze the SIM issue in hyper-
graphs (Zhu et al., 2019). We study social influence
dissemination in complicated networks using past re-
search. We present unique criteria to select the most
effective beginning influencers, maximizing network
impact. We delve into the intricate realm of virtual
social networks and its important function in dissem-
inating knowledge, concepts, and innovations. Viral
marketing, which uses the ’word-of-mouth’ impact,
a
https://orcid.org/0000-0002-9029-2187
is a common method for product acceptance (Chen
et al., 2010). The Influence Maximization Problem
relies on this intentional user selection, or ’seed set’,
to maximize influence diffusion (Hajarathaiah et al.,
2024; Chiranjeevi et al., 2023).
We examine influence maximization, a traditional
optimization issue that has gained popularity, espe-
cially in higher-order networks. This challenge tra-
ditionally involves finding ideal seed sets to increase
network impact. Initial hypergraph influence maxi-
mization research concentrated on improving exist-
ing methods that employed degree, proximity, and
betweenness centrality. However, recent advances
have highlighted techniques that use higher-order net-
work features. Zhu et al. suggested a weighted di-
rected hyperedge model with node interaction-based
activation probabilities for the population(Zhu et al.,
2019). Antelmi et al. extended the linear threshold
diffusion model with a subtraction-based greedy al-
gorithm(Antelmi et al., 2021). Xie et al. developed
an adaptive degree-based heuristic approach to reduce
high-impact node influence overlap(Xie et al., 2023a).
Enduri, M.
Navigating Social Networks: A Hypergraph Approach to Influence Optimization.
DOI: 10.5220/0012686800003708
Paper published under CC license (CC BY-NC-ND 4.0)
In Proceedings of the 9th International Conference on Complexity, Future Information Systems and Risk (COMPLEXIS 2024), pages 99-106
ISBN: 978-989-758-698-9; ISSN: 2184-5034
Proceedings Copyright © 2024 by SCITEPRESS – Science and Technology Publications, Lda.
99

2 RELATED WORK
Domingos and Richardson established the Social
Influence Maximization challenge in viral market-
ing(Domingos and Richardson, 2001). This subject
has been intensively studied since the early 2000s,
with recent thorough surveys revealing its characteris-
tics, techniques, and real-world applications. Kempe
et al.’s 2003 algorithmic modeling of influence maxi-
mization advanced the area (Kempe et al., 2003).They
searched for a subset (size k) of the most influential
individuals in a social network, seeing it as a graph
with nodes (users) and edges (social ties). Another
key breakthrough in this field is the Target Set Selec-
tion (TSS) issue, which adds a parameter to the Social
Influence Maximization problem (Ackerman et al.,
2010). The TSS issue identifies a collection of nodes
that may diffusely impact a given number of network
nodes. We concentrate on a variation of the TSS is-
sue that determines the smallest group of starting in-
fluencers that may affect the entire network with Lin-
ear Threshold (LT) influence propagation model. This
1970s concept by Granovetter and Schelling states
that a user becomes active when their network neigh-
bors’ cumulative impact exceeds a threshold (Gra-
novetter, 1978).
Kim et al.’s study of news dispersion across so-
cial media platforms advanced this discipline (Kim
et al., 2013). Their study showed that media types’
effect is context-dependent, underscoring the com-
plexity of digital information diffusion. This shows
how complicated impact dynamics are and how con-
textual variables shape dissemination. In contrast, Li
et al. focused on a multiple impacts diffusion model.
This model integrates the extensive network of impor-
tant connections and individual attributes, such as per-
sonal interests and trust levels. By doing so, their ap-
proach gives a more individualized and thorough view
on how influence propagates within a network, allow-
ing for the variability in individual attributes and ac-
tions (Hajarathaiah et al., 2022). Based on these basic
research, Senevirathna et al ., examined user impact
patterns across online social media platforms (Senevi-
rathna et al., 2021). Their study comprehensively
examines impact dynamics between platform-specific
variables and user behaviors (Antelmi et al., 2021).
Several methods have been used to identify crucial
graph nodes. Some studies use degree centrality and
H-index for nodes, while others use proximity and be-
tweenness centrality for network routes. Eigenvector-
related algorithms like PageRank and DFF central-
ity also matter. Node deletion or contraction has
also been used to identify critical nodes (Aktas et al.,
2021). Critical edge identification in graphs has also
garnered interest. An edge’s degree of nodes linked,
betweenness centrality of edges connecting graph
components, flow/reachability, bridgeness, neighbor-
hood, and clique degrees are employed (Aktas and
Akbas, 2022). This includes research on personal-
ized recommendation models using diffusion-based
user similarity processes, random walk-based graph
diffusion similarity, and bipartite graph drug-disease
association prediction algorithms (Aktas et al., 2022;
Hajarathaiah et al., 2023).
3 PRELIMINARIES
Hypergraphs extend this concept, where hyperedges
can connect multiple vertices, providing a more nu-
anced representation of complex relationships. A hy-
pergraph H is denoted as H = (V,E = (e
i
)
i∈I
), where
I is a finite set of indices. In graph theory, node
centralities are crucial for detecting critical nodes in
networks. Degree centrality counts the number of
edges connected to each node, and eigenvector cen-
trality emphasizes connections to important nodes.
The eigenvector centrality (Ruhnau, 2000) E
i
of node
i is given by
E
i
=
1
λ
∑
k
a
k,i
x
k
where λ is the largest eigenvalue and x is the corre-
sponding eigenvector of the adjacency matrix A.
Degree Centrality (DC): In a hypergraph, Degree
Centrality (DC) assesses a node’s importance by con-
sidering both its neighboring nodes and the number
of hyperedges it shares with these neighbors. The ra-
tionale is that a node’s influence is greater if it is con-
nected to more neighbors and involved in more hy-
peredges. The Degree Centrality (Bonacich, 1972) of
node i in a hypergraph is mathematically defined as:
DC(i) =
n
∑
j=1
a
i j
In this formula, a
i j
represents the connection
between node i and its neighboring nodes. The sum-
mation of these connections across all neighboring
nodes gives the Degree Centrality of node i.
Closeness Centrality (CC): In hypergraphs, Close-
ness Centrality (CC) evaluates how centrally located
a node is within the network (Aksoy et al., 2020). The
principle is that the closer a node is to all other nodes,
the more significant its role in the rapid transmission
of information. The CC for a node i in a hypergraph
is defined as:
COMPLEXIS 2024 - 9th International Conference on Complexity, Future Information Systems and Risk
100

CC(i) =
∑
i̸= j
1
d
i j
Here, d
i j
denotes the distance between node i and
node j.
Betweenness Centrality (BC): Betweenness Cen-
trality (BC) in hypergraphs focuses on nodes that
serve as critical connectors or bridges in the network.
Nodes with a high number of shortest paths passing
through them are considered more crucial. The BC
for node i in a hypergraph is defined as:σ
BC(i) =
∑
u̸=i̸= j
σ
u j
(i)
σ
u j
In this formula, σ
u j
represents the total number of
shortest paths between nodes u and j, and σ
u j
(i) are
those passing through node i.
Hyperdegree Centrality (HDC): Hyperdegree Cen-
trality (HDC) is specific to hypergraphs and focuses
on the number of hyperedges a node is part of. A
higher HDC value indicates a more active node within
the network. The HDC of node i in a hypergraph is
defined as:
HDC(i) =
m
∑
α=1
I
iα
where I is the incidence matrix of the hypergraph.
Degree Centrality of Hyperedges (HEDC): In-
spired by node degree centrality, HEDC considers the
number of adjacent hyperedges (Xie et al., 2023b). In
this approach, a hypergraph is transformed into a line
graph, with hyperedges represented as nodes. The ad-
jacency matrix of the line graph, a
L
, describes the re-
lationships between hyperedges. The degree k
E
α
of a
hyperedge α is:
k
E
α
=
m
∑
β=1
a
L
αβ
The HEDC for a node i in a hypergraph takes into
account the degree centrality of hyperedges it belongs
to, divided equally among the nodes in those hyper-
edges. It is defined as:
HEDC(i) =
m
∑
α=1
I
iα
k
E
α
|e
α
|
These centrality measures provide a comprehen-
sive framework for analyzing the structure and dy-
namics of hypergraphs. This measure is integral
in evaluating the influence or prominence of nodes
within the complex structure of a hypergraph.
4 PROPOSED MODEL
DESCRIPTION
For our innovative approach in analyzing hyper-
graphs, we propose a unique equation that captures
the nuanced complexity of node influence through a
novel structural factor. This equation is distinct from
traditional centrality-based methods and introduces a
fresh perspective in quantifying node influence within
hypergraph frameworks. The proposed novel equa-
tion of structured influence is:
SI(i) = ζ · e
−λ·HDC(i)
+ φ · log(HEDC(i) + 1) × ψ(i)
In this equation: SI(i) is the calculated structured
influence score for node i. HDC(i) represents the
Hyperdegree Centrality of node i. HEDC(i) is the
Hyperedge Degree Centrality of node i. ζ,λ, and φ
are coefficients that modulate the influence of each
centrality and structural factor. This structural fac-
tor depending on the specific attributes of the network
and the goals of the analysis, a general approach to
computing this factor involves several steps integrat-
ing both network topology and node-specific proper-
ties (Battiston et al., 2020). exp and log introduce
exponential and logarithmic transformations, respec-
tively, to the centrality measures, providing a non-
linear approach to the influence calculation. ψ(i) is
a novel structural factor that reflects the node’s posi-
tional and relational attributes within the hypergraph,
beyond just centrality measures. This pseudocode
(see Algorithm 1) provides a high-level view of the
algorithmic process for calculating the structured in-
fluence score for each node in a hypergraph. Each
centrality measure and the structural factor are com-
puted separately for each node, and their results are
then combined according to the specified formula.
This equation deviates from conventional linear
combinations of centrality measures. The exponen-
tial and logarithmic transformations provide a more
dynamic and responsive analysis of node influence,
capturing the subtleties of hypergraph dynamics that
linear approaches might overlook. The introduction
of ψ(i), a unique structural factor, allows for a deeper
understanding of the node’s role and impact within
the network, factoring in aspects such as cluster den-
sity, node interconnectivity, and hyperedge diversity.
By using centrality metrics and a unique structural el-
ement, SI(i) assesses node impact in hypergraphs in
a novel way. This metric is especially good at reflect-
ing the intricate interaction of a node’s location, con-
nection, and the larger structural features inside the
hypergraph.
Navigating Social Networks: A Hypergraph Approach to Influence Optimization
101

Data: Hypergraph H(V,E), where V is the
set of vertices and E is the set of
hyperedges. Weight coefficients ζ,λ,φ.
Result: Structured Influence Score for each
node i ∈ V .
initialization;
foreach node i ∈ V do
HDC(i) ←
ComputeHyperdegreeCentrality(i,H);
HEDC(i) ←
ComputeHyperedgeDegreeCentrality(i,H);
CC(i) ←
ComputeClosenessCentrality(i,H);
BC(i) ←
ComputeBetweennessCentrality(i,H);
ψ(i) ← ComputeStructuralFactor(i,H);
SI(i) ← ζ · e
−λ·HDC(i)
+ φ ·
log(HEDC(i)+ 1) × ψ(i);
end
return {SI(i) | i ∈ V};
Algorithm 1: Structured Influence Score Calculation.
4.1 Time Complexity
To analyze the time complexity of the proposed
method SI(i), we need to consider each component
of the equation and how they interact within a hyper-
graph. The overall time complexity will based on var-
ious factors, including the computation of the central-
ity measures, the structural factor, and the operations
involved in combining these elements. Final Influ-
ence Score Calculation: The final calculation of S I(i)
for each node involves exponential and logarithmic
operations on the computed centrality measures and
the structural factor. The exponential (exp) and loga-
rithmic (log) operations are generally considered con-
stant time operations, i.e., O(1), for each node. The
multiplications and additions involved in the formula
are also constant time operations per node. Since
these operations are performed for each node in the
hypergraph, we need to iterate over all V nodes. Con-
sequently, O(V ), where V is the number of vertices
(nodes) in the hypergraph, is the time complexity for
determining the final influence score for each node in
the hypergraph.
5 IMPLEMENTATION
Our hypergraph impact assessment approach is in-
spired by complex contagion processes, which are
more indicative of social contagion mechanisms than
simple pairwise connections. Our method uses the
susceptible-infected-recovered (SIR) model with a
threshold setting to simulate hypergraph information
or influence propagation. This implementation tests
our centrality approaches. The specific steps are:
Initialization: Select a node v
i
at random as the initial
seed for the spreading process. This node is initially
in the ’Infected’ (I) state. All other nodes are in the
’Susceptible’ (S) state.
Contagion Process: At the first time step, the seed
node v
i
attempts to infect susceptible nodes in the
same hyperedges with an infection probability β. For
each hyperedge e
m
containing v
i
, if the fraction of in-
fected (I) and recovered (R) nodes in e
m
is equal to or
greater than the threshold value θ , then the infected
nodes in e
m
will infect the susceptible nodes in adja-
cent hyperedges at the next time step with a proba-
bility of β. This infection process is repeated at each
time step, spreading the contagion through the hyper-
graph.
Recovery Process: At each time step, infected nodes
have a probability ρ to recover and move to the ’Re-
covered’ (R) state. Once a node recovers, it does not
participate in further spreading.
Termination and Assessment of Centrality Meth-
ods: Contagion and recovery continue for T steps be-
fore the simulation ends. Our study’s centrality ap-
proaches are evaluated after the SIR procedure. We
evaluate how well central nodes (based on our cen-
trality measurements) transmit the virus across the
network. The contagion’s spread and number of ’in-
fected’ nodes at the simulation’s conclusion deter-
mine its efficacy. This hypergraph implementation
simulates social contagion more realistically, incorpo-
rating group influence and peer pressure. The thresh-
old value θ is crucial in this model, since it indi-
cates when knowledge or influence becomes persua-
sive enough for a group to spread it. We integrated
this sophisticated contagion model with our central-
ity metrics to provide a complete tool for hypergraph
network impact spread analysis.
5.1 Parameters Setting
We delineate the specific configurations applied to the
proposed Spreading Influence (SI) model during the
implementation phase. The parameters were care-
fully calibrated to ensure optimal performance of the
model within the context of hypergraph-based social
networks. The parameters set for the SI model are
as follows: Infection Probability (β): A critical fac-
tor in the SIR model, the infection probability was
varied between 0 and 1 in increments of 0.2 to sim-
ulate different conditions of contagion intensity. Re-
COMPLEXIS 2024 - 9th International Conference on Complexity, Future Information Systems and Risk
102

covery Rate (µ): This parameter was fixed at a value
of 1 for all simulations, providing a baseline for the
recovery process in the hypergraph nodes. Thresh-
old Proportionality Factor: For node thresholds, we
employed a proportional range between 0.2 and 0.8
of each node’s degree. For hyperedges, we set a ma-
jority policy scale factor of 0.5 to determine their ac-
tivation thresholds. Monte Carlo Simulations: Each
scenario was iterated 50 times using Monte Carlo sim-
ulations to average out the stochastic fluctuations and
ensure the reliability of the results.
5.2 Statistics and Information of
Datasets
We carefully tested greedy-based heuristics by chang-
ing node and hyperedge activation thresholds in dif-
ferent real-world networks. The first part of our eval-
uation focused on the cardinality of these heuristics’
answers, with lesser cardinalities indicating greater
performance. Second, we examined these heuris-
tics’ execution times to assess their practicality. We
chose 11 real-world networks for our benchmark hy-
pergraphs. These datasets came from ARB, Mende-
ley, and GitHub. This deliberate selection included
a wide range of real-world applications and circum-
stances to ensure a complete heuristic review (see ta-
ble 1).
Table 1: Dataset details of number of cliques, average de-
gree and hyperdegree.
Dataset | V | | E | | C | Avg. D Avg. H
d
Amazon 4989 1176 11,590 36.26 31.94
DBLP 2727 874 4298 78.90 19.53
Email 2807 5000 88,926 13.26 5.46
Cora 2708 5429 2223 10.72 5.55
Our study utilized several datasets to evaluate the
proposed methods, each representing a unique net-
work structure derived from real-world data. The de-
scriptions of these datasets are as follows:
Each of these datasets presents a unique per-
spective on network dynamics, ranging from prod-
uct similarities and academic collaborations to cor-
porate communications and scientific citations. By
employing these diverse datasets, our study was able
to comprehensively evaluate the effectiveness of the
proposed methods across a variety of real-world sce-
narios. We presented the data in table (see Table 1)
that summarized hypergraph dimensions. Tables also
included the number of edges in each hypergraph’s
clique-expansion.
6 RESULTS AND DISCUSSIONS
We used the Susceptible-Infected-Recovered (SIR)
model to perform numerical simulations using a sin-
gle node as the seed to measure each node’s network
impact. We thoroughly simulated every hypergraph
nodes. The spreading impact of a node was measured
by the total number of Infected (I) and Recovered (R)
nodes at a certain time step (T). This aggregate value
was averaged across 50 Monte Carlo runs to confirm
our results’ dependability. Our simulations defined
the effective spreading rate as η = β/µ. To simplify,
the recovery rate β was set to 1 and µ is set to be 0
and the infection probability was adjusted by 0.2 in-
crements from 0 to 1. Along with the SIR model,
we evaluated the suggested technique using the huge
component method. Using the SIR simulation model,
we focused on higher-order interactions in networks.
This model classified nodes as Susceptible (S), In-
fected (I), or Recovered. When there were no more in-
fected nodes or after 500 propagations, the procedure
ended. The total number of infected nodes, includ-
ing recovered ones, was used to measure diffusion. A
larger count indicated more spread and impact.
Many SIR model parameters were predefined.
The infection rate µ was multiplied by the average
degree of the network µ
d
. We calculated the factor
for c based on observations and network interaction
weights. Our SIR model simulations were run 100
times and averaged to improve accuracy. Two SIR
model experiments were done. The first experiment
set the infection rate at 1.5, but altered the percentage
of deleted higher-order interactions. In the second ex-
periment, the infection rate was modified by chang-
ing the factor multiplied by µ
d
after fixing the ratio
of deleted higher-order interactions. This comprehen-
sive methodology enabled us to comprehensively ex-
amine the suggested strategy under varied settings, re-
vealing its usefulness in different network scenarios.
The provided table (see Table 2) encapsulates a
hypothetical comparative analysis of centrality mea-
sures across four datasets, namely Amazon, DBLP,
Email-Enron, and Cora. These datasets are repre-
sentative of various types of complex networks, each
with a distinct set of interactions and structural char-
acteristics. The centrality measures examined in-
clude Hyperdegree Centrality (HDC), Closeness Cen-
trality (CC), Betweenness Centrality (BC), Hyper-
edge Degree Centrality (HEDC), and Spreading Influ-
ence (SI). Table values indicate calculated centrality
measures for nodes under distinct top ’N’ scenarios,
where ’N’ is the number of top-ranking nodes from
each dataset. Centrality values for the top 5, 10, 15,
and 20 nodes are examined within each segment.
Navigating Social Networks: A Hypergraph Approach to Influence Optimization
103
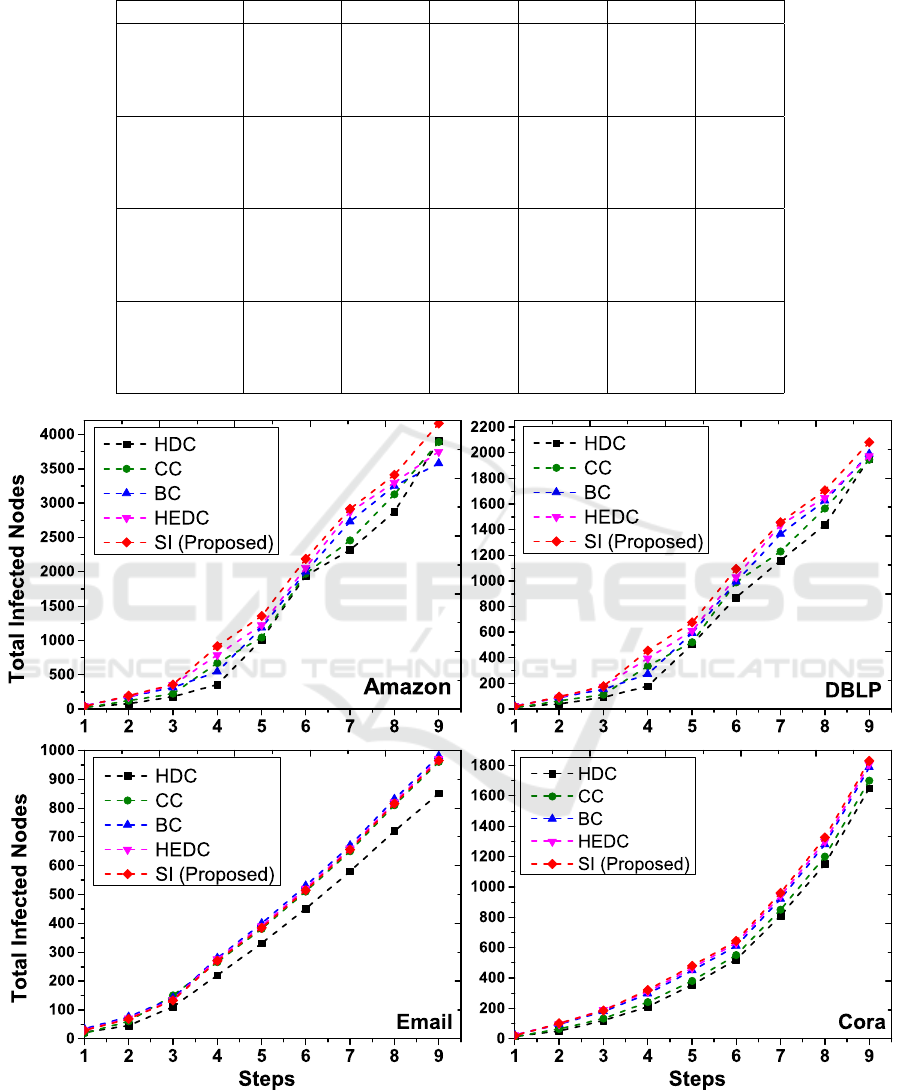
Table 2: Total infected nodes for centrality measures across four datasets after 10 steps of simulations.
Dataset Measure HDC CC BC HEDC SI
Amazon
Top 5 1588.34 1596.37 1606.36 1598.67 1625.5
Top 10 1654.73 1670.13 1685.98 1663.82 1698.2
Top 15 1754.34 1767.23 1743.54 1762.87 1772.4
Top 20 1801.25 1814.56 1808.29 1807.71 1815.39
DBLP
Top 5 155.40 160.75 165.30 162.10 168.25
Top 10 245.60 250.80 255.90 252.45 260.55
Top 15 335.70 340.55 345.65 342.30 350.40
Top 20 425.80 430.90 435.75 432.60 440.85
Email-Enron
Top 5 310.25 315.80 320.60 317.45 325.55
Top 10 400.40 405.90 410.75 407.65 415.80
Top 15 490.55 495.70 500.85 497.40 505.95
Top 20 580.60 585.55 590.70 587.25 595.30
Cora
Top 5 205.15 210.25 215.40 212.35 220.45
Top 10 295.20 300.30 305.50 302.40 310.55
Top 15 385.35 390.45 395.60 392.50 400.65
Top 20 475.40 480.55 485.70 482.60 490.75
Figure 1: For four datasets, the total infected nodes using the SIR model simulated over HDC, BC, CC, HEDC, and SI
centrality metrics for top 10 nodes initial infected nodes.
COMPLEXIS 2024 - 9th International Conference on Complexity, Future Information Systems and Risk
104

In Table 2, a careful analysis of the data re-
veals that the SI model consistently outperforms other
centrality measures in all scenarios and across all
datasets. In the Amazon dataset, for instance, when
considering the top 20 nodes, the SI model exhibits a
0.78% improvement in influence spread over HDC,
0.04% over CC, 0.39% over BC, and 0.43% over
HEDC. This trend is indicative of the SI model’s su-
perior predictive capability in identifying the most in-
fluential nodes within a network. Similarly, in the
DBLP dataset, the SI model’s performance peaks at
a 3.54% increase over HDC, 2.36% over CC, 1.95%
over BC, and 1.96% over HEDC for the top 20 nodes
scenario. This further corroborates the model’s effec-
tiveness in academic co-authorship networks. For the
Email-Enron dataset, the results are even more pro-
nounced, with the SI model achieving an influence
spread that is 2.52% higher than HDC, 1.66% higher
than CC, 0.78% higher than BC, and 1.37% higher
than HEDC for the top 20 nodes. This outcome sug-
gests that the SI model may be particularly adept at
capturing the complexities of communication patterns
within corporate structures. Lastly, the Cora dataset,
which reflects citation networks in scientific litera-
ture, also sees the SI model excelling beyond other
measures. Specifically, for the top 20 nodes, the SI
model demonstrates a 3.18% greater influence spread
than HDC, 2.14% greater than CC, 1.04% greater
than BC, and 1.69% greater than HEDC, highlighting
the model’s capacity to navigate the intricate web of
scholarly influence. These simulations demonstrate
that the SI model may maximize influence in hyper-
graph systems. It offers a viable path for future study
and applications in fields where network effect is vi-
tal. The SI model’s consistent superior performance
warrants additional investigation into its incorpora-
tion into strategic network interventions and its ability
to maximize influence across varied social systems.
Figure 1 presents a multi-faceted comparative
analysis of different centrality measures, derived from
the Susceptible-Infected-Recovered (SIR) model, to
assess the spreading influence within four distinct
datasets: Amazon, DBLP, Email-Enron, and Cora.
The centralities considered include Hyperdegree Cen-
trality (HDC), Closeness Centrality (CC), Between-
ness Centrality (BC), Hyperedge Degree Centrality
(HEDC), and the proposed model for Spreading In-
fluence (SI). In the context of Amazon, the SI demon-
strates a superior performance, indicating a higher
spreading influence compared to other centrality mea-
sures. Specifically, SI outperforms HDC, CC, BC,
and HEDC by a substantial margin, with the final
time step showing SI’s influence to be approximately
8.29% greater than HDC, 5.88% higher than CC,
3.89% more than BC, and 2.97% above HEDC. For
the DBLP dataset, SI similarly exhibits a pronounced
advantage in spreading potential. At the conclusion
of the simulations, the SI surpasses HDC by 9.19%,
CC by 7.64%, BC by 5.75%, and HEDC by 4.42%,
underscoring its efficacy in capturing the nuanced dy-
namics of academic collaboration networks. In the
Email-Enron dataset, the performance gap widens,
emphasizing the robustness of the SI model in a com-
munication network scenario. Here, SI exceeds HDC
by 10.17%, CC by 11.53%, BC by 9.81%, and HEDC
by 8.25%, illustrating its substantial predictive edge
in forecasting the spread of information or influence.
Lastly, the Cora dataset, rooted in scientific cita-
tion networks, reveals SI’s predictive accuracy to be
markedly higher. The SI model’s final influence mea-
sure is 12.95% greater than HDC,11.42% above CC,
10.36% over BC, and 9.07% more than HEDC.
7 CONCLUSIONS
Hypergraph theory illuminated social networks’ com-
plexity. We used several centrality metrics to un-
derstand influence transmission in complicated net-
work architectures. While beneficial in certain cir-
cumstances, typical centrality metrics may not com-
pletely represent hypergraph influence’s multidimen-
sional character, according to our study. We devel-
oped a new Spreading Influence (SI) model and ex-
tensively compared it to established centrality mea-
sures including HDC, CC, BC, and HEDC. Our
Susceptible-Infected-Recovered (SIR) model simula-
tions revealed new information. SI significantly out-
performed other centrality metrics in forecasting in-
fluence spread across Amazon, DBLP, Email-Enron,
and Cora. SI had a higher proportion of affected
nodes than its competitors when spreading from the
top 10 influential nodes.
ACKNOWLEDGEMENTS
This research work is partially supported by the Sci-
ence and Engineering Research Board (SERB), Govt
of India, under the sponsored research project (file
Number: TAR/2021/000342).
REFERENCES
Ackerman, E., Ben-Zwi, O., and Wolfovitz, G. (2010).
Combinatorial model and bounds for target set se-
lection. Theoretical Computer Science, 411(44-
46):4017–4022.
Navigating Social Networks: A Hypergraph Approach to Influence Optimization
105

Aksoy, S. G., Joslyn, C., Marrero, C. O., Praggastis, B., and
Purvine, E. (2020). Hypernetwork science via high-
order hypergraph walks. EPJ Data Science, 9(1):16.
Aktas, M. E. and Akbas, E. (2022). Hypergraph laplacians
in diffusion framework. In Complex Networks & Their
Applications X: Volume 2, Proceedings of the Tenth
International Conference on Complex Networks and
Their Applications COMPLEX NETWORKS 2021 10,
pages 277–288. Springer.
Aktas, M. E., Jawaid, S., Gokalp, I., and Akbas, E. (2022).
Influence maximization on hypergraphs via similarity-
based diffusion. In 2022 IEEE International Con-
ference on Data Mining Workshops (ICDMW), pages
1197–1206. IEEE.
Aktas, M. E., Jawaid, S., Harrington, E., and Akbas, E.
(2021). Influential nodes detection in complex net-
works via diffusion fr
´
echet function. In 2021 20th
IEEE International Conference on Machine Learning
and Applications (ICMLA), pages 1688–1695. IEEE.
Antelmi, A., Cordasco, G., Spagnuolo, C., and Szufel,
P. (2021). Social influence maximization in hyper-
graphs. Entropy, 23(7):796.
Battiston, F., Cencetti, G., Iacopini, I., Latora, V., Lucas,
M., Patania, A., Young, J.-G., and Petri, G. (2020).
Networks beyond pairwise interactions: Structure and
dynamics. Physics Reports, 874:1–92.
Bonacich, P. (1972). Factoring and weighting approaches
to status scores and clique identification. Journal of
mathematical sociology, 2(1):113–120.
Chen, W., Wang, C., and Wang, Y. (2010). Scalable in-
fluence maximization for prevalent viral marketing in
large-scale social networks. In Proceedings of the 16th
ACM SIGKDD international conference on Knowl-
edge discovery and data mining, pages 1029–1038.
Chiranjeevi, M., Dhuli, V. S., Enduri, M. K., and Cenkera-
maddi, L. R. (2023). Icdc: Ranking influential nodes
in complex networks based on isolating and clustering
coefficient centrality measures. IEEE Access.
Domingos, P. and Richardson, M. (2001). Mining the
network value of customers. In Proceedings of the
seventh ACM SIGKDD international conference on
Knowledge discovery and data mining, pages 57–66.
Granovetter, M. (1978). Threshold models of collective be-
havior. American journal of sociology, 83(6):1420–
1443.
Hajarathaiah, K., Enduri, M. K., Anamalamudi, S., Abdul,
A., and Chen, J. (2024). Node significance analysis
in complex networks using machine learning and cen-
trality measures. IEEE Access.
Hajarathaiah, K., Enduri, M. K., Anamalamudi, S., and
Sangi, A. R. (2023). Algorithms for finding influen-
tial people with mixed centrality in social networks.
Arabian Journal for Science and Engineering, pages
1–12.
Hajarathaiah, K., Enduri, M. K., Dhuli, S., Anamalamudi,
S., and Cenkeramaddi, L. R. (2022). Generalization of
relative change in a centrality measure to identify vital
nodes in complex networks. IEEE Access, 11:808–
824.
Kempe, D., Kleinberg, J., and Tardos,
´
E. (2003). Maximiz-
ing the spread of influence through a social network.
In Proceedings of the ninth ACM SIGKDD interna-
tional conference on Knowledge discovery and data
mining, pages 137–146.
Kim, M., Newth, D., and Christen, P. (2013). Model-
ing dynamics of diffusion across heterogeneous social
networks: News diffusion in social media. Entropy,
15(10):4215–4242.
Ruhnau, B. (2000). Eigenvector-centrality—a node-
centrality? Social networks, 22(4):357–365.
Senevirathna, C., Gunaratne, C., Rand, W., Jayalath, C., and
Garibay, I. (2021). Influence cascades: Entropy-based
characterization of behavioral influence patterns in so-
cial media. Entropy, 23(2):160.
Wang, X., Ning, Z., Zhou, M., Hu, X., Wang, L., Zhang,
Y., Yu, F. R., and Hu, B. (2018). Privacy-preserving
content dissemination for vehicular social networks:
Challenges and solutions. IEEE Communications Sur-
veys & Tutorials, 21(2):1314–1345.
Xie, M., Zhan, X.-X., Liu, C., and Zhang, Z.-K. (2023a).
An efficient adaptive degree-based heuristic algorithm
for influence maximization in hypergraphs. Informa-
tion Processing & Management, 60(2):103161.
Xie, X., Zhan, X., Zhang, Z., and Liu, C. (2023b). Vital
node identification in hypergraphs via gravity model.
Chaos: An Interdisciplinary Journal of Nonlinear Sci-
ence, 33(1).
Zhu, J., Zhu, J., Ghosh, S., Wu, W., and Yuan, J. (2019).
Social influence maximization in hypergraph in social
networks. IEEE Transactions on Network Science and
Engineering, 6(4):801–811.
COMPLEXIS 2024 - 9th International Conference on Complexity, Future Information Systems and Risk
106
