
Toward Air Quality Fuzzy Classification
Vagner A. Seibert
1
, Rafael Bastos
1
, Giovani Maia
1
, Giancarlo Lucca
2
, Helida Santos
3
,
Adenauer Yamin
1
and Renata H. R. Reiser
1
1
Centro de Desenvolvimento Tecnol
´
ogico, Universidade Federal de Pelotas, Pelotas, Brazil
2
Mestrado em Engenharia Eletr
ˆ
onica e Computac¸
˜
ao, Universidade Cat
´
olica de Pelotas, Pelotas, Brazil
3
Centro de Ci
ˆ
encias Computacionais, Universidade Federal do Rio Grande, Rio Grande, Brazil
Keywords:
Fuzzy Logic, Air Quality, Sensor Validation, Classification Problem, Machine Learning.
Abstract:
This work considers different fuzzy classifier models to evaluate the air quality of indoor spaces, providing
flexible systems related to the imprecision of metrics and parameters since the modeling process. Air Quality
is a relevant topic concerning modern society, and the research on air quality evaluation provides important
alternatives for improving global environmental governance. In this paper, we discuss the performances of the
five fuzzy classifiers named CHI, FURIA, WF-C, FARC-HD, and SLAVE, applied in the data classification
from an open dataset from Germany. Thus, this domain knowledge enables us to model the inherent uncer-
tainties of attributes’ problems related to Air Quality and Air Quality Index. The results showed that fuzzy
approaches offer a valid alternative for determining and correctly classifying indoor air quality with satisfying
accuracy, adding flexible modeling in the air quality analysis.
1 INTRODUCTION
Air Quality has been an ever more important subject
for quite some time now. According to the World
Health Organization (WHO)
1
, 4.2 million deaths oc-
curred in 2016 (Organization, 2016). And this esti-
mate is increasing, as the sources of pollution only
get higher.
Accurate sensors are paramount to properly mon-
itoring air quality, introducing sensor validation as a
relevant research area. Due to its inherent failures,
the literature presents many methods to detect these
problems, ranging from classical to machine learning
methods and adding flexibility as fuzzy logic method-
ologies.
Due to its performance, Machine Learn-
ing (Nasser and Pawar, 2015) is quite often con-
sidered performing sensor validation and applying
ranges from simple methods, such as Logistical
Regression (Lee, 2005), to the most used ones, like
Neural Networks (Mattern et al., 1998). Fuzzy Logic
approaches also offer benefits to this field (Wen et al.,
2004), quite useful for its interpretability, which
gained substantial importance lately, as knowing the
reasons behind a prediction has relevant usefulness in
1
https://www.who.int
many circumstances.
Flexible computations provided by the fuzzy logi-
cal approach promote uncertainty modeling to solve
problems where information is imprecise or vague.
Whereas in classical set theory, we have no uncer-
tainty model associated with a given set, in fuzzy set
theory this is fully possible. Each element of the uni-
verse is associated by a (human/program) specialist to
its membership degree, which is given as a real num-
ber in the interval [0, 1].
Our paper aims to evaluate the performance of Air
Quality classifiers, exploring Fuzzy Logic to model
the uncertainty related to Air Quality Indexes. Given
a set of compounds that directly impact the Air Qual-
ity, we evaluate whether the classifiers can determine
the categorical classification of the indoor air environ-
ment.
This work is organized as follows: First, it intro-
duces some main concepts regarding the subject mat-
ter. In Section 3, the most important related works in
the field are discussed based on RSL select projects.
Next, Session 4 outlines the methodological strategies
used in this project. Session 5 contains the achieved
results, providing the studied methods comparison.
Finally, the last session shows the conclusions, sum-
marizing the findings of this paper.
Seibert, V., Bastos, R., Maia, G., Lucca, G., Santos, H., Yamin, A. and Reiser, R.
Toward Air Quality Fuzzy Classification.
DOI: 10.5220/0012689000003690
Paper published under CC license (CC BY-NC-ND 4.0)
In Proceedings of the 26th International Conference on Enterprise Information Systems (ICEIS 2024) - Volume 1, pages 771-778
ISBN: 978-989-758-692-7; ISSN: 2184-4992
Proceedings Copyright © 2024 by SCITEPRESS – Science and Technology Publications, Lda.
771

2 MAIN CONCEPTS
This section reports the main parameters and strate-
gies based on selected Fuzzy Rule Classifiers.
2.1 Air Quality Index
Air quality, as its name stands, is the field in charge
of studying and measuring the quality of the air and
is frequently evaluated through its Air Quality Index
(AQI), which is a metric that converts the concentra-
tion of components into a standard metric, which tells
how poor the air quality in said space is. And, the
higher its AQI, the worse the Air Quality. Table 1 de-
picts these metrics and sums up their characteristics.
Table 1: Air Quality Index Table.
Range Label
0-50 Good
51-100 Moderate
101-200 Unhealthy Sensitive
201-300 Unhealthy
301-400 Hazardous
401-500 Very Hazardous
The AQI is a piece-wise linear function of the pol-
lutant concentration. At the boundary between AQI
categories, resulting in a discontinuous jump of one
AQI unit. To convert from concentration to AQI, the
equation 1 is used, considering the following param-
eters:
• I = the (Air Quality) index
• C = the pollutant concentration
• C
low
= the concentration breakpoint that is ≤ C
• C
high
= the concentration breakpoint that is ≥ C
• I
low
= the index breakpoint related to C
low
• I
high
= the index breakpoint related to C
high
I =
I
high
− I
low
C
high
−C
low
(C −C
low
) + I
low
(1)
Eq.( 1) was firstly defined in (Agency., 2016).
2.2 Fuzzy Rule Classification Strategies
Air Quality Sensor Validation was subject to many
studies. In the systematic review conducted by (Teh
et al., 2020), the first methods considered statisti-
cal approaches, such as Principal Component Anal-
ysis (PCA) (Wold et al., 1987). More recently, new
methodologies have produced other proposals as de-
scribed in (Samal et al., 2019) and (Kumar et al.,
2020).
While there are still applications for classical ap-
proaches, the most popular methods for sensor val-
idation nowadays are from Machine Learning. In
(Wang et al., 2018) and (Wang et al., 2019), the re-
sults are described based on Recurrent Neural Net-
works (RNNs) approaches, while (Chen et al., 2019)
offers a deep learning method for Air Quality Index
modeling.
This paper integrates the approximate reasoning
of fuzzy computations and Machine Learning tech-
niques, promoting an alternative to model Air Quality
analysis. This synergic approach offers similar per-
formance to pure ML methods whilst providing un-
certainty modeling and the data readability inherent
in its approach.
In this paper we have into consideration some of
the most well-known Fuzzy Rule-Based Classifica-
tion Systems (FRBCS), namely:
• CHI. The Fuzzy Rule Learning Model, known
as CHI due to its creator (Chi et al., 1996), is a
collection of reasoning methods (Cord
´
on et al.,
1999), classifying new examples according to the
consequence of the rule. And the greatest de-
gree of association is successfully applied to pat-
tern classification problems. In (Ishibuchi and
Yamamoto, 2005), to reach further enhancements
on CHI, the adoption of heuristics is considered
and, the results improve the system performance.
So, the work depicts the implications of the dis-
tinct vote methods, including the impact of rule
weights.
• FURIA. Fuzzy Unordered Rule Induction Algo-
rithm (H
¨
uhn and H
¨
ullermeier, 2009) consists of a
technique extending the well-known rule learner
RIPPER (Cohen, 1995) while preserving its ad-
vantages. It learns fuzzy rules instead of conven-
tional rules and unordered rule sets instead of rule
lists. Furthermore, it considers an efficient rule-
stretching method to deal with uncovered exam-
ples.
• WF-C. Proposed in (Nakashima et al., 2007), the
Weighted Fuzzy Classifier consists on a method
based on if-then rules that allows the incorpora-
tion of weighted training patterns, adjusting the
sensitivity of the classification with respect to cer-
tain classes.
• SLAVEv0. The Structural Learning Algorithm in
a Vague Environment (Garcia et al., 2014), ap-
plying fuzzy-rule learning algorithms, frequently
used to benchmark new algorithms.
• FARC-HD. The Fuzzy Association Rule-based
Classification (Alcal
´
a-Fdez et al., 2011), a par-
ticular approach for high-dimensional problems.
ICEIS 2024 - 26th International Conference on Enterprise Information Systems
772
This method considers three stages to obtain an
accurate and compact fuzzy rule-based classifier
with a low computational cost.
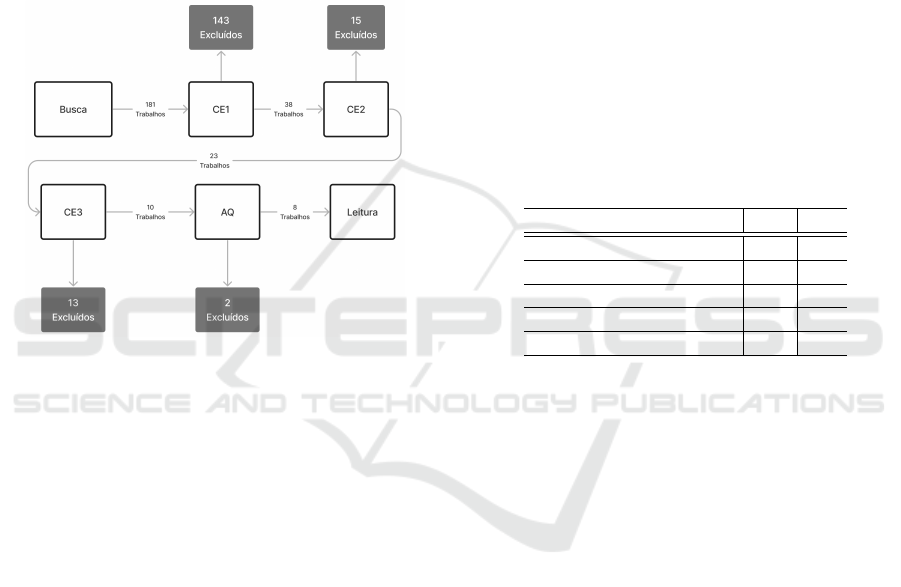
3 RELATED WORK
This section briefly discusses the Systematic Review
of Literature (SRL) and selection of projects, con-
sidering the steps in Figure 1, reporting the exclu-
sion/inclusion criteria and the cut made after the qual-
ity assessment.
Figure 1: SRL Revision Steps.
The first SRL step involves the following Re-
search Question (RQ):
• How do sensory air quality control systems make
use of methods based on fuzzy logic and machine
learning?
The keywords defined were as follows: Air Quality,
Sensors, Machine Learning, and Fuzzy Logic. Based
on these keywords, a search string was defined, with
the aim of answering the research question:
• “Sensors” AND “Air Quality” AND “Machine
Learning” AND “Fuzzy”
The inclusion criterion (IC) considers survey or
review articles whose topics are related to Fuzzy
Logic or Machine Learning in the context of air qual-
ity sensing. Moreover, to remove articles, we consid-
ered the following Exclusion Criteria (EC):
• EC1 - Reading titles related to the topic.
• EC2 - Reading the relevant abstract to the topic.
• EC3 - Reading the conclusion of the paper.
The following questions give support to measure the
papers quality:
1. Is the work related to air quality sensing?
2. Does it use Fuzzy Logic?
3. Does it use Machine Learning techniques?
4. Is the algorithmical propouses reproducible?
5. Is the proposal an open dataset?
Considering a binary answer (yes or no) and a re-
spective associated score (0 or 10) to the average of
the answers.
The following questions were utilised consider ex-
tracting data from the selected works:
1. What is the main algorithm used in the work?
2. What type of model does this algorithm fit into?
3. Where does the work data come from?
4. What are the simulation components?
The search in the selected digital libraries, re-
sulted in a total of 181 articles, 8 of which were cho-
sen for full reading, as summarized in Table 2 and
described in the following.
Table 2: Papers obtained by Digital Library.
Digital Library RP EP
1. Springer Link 111 1
2. ACM Digital Library 23 3
3. Scopus 9 2
4. ScienceDirect 38 2
Total 181 8
RP- Number of returned Papers; 2. EP- Number of Elected
Papers.
The selection considered the exclusion/inclusion
criteria, evaluating the quality of the articles. After
applying EC1, we reduced the number of articles to
38. After EC2, 23 studies remained. EC3 once again
reduced the number to 10. Finally, the quality assess-
ment assigned a grade from 0 to 50 for each work,
eliminating any with a grade lower than 40 and leav-
ing 08 for the reading stage.
The solution presented in (Alhasa et al., 2018) fo-
cuses on low-cost sensors for air quality, consider-
ing an adaptive Neuro-Fuzzy inference system. The
achievements performed a high rate of linear corre-
lation of the calibration between the applied sensor
and the reference instrument. The comparison per-
formance of calibration models as Artificial Neural
Fuzzy Inference System (ANFIS) method being the
most promising among them.
The research in (Ferreira et al., 2022) proposes
an alternative for predicting air quality using a neu-
ral network named Fuzzy Adaptive Resonance The-
ory Map (ARTMAP). The system proved to be a good
alternative for predicting air components in indoor en-
vironments, making it possible to obtain multiple fu-
ture predictions using this method.
Toward Air Quality Fuzzy Classification
773

Table 3: Data Extraction Results from Related Works.
Article Algorithm Model Type Data Origin Compounds
1 Linear Regression Classic Gas Sensors CO, CO2, NH3, (CH3)2CO
2 ANFIS Neuro Fuzzy Sensors PM2.5
3 ARTMAP Neuro Fuzzy Sensors PM2.5
4 ANFIS Neuro Fuzzy Low Cost Sensors O3, NO2, CO
5 Residual GRU Deep Learning Open Dataset O3, NO2, PMs
6 PANDA Deep Learning AQ Station Weather, AQI, POI
7 LSTM/GRU Neural Network Open Dataset PM2.5
8 SARIMA and Prophet Statistical Open Dataset PSO2, NO2, SPM, RSPM
Label Articles: 1: (Kumar et al., 2020); 2: (Bhardwaj and Pruthi, 2020); 3: (Ferreira et al., 2022); 4: (Alhasa et al., 2018);
5: (Wang et al., 2018); 6: (Chen et al., 2019); 7: (Wang et al., 2019); 8: (Samal et al., 2019).
The prediction air quality adopted in (Wang et al.,
2018) applies the Deep Multi-task Learning tech-
nique. A similar approach in (Chen et al., 2019) con-
siders the context of monitoring urban areas. The first
work demonstrates superiority compared to shallow
models and nine other baselines, while the second
shows that an approach using Gated Recurrent Unit
(GRU) and Long Short-Term Memomry (LSTM) is
capable of making a reliable prediction for up to 24
hours.
In another approach, in (Bhardwaj and Pruthi,
2020), an adaptive neuro-fuzzy inference system is
reported. This case study uses an evolutionary ap-
proach to overcome the local optima problem, as Par-
ticle Swarm Optimization (PSO) and Genetic Algo-
rithm (GA), optimizing the parameters of the neuro-
fuzzy algorithms by ANFIS.
The approach presented by (Wang et al., 2019)
considers Recurrent Neural Networks (RNNs) for air
quality prediction, promoting a model based on Gated
Recurrent Long Short-Term Memory (GRLSTM) by
using neural networks doubly recursive methods for
prediction. The results show good prediction, al-
though the accuracy is no high.
In the context of time series prediction using the
Internet of Things (IoT), we have (Kumar et al.,
2020), which makes use of a linear model in conjunc-
tion with an array of sensors, enabling to predict the
air quality of the next day.
Finally, the results reported in (Samal et al., 2019)
consider Seasonal Auto-Regressive Integrated Mov-
ing Average (SARIMA) models, as well as Prophet, a
predictive model developed by Facebook, to achieve
the prediction of air quality time series. Both meth-
ods provide a good quality of accuracy, and the best
approach is the Prophet model in logarithmic trans-
formation, demonstrating the lowest error metrics.
4 METHODOLOGY
The benchmark was conducted through the KEEL
2
Software, which offers a plethora of tools to facili-
tate the experiments’ workflow. The software pro-
vides solutions to assess algorithms for data mining
problems of various kinds, including regression, clas-
sification unsupervised learning, among others, being
a tool designed for both research and educational pur-
poses (Alcal
´
a-Fdez et al., 2009).
4.1 Dataset Description
The dataset used in this work belongs to the Aachen
University of Applied Sciences, in Germany. It con-
tains over 50 thousand samples, collected in 2023,
from March 22 till June 6. The sampling rate used
in this dataset was about two minutes, albeit there is
some variance between data points
3
.
The dataset contains 31 attributes, 29 ones are sta-
tistically described in Table 4. The two attributes that
are not in the table are timestamp and measure time,
both considering time-related variables and were not
used.
The data were classified into a few categories:
There is meta information, such as TypPS, tvoc, cnt1,
cnt2.5, etc., that represents the size or counting of cer-
tain particles. Performance and Health are attributes
that measure the overall performance and health im-
pact of said sample. Attributes with a ”d” prefix indi-
cate a rate of change, such as dHdt and dCO2dt.
There are a couple of weather-related variables,
such as humidity, temperature, and pressure. And,
of course, there are measurements for gasses and air
particles, such as the PMs, O3, NO2, etc., which are
the most important for this research proposal.
2
http://www.keel.es/
3
https://www.kaggle.com/datasets/welfposer/2023-
indoor-air-quality-dataset-germany
ICEIS 2024 - 26th International Conference on Enterprise Information Systems
774

During the exploratory analysis, at 9
th
July of
2023, we considered the following reported data
anomalies:
(a) Measurement error about fine dust values due to
sudden increase in air humidity;
(b) Lab power outage, probably triggered by a short
circuit;
(c) Large fire in Herzogenrath (9-10km away from
measuring location).
From the total of compounds existing in the
dataset, there are several different air components,
each one of them having specific thresholds to evalu-
ate its impact on air quality. In order to compare them,
the WHO limits for O3, NO2, PM10, and PM2.5
were employed to generate labels measuring their Air
Quality Index, thus making them comparable.
Table 4: Statistical descriptions for each attribute.
Comp Min Max Average Std
TypPS 1.00 15.00 10.76 5.32
oxygen 20.69 20.96 20.91 0.03
pm10 0.00 49.05 1.27 3.57
cnt0.5 0.00 1078.40 68.81 103.66
co 1.21 1.83 1.57 0.08
temp 18.33 24.61 20.69 1.21
perf 54.00 987.00 873.41 82.78
co2 424.95 908.56 520.59 77.15
so2 -163.16 2225.17 109.08 104.57
no2 -23.35 81.45 32.38 12.60
cnt5 0.00 7.39 0.22 0.43
pm1 0.00 22.20 0.85 2.25
cnt1 0.00 349.32 5.99 19.97
dewpt 0.05 15.20 7.63 2.76
tvoc 0.00 4568.40 367.62 276.60
pressure 970.08 1005.18 992.56 7.51
cnt10 0.00 3.48 0.09 0.23
dCO2dt -396.08 383.50 0.03 17.87
snd-max 31.20 92.30 57.12 5.60
health 23.00 999.00 831.16 99.12
temp-o2 22.33 28.82 24.74 1.24
cnt2.5 0.00 32.06 0.44 1.31
o3 -1.31 41.00 14.12 3.90
hum 26.76 66.86 44.30 6.74
dHdt -2.21 2.52 0.00 0.08
hum-abs 4.66 13.00 8.04 1.50
sound 22.00 68.44 50.78 2.59
pm2.5 0.00 39.65 1.09 3.26
cnt0.3 0.01 3322.60 215.72 320.68
4.2 Data Pre-Processing and
Transformation Description
Only a subset of these attributes have an actual im-
pact on Air Quality. To be more specific, the WHO
defines Air Quality Index limits for O3, NO2, PM10
and PM2.5, as depicted in Table 5.
Table 5: AQI Limits as defined by WHO.
Linguist variables pm2.5 pm10 o3 no2
Good 10.0 20.4 33.9 21.5
Moderate 25.4 50.4 51.2 106.6
Unhealthy Sens. 37.4 66.4 71.6 177.9
Unhealthy 48.4 83.4 95.6 248.6
Very Unhea. 54.4 91.4 108.9 284.8
Hazardous 60.9 100.9 122.9 319.6
Hazardous 100.0 200.0 255.1 531.9
Furthermore, the dataset was highly unbalanced.
Of the six categories of air quality, almost 90% of it
lay in the moderate or improved categories. In addi-
tion, as one can observe in Figure 2, presenting their
distribution and showing how most of the samples lie
within the first two classes. As it is, the dataset is
impractical for classification models.
To address that, a data augmentation technique
was employed: The Synthetic Minority Oversampling
Technique (SMOTE) (Chawla et al., 2002), which is
considered the standard framework for learning from
imbalanced data, due to its simplicity in design and
robustness when applied to different types of prob-
lems (Fern
´
andez et al., 2018).
5 MAIN RESULTS
Several experiments were conducted through the
KEEL Software(Alcal
´
a-Fdez et al., 2009). The labels
were generated using PM1, PM2.5, O3, and NO2,
through the piece-wise linear equation 1. Then, to
compose the inputs, five attributes were used: tem-
perature, humidity, CO, CO2, and SO2.
After expanding the dataset with SMOTE, 30
thousand examples were achieved, 10 thousand for
each class, Thus, the baseline for accuracy would be
33%. The elected three classes are due to a group-
ing combination, expanding the dataset. Six possible
classes were combined, all of them worse than AQI
2. After the data, the SMOTE method was applied,
resulting in the final dataset used for the tests.
The methods consider K-Fold cross-validation, as
it offers a balance between upward bias and com-
putational requirements (Fushiki, 2011). The cross-
validation applies the standard from the literature,
which is tenfold.
See, the parameters of algorithmic approaches:
CHI’s Parameters:
• T-norm: Product
• Reasoning Method: Winning Rule
• Penalized Certainty Factor: Rule Weight
WF’s Parameters:
Toward Air Quality Fuzzy Classification
775
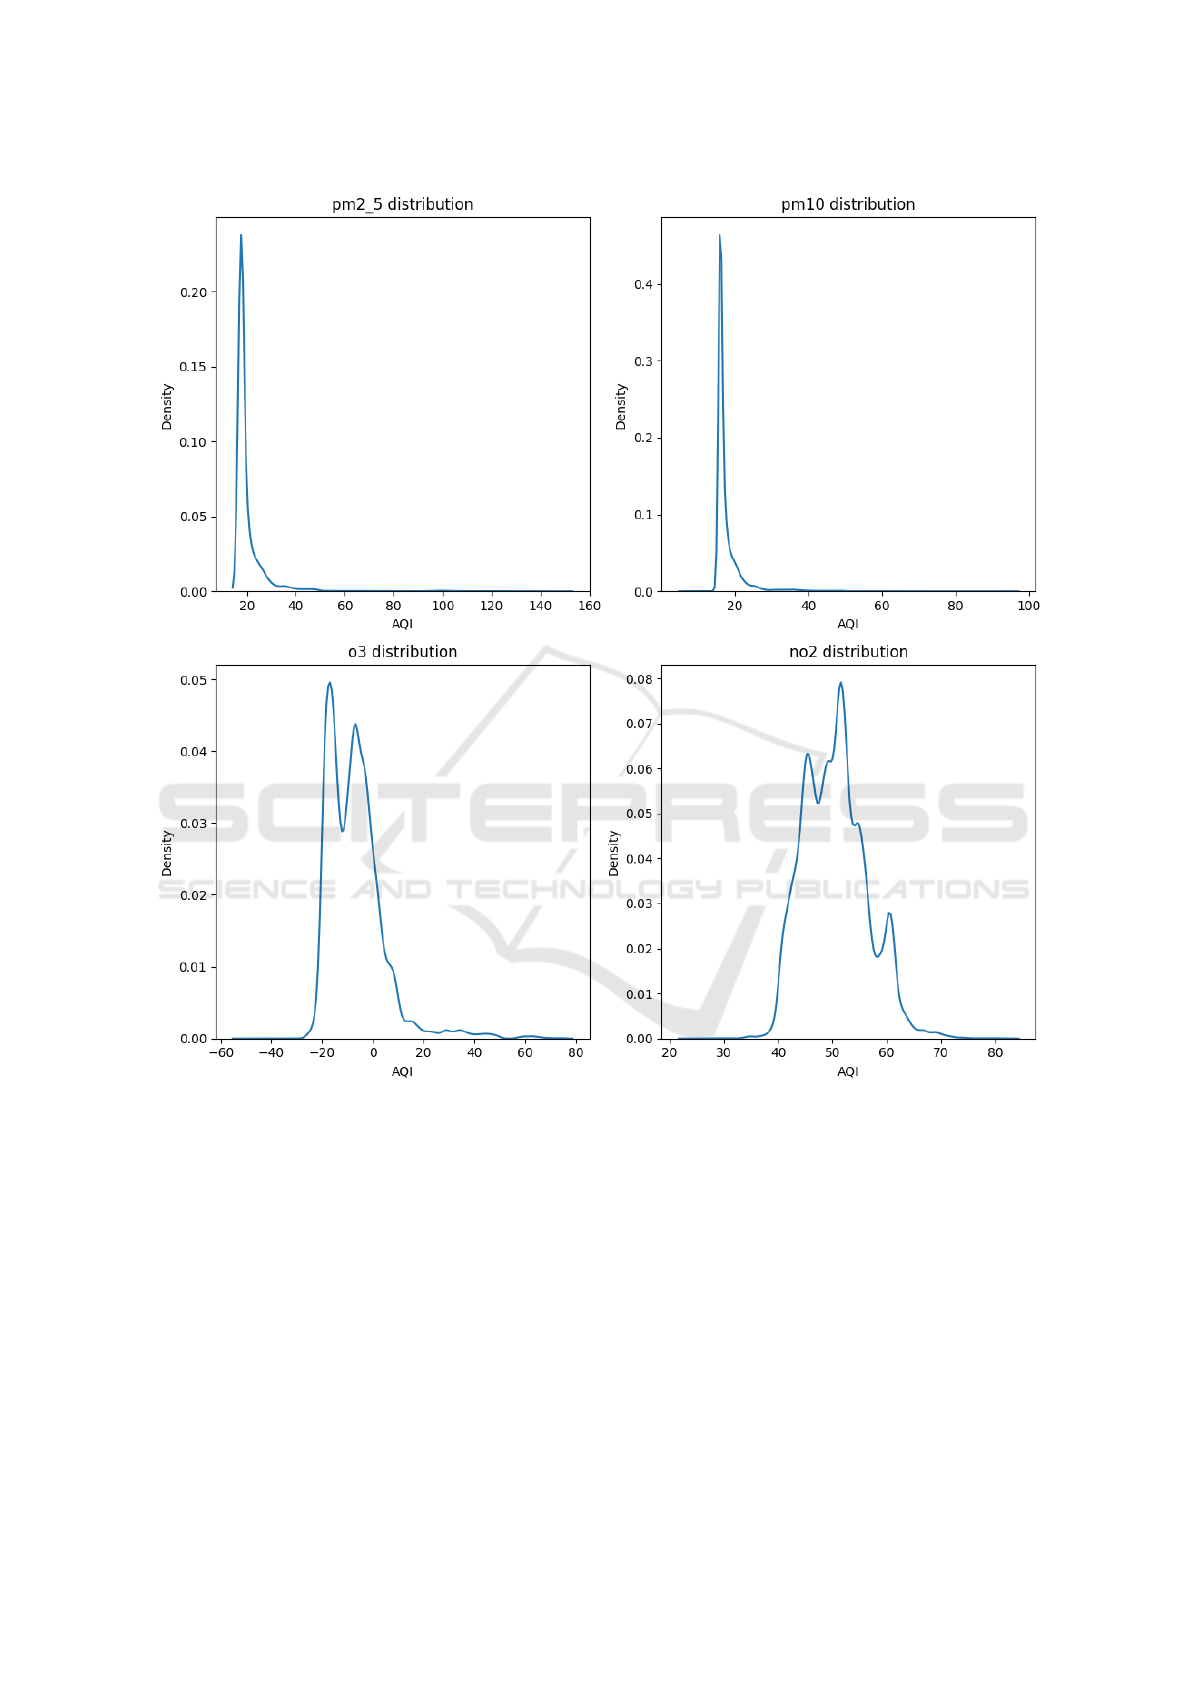
Figure 2: Air Quality Index Distribution per compound.
• Cost of Majority Classes: Proportional
• Apply learning of the Rule Weights: Yes
• NU: 0.02
• Epochs: 10
FURIA’s Parameters:
• Number of optimizations: 2
• Number of folds: 3
FARC-HD’s Parameters:
• Number of Linguistic Values = 5
• Minimum Support = 0.05
• Maximum Confidence = 0.8
• Depth of the trees (Depthmax) = 3
• Parameter K of the prescreening = 2
• Maximum number of evaluacions = 15000
• Population size = 50
• Parameter alpha = 0.15
• Bits per gen = 30
• Type of inference = 1
SLAVE’s Parameters:
• Population Size: 2 0
ICEIS 2024 - 26th International Conference on Enterprise Information Systems
776

Table 6: Accuracy of each algorithm.
CHI WF FURIA FARCHD SLAVE
Train Test Train Test Train Test Train Test Train Test
Fold 0 0.9052 0.9027 0.9363 0.9400 0.9999 0.9997 0.9694 0.9707 0.9141 0.9187
Fold 1 0.9050 0.9070 0.9370 0.9347 0.9998 0.9980 0.9600 0.9577 0.9148 0.9117
Fold 2 0.9059 0.9000 0.9371 0.9283 0.9997 0.9977 0.9643 0.9597 0.9154 0.9067
Fold 3 0.9059 0.9010 0.9375 0.9320 0.9998 0.9990 0.9616 0.9550 0.9149 0.9110
Fold 4 0.9047 0.9057 0.9366 0.9357 0.9999 0.9993 0.9711 0.9720 0.9144 0.9160
Fold 5 0.9039 0.9113 0.9361 0.9403 0.9999 0.9993 0.9655 0.9710 0.9136 0.9227
Fold 6 0.9055 0.9003 0.9366 0.9363 0.9997 0.9993 0.9640 0.9610 0.9147 0.9133
Fold 7 0.9049 0.9080 0.9364 0.9370 1.0000 0.9993 0.9658 0.9623 0.9148 0.9117
Fold 8 0.9051 0.9047 0.9361 0.9377 0.9999 0.9997 0.9634 0.9617 0.9147 0.9130
Fold 9 0.9046 0.9083 0.9354 0.9437 0.9998 0.9993 0.9691 0.9727 0.9139 0.9200
Mean 0.9051 0.9049 0.9365 0.9366 0.9998 0.9991 0.9654 0.9644 0.9145 0.9145
• Number of Iterations Allowed without Change =
500
• Mutation Probability = 0.5
• Crossover Probability = 0.1
• Lambda = 0.8
The main accuracy results from tests simulated
through KEEL are reported in Table 6, containing the
accuracy for each fold of the tested algorithms, both
for testing and training, with the final row displaying
the average for each one. The best train and test re-
sults for each row are highlighted in bold.
FURIA far outperformed the other methods, in all
case study simulations, with an average accuracy of
0.9991, being the consistently the best method in all
folds, both in training and test. The second-best tech-
nique was FARC-HD, with an average accuracy of
0.9644. The worst method was CHI, with an average
accuracy of 0.9051.
6 CONCLUSION
This work analyzes the performance of five different
fuzzy-based rule classifiers, such as CHI, WF, FU-
RIA, FARCHD, and SLAVE, to compare the distinct
classification strategies in measuring air quality based
on a set of sensors.
FURIA algorithm proved to be, by far, the best
method, outperforming the other approaches with an
outstanding 0.9991 average accuracy. The other stud-
ied methods didn’t fall too far behind, presenting av-
erage accuracy values ranging from 0.9 to 0.96, eluci-
dating the performance of fuzzy classifiers.
The results provided by these flexible algorithms
showed that fuzzy logic offers a valid alternative for
determining the air quality of an environment, mod-
eling the uncertainty related to the subset of the at-
tributes selected by this proposal, correctly classify-
ing the indoor air quality with satisfying accuracy,
within an easy to model setup given by the software
tool of choice.
As future work, datasets from other places could
be used, thus eliminating any bias regarding the loca-
tion at which the data was collected. Data extension
containing other attributes could also be explored, as
increasing the number of inputs would assess the scal-
ability of the aforementioned methods.
Furthermore, the ongoing research prospect multi-
valued fuzzy approaches, such as interval-valued
fuzzy algorithms, which should potentially grant a ro-
bust solution. In this case, modeling not only the un-
certainty referred to the lack of available information
but also included imprecision. The more imprecision
modeled, the more correct the statements. They may
also be due to a multiple-source database air quality
system, different vocabularies for expressing attribute
values, and different partitions of the same universe
of discourse.
ACKNOWLEDGEMENTS
This research was partially supported by Brazilian
funding agencies: CAPES, CNPq (309160/2019-7;
311429/2020-3, 3305805/2021-5, 150160/2023-
2), PqG/ FAPERGS (21/2551-0002057-1),
FAPERGS/CNPq (23/2551-0000126-8), and
PRONEX (16/2551-0000488-9).
REFERENCES
Agency., U. E. P. (2016). Technical assistance document for
the reporting of daily air quality – the air quality index
(aqi). U.S. Environmental Protection Agency.
Toward Air Quality Fuzzy Classification
777

Alcal
´
a-Fdez, J., Alcal
´
a, R., and Herrera, F. (2011). A fuzzy
association rule-based classification model for high-
dimensional problems with genetic rule selection and
lateral tuning. IEEE Transactions on Fuzzy Systems,
19(5):857–872.
Alcal
´
a-Fdez, J., Sanchez, L., Garcia, S., del Jesus, M. J.,
Ventura, S., Garrell, J. M., Otero, J., Romero, C., Bac-
ardit, J., Rivas, V. M., et al. (2009). Keel: a software
tool to assess evolutionary algorithms for data mining
problems. Soft Computing, 13:307–318.
Alhasa, K. M., Mohd Nadzir, M. S., Olalekan, P., Latif,
M. T., Yusup, Y., Iqbal Faruque, M. R., Ahamad, F.,
Abd. Hamid, H. H., Aiyub, K., Md Ali, S. H., et al.
(2018). Calibration model of a low-cost air quality
sensor using an adaptive neuro-fuzzy inference sys-
tem. Sensors, 18(12):4380.
Bhardwaj, R. and Pruthi, D. (2020). Evolutionary tech-
niques for optimizing air quality model. Procedia
Computer Science, 167:1872–1879.
Chawla, N. V., Bowyer, K. W., Hall, L. O., and Kegelmeyer,
W. P. (2002). Smote: synthetic minority over-
sampling technique. Journal of artificial intelligence
research, 16:321–357.
Chen, L., Ding, Y., Lyu, D., Liu, X., and Long, H. (2019).
Deep multi-task learning based urban air quality in-
dex modelling. Proceedings of the ACM on Interac-
tive, Mobile, Wearable and Ubiquitous Technologies,
3(1):1–17.
Chi, Z., Yan, H., and Pham, T. (1996). Fuzzy algorithms:
with applications to image processing and pattern
recognition, volume 10. World Scientific.
Cohen, W. W. (1995). Fast effective rule induction. In Ma-
chine learning proceedings 1995, pages 115–123. El-
sevier.
Cord
´
on, O., del Jesus, M., and Herrera, F. (1999). A pro-
posal on reasoning methods in fuzzy rule-based clas-
sification systems. International Journal of Approxi-
mate, 20(1):21–45.
Fern
´
andez, A., Garcia, S., Herrera, F., and Chawla, N. V.
(2018). Smote for learning from imbalanced data:
progress and challenges, marking the 15-year an-
niversary. Journal of artificial intelligence research,
61:863–905.
Ferreira, W. d. A. P., Grout, I., and da Silva, A. C. R.
(2022). Application of a fuzzy artmap neural network
for indoor air quality prediction. In 2022 International
Electrical Engineering Congress (iEECON), pages 1–
4. IEEE.
Fushiki, T. (2011). Estimation of prediction error by us-
ing k-fold cross-validation. Statistics and Computing,
21:137–146.
Garcia, D., Gonzalez, A., and Perez, R. (2014). Overview
of the slave learning algorithm: A review of its evolu-
tion and prospects. International Journal of Compu-
tational Intelligence Systems, 7(6).
H
¨
uhn, J. and H
¨
ullermeier, E. (2009). Furia: an algorithm
for unordered fuzzy rule induction. Data Mining and
Knowledge Discovery, 19(3):293–319.
Ishibuchi, H. and Yamamoto, T. (2005). Rule weight spec-
ification in fuzzy rule-based classification systems.
IEEE Transactions on Fuzzy Systems, 13(4):428–435.
Kumar, R., Kumar, P., and Kumar, Y. (2020). Time series
data prediction using iot and machine learning tech-
nique. Procedia computer science, 167:373–381.
Lee, S. (2005). Application of logistic regression model and
its validation for landslide susceptibility mapping us-
ing gis and remote sensing data. International Journal
of remote sensing, 26(7):1477–1491.
Mattern, D., Jaw, L., Guo, T.-H., Graham, R., and McCoy,
W. (1998). Using neural networks for sensor valida-
tion. In 34th AIAA/ASME/SAE/ASEE Joint Propulsion
Conference and Exhibit, page 3547.
Nakashima, T., Schaefer, G., Yokota, Y., and Ishibuchi, H.
(2007). A weighted fuzzy classifier and its application
to image processing tasks. Fuzzy Sets and Systems,
158:284–294.
Nasser, A. M. and Pawar, V. (2015). Machine learn-
ing approach for sensors validation and clustering.
In 2015 International Conference on Emerging Re-
search in Electronics, Computer Science and Technol-
ogy (ICERECT), pages 370–375. IEEE.
Organization, W. H. (2016). Ambient air pollution: a global
assessment of exposure and burden of disease. World
Health Organization.
Samal, K. K. R., Babu, K. S., Das, S. K., and Acharaya,
A. (2019). Time series based air pollution forecast-
ing using sarima and prophet model. In proceedings
of the 2019 international conference on information
technology and computer communications, pages 80–
85.
Teh, H. Y., Kempa-Liehr, A. W., and Wang, K. I.-K. (2020).
Sensor data quality: A systematic review. Journal of
Big Data, 7(1):1–49.
Wang, B., Kong, W., and Guan, H. (2019). Air quality for-
casting based on gated recurrent long short-term mem-
ory model. In Proceedings of the ACM Turing Cele-
bration Conference-China, pages 1–9.
Wang, B., Yan, Z., Lu, J., Zhang, G., and Li, T. (2018).
Deep multi-task learning for air quality prediction.
In Neural Information Processing: 25th International
Conference, ICONIP 2018, Siem Reap, Cambodia,
December 13–16, 2018, Proceedings, Part V 25,
pages 93–103. Springer.
Wen, Y.-J., Agogino, A. M., and Goebel, K. (2004).
Fuzzy validation and fusion for wireless sensor net-
works. In ASME International Mechanical Engineer-
ing Congress and Exposition, volume 47063, pages
727–732.
Wold, S., Esbensen, K., and Geladi, P. (1987). Principal
component analysis. Chemometrics and intelligent
laboratory systems, 2(1-3):37–52.
ICEIS 2024 - 26th International Conference on Enterprise Information Systems
778
