
Bus Routing Optimisation: A Case Study for the Toulouse Metropolitan
Area
Joan Burgalat
1,2 a
, Ga
¨
el Pallares
1 b
, Myriam Foucras
3 c
and Yohan Dupuis
4 d
1
CESI LINEACT, Campus de Montpellier, Mauguio, France
2
ENSAM, Paris, France
3
CESI LINEACT, Campus de Toulouse, Lab
`
ege, France
4
CESI LINEACT, La D
´
efense, Paris, France
Keywords:
Public Transport, Transport Management and Optimisation, Sustainability, Trip Chaining, Origin-Destination
Matrix.
Abstract:
This paper investigates the efficiency evaluation of a public transport using an analysis of Origin-Destination
matrices (mOD). The use of a trip-chaining method on the automatically collected transport data provides
a realistic and accurate representation of traffic flows characterized by mOD. The introduction of a critical
walking distance and an user flow at bus stop allow us to probe possible network configurations and identify
the best one in terms of service offer, ecological impact and operational cost. The configurations comparison
allows to identify the levers for the transport management. We deploy this methodology on a french case study
for the Toulouse Metropole Occitanie region. The main obtained results shows that for a walking distance
close to 1000m, the distance per day on a bus line can be optimised by 3km for a time saving close to 20%,
representing an annual gain of more than 1ton of CO
2
for a user loss of around 3%. These results suggest that
low-cost optimisation of a transport network is possible while maintaining a high-quality, environmentally-
friendly service offering.
1 INTRODUCTION
Public transport is a strategic and much-used mode
of transport throughout the world. It is becoming in-
creasingly necessary to promote its use and to make
this mode of transport more sustainable in order to
limit greenhouse gas emissions as CO
2
and pollution.
In the USA, public transport represents average 6 bil-
lion trips in 2020 and 32.87 billion total passenger
miles travelled of which 50% is for travel to work and
37% for shopping and entertainment. On the energy
front, there has been a reduction in CO
2
emissions
through the use of metro trains instead of private cars
and a shift in the bus fleet towards hybrid buses (7%
in 2010 for 18.8% in 2020), leading to a reduction in
the use of fossil fuels (Dickens, 2023).
In Asia, domestic passenger transport is expected
to increase by 2.6% between now and 2030, ris-
a
https://orcid.org/0009-0006-1726-0804
b
https://orcid.org/0009-0002-8680-604X
c
https://orcid.org/0009-0002-3673-8528
d
https://orcid.org/0000-0002-9725-2049
ing from 16 trillion passenger kilometres in 2018 to
around 22 trillion in 2030. However, it is predicted
that CO
2
emissions will increase by 1.1%. Although
there is a slowdown in CO
2
emissions, the forecasts
suggest that the objectives of the Paris Agreement
on climate change will not be achieved (Sudhir Gota,
2023).
In EU, use of public transport increased by 70%
overall between 2000 and 2019, although there was a
decrease in some countries (Poland, Slovakia, Greece,
etc.).
It should be remembered that in the EU road
transport represents average 96% of transport sector
greenhouse gas emissions, although there has been
a decrease since 2008 which continues to accelerate
(ADEME, 2023).
Regular use of public transport has become an im-
portant part of the demand for transport networks.
Before the COVID-19 crisis in France, regular use
of public transport hovered around 70% (UTP, 2022)
with a peak in 2019 (73%) with a high proportion of
bus mode use (around 40%). Post COVID-19 use is
estimated at 53% in 2021, with a recovery to 59% in
370
Burgalat, J., Pallares, G., Foucras, M. and Dupuis, Y.
Bus Routing Optimisation: A Case Study for the Toulouse Metropolitan Area.
DOI: 10.5220/0012689100003702
Paper published under CC license (CC BY-NC-ND 4.0)
In Proceedings of the 10th International Conference on Vehicle Technology and Intelligent Transport Systems (VEHITS 2024), pages 370-377
ISBN: 978-989-758-703-0; ISSN: 2184-495X
Proceedings Copyright © 2024 by SCITEPRESS – Science and Technology Publications, Lda.

2022. However, 41% of French people do not use
public transport while the transport sector is the main
source of greenhouse gas emissions (MinisterForE-
cology, 2022).
Public transport is an important part of work-
ing life and is constantly growing to meet the ever-
increasing demand due to demographic growth and
urban densification. To meet this demand, it is becom-
ing important to optimise transport networks. To do
this we need to be able to quantify and evaluate net-
work efficiency. Some authors have already worked
on this issue. The notion of transport network effi-
ciency is a complex one: we can cite six major issues
such as cost, service, congestion, sustainability, so-
cial inclusion and accessibility, the relevance of these
issues varies depending on the observer viewpoint.
Daraio et al. propose a framework with a reading
grid weighted to take this particularity into account
(Daraio et al., 2016). For example, Hrelja explains
that there are a number of important factors involved
in assessing the effectiveness of networks. These in-
clude quality of service (waiting times, journey times,
punctuality and clarity of information). However,
these points can also depend on the geographical area
(urban or rural) and the travel objectives: for work, we
expect frequent departures and a high level of punctu-
ality; ticketing systems must be simple and integrated,
and vehicles must be comfortable (Hrelja et al., 2020).
Moreover, others factors such as bus frequency, jour-
ney time or distance travelled, are directly linked to
the network and bus routing and have an impact on
the network’s response to demand, as well as having
an impact on the environment. Network-dependent
points can be measured from data collected during bus
passages. Distance and travel time are linked to stops
imposed by the bus route to meet user demand. A
standard way of assessing demand is to estimate the
origin-destination matrix.
In the context of sustainable cities, it is impor-
tant to work on the various levers to reduce the trans-
port network’s footprint. Considering the CO
2
emis-
sion rate for a bus (around 900 −1000 g/veh.km) and
car (around 150−200 g/veh.km) in France (INFRAS,
2023), it takes between 5 and 7 cars to emit as much
CO
2
as a bus. Looking at short-distance journeys
(< 100km), statistics show that 1.4 people on aver-
age (MinisterForEcology, 2019) occupy a car. A bus
will be more profitable than a private car, if there is
a flow of people at each stop in the interval [7,10].
In this work, we propose an innovative approach to
optimise a transport network from an ecological and
an economic point of view. The objective is to reduce
greenhouse gas emission while maintaining quality of
service, simply by analysing ADCS data. Daily OD
matrices are estimated using the trip chaining method
described above. The passenger flow per stop (num-
ber of people using the stop to get on and off) is
then computed. The introduction of a critical walk-
ing distance and an user flow at bus stop allow us to
probe possible network configurations by removing
bus stops and route modification thanks to the Open
Source Routing Machine (OSRM) software. By con-
sidering various constraints such as the flow at stops
and the acceptable walking distance threshold, we can
optimise the bus route.
• Decrease journey times and distance travelled
• Reduce greenhouse gas emissions
The paper is structured as follows: first, we intro-
duce the experimental setup with the public transport
network and the available data. Next, the methodol-
ogy is presented with an explanation of Trip Chain-
ing Method and the algorithm we developed. Subse-
quently we present the results obtained and the dis-
cussion section offers an analysis of the results and
opportunities for further researches.
2 METHODOLOGY
2.1 Data Collection
The development and management of the network is
based on the data collected, whether ticketing data
when validating the ticket or location data collected
with the Operations Support System. General Transit
Field Specification (GTFS) files contain network in-
formation (lines, timetables, stations, etc.) The com-
bined use of location and ticketing data provides pre-
cise spatio-temporal information on how passengers
use the network. Based on the data mentioned , we
used the mODs of a high service level bus lines to test
our method. Those mODs matrices represent regu-
lar season ticket except for unique validation ticket or
tickets with multiple validation Those trips take place
outside the school holidays and at weekends. On a
thursday in october 2019, around 24000 passengers
used this line, knowing that there 80 passages in one
way. Those data represent a high level bus line and do
not consider travel on demand transport.
2.2 mOD Reconstruction
An Origin-Destination Matrix is a matrix that de-
scribes the number of users a
i j
who boarded at ori-
gin i (row) and alighted at destination j (column).
This tool is used to represent the demand placed by
Bus Routing Optimisation: A Case Study for the Toulouse Metropolitan Area
371

Figure 1: Displacement reconstruction using TCM.
users on the transportation network. Originally con-
ducted through surveys, mODs are now established
using Automatic Data Collection Systems (ADCS)
data, which is more cost-effective and easier to imple-
ment. Networks can be divided into two categories:
closed networks, where users validate both at entry
and exit, and they have a fare dependent on the dis-
tance travelled; and open networks, where users only
validate at boarding, and the fare is independent of
the distance travelled. For closed networks, establish-
ing an mOD is straightforward. However, for open
networks, it is necessary to estimate the user’s alight-
ing stop. Various methods exist for this, including the
Trip Chaining Method (TCM) (Alsger et al., 2016;
Hora et al., 2017), which utilizes ticketing and geo-
graphical data, as well as the different boarding lo-
cations throughout the day to chain the journey and
determine alighting stops. For example, the use of
ADCS data to estimate mOD (Cui, 2006; Wang et al.,
2011; Huang et al., 2020), the identification of fac-
tors influencing modal change (Ji et al., 2019; Li,
2016) or the evaluation of the effectiveness of com-
bining different methods and/or datasets (Feng et al.,
2018; Osorio and Punzo, 2019; Ge and Fukuda, 2016;
El Mahrsi et al., 2014). The above examples suggest
that mODs can be used to optimise public transport
networks.
In our case study, the mODs were reconstructed
using the trip chaining method (TCM). This method is
based on transport data (ticketing, Operating Support
System, etc.) and is used to reconstruct a passenger’s
journey on the network based on multiple validations
on the same day. TCM is based on various principles
that aim to describe the logic of user choices during
multiple-validation journeys. These include:
1. The alighting stop is the same stop as the next
boarding stop or the nearest stop to the next board-
ing stop.
2. The last stop of the day is the same as the first
boarding stop or the stop closest to the first board-
ing stop.
3. To make a connection, users agree to walk a cer-
tain distance less than a threshold distance.
This is an approximate method and those simplifica-
tion due to principles implies some errors. Hussain in
(Hussain et al., 2021) explain that TCM has average
90% of success. For more information on the prin-
ciples governing TCM, please consult (Hora et al.,
2017).
In figure 1, a passenger travels on the network and
his various validations are collected at different times.
The validations correspond to the different journeys
made by the passenger on the network. One of the
principles of TCM is that the passenger gets off at the
stop closest to his new stop. We can therefore deduce
the locations of the alighting and the time using the
GTFS and reconstruct the mOD.
2.3 Network Optimisation Method
Towns are becoming denser and populated leading to
an increasing of pollution and need for mobility In
view of the current crisis in public health, the need
to improve air quality and climate change linked to
greenhouse gas emissions, we need to consider all
possible solutions to limit the impact of the players
involved in this situation. One possible solution is to
remove bus stops that are not used very often and then
calculate the shortest bus route and then reduce green-
house gas emission.
In our case study, we have chosen a line in the
Tiss
´
eo Collectivit
´
es network and the objective is to
determine which stops on this line are few used and
to see what effects the removal of these stops would
have on the network response (number of passengers
not picked up, number of km covered, etc).
To carry out this analysis, we chose to consider
two constraints: the first is the flow at the stop, i.e.
the number of people using the stop (boarding and
alighting). The second is the acceptable walking dis-
tance. We retrieve the flow value N
i
at the stop i being
evaluated and compare it with a flow threshold value
N
T
. If the flow at the stop is smaller than the thresh-
old flow, we remove the bus stop and the flow of the
removed stop N
i
is put to zero. The distance threshold
will determine if users of the removed bus stop are
lost in the worst case or reported to the nearest stop.
Indeed, we calculate D
i−1,i
which is the distance be-
tween stop i and stops i − 1 and D
i,i+1
which is the
distance between stop i and i+ 1. If at least one of the
distances is smaller than the threshold distance D
T
,
then users from bus stop i are transferred to the near-
est stop implying an user walking between both bus
stops.The walking distance users to reach the near-
est stop is calculated using the OSRM application in
VEHITS 2024 - 10th International Conference on Vehicle Technology and Intelligent Transport Systems
372
walking mode. Otherwise, the users are considered to
have been removed for the public transport users. For
a given distance threshold and a given flow threshold,
the bus line is evaluated and if some bus stops are re-
moved, the distance travelled and the travel time by
the bus are computed with the OSRM application in
driving mode. The algorithm used to achieve this is
shown in Algorithm 1.
Data: List inter stop distance,
List stop f lows
Initialization;
for N
i
in List stop f lows do
if N
i
< N
T
then
The stop is removed
for D
i
in List inter stop distances
do
if D
i−1,i
< D
T
or D
i,i+1
< D
T
then
Users go to the nearest stop;
N
min(D
i−1,i
,D
i,i+1
)
+ = N
i
;
Walking distance+ =
N
i
× min(D
i−1,i
,D
i,i+1
);
else
Users are lost;
Loss+ = N
i
;
end
end
N
i
= 0;
else
end
Calculation of the new bus route (distance
and duration);
end
Algorithm 1: Optimisation and bus routing calculation al-
gorithm.
3 RESULTS
3.1 Experiments
We propose a case study on the public transportation
network in Toulouse, managed by the entity Tiss
´
eo
Collectivit
´
es, which plans, organizes, and evaluates
its mobility policies. The network is made up of 2
metro lines with 27 km of track, 2 tram lines with 24.8
km of track, an urban cable car (T
´
el
´
eo, the longest in
France) with 3 km of track, 10 High Service Level
Buses and around a hundred bus routes covering 1494
km. The intention to develop a sustainable and re-
sponsible service includes specific facilities in the
study area, such as park-and-ride facilities and bike
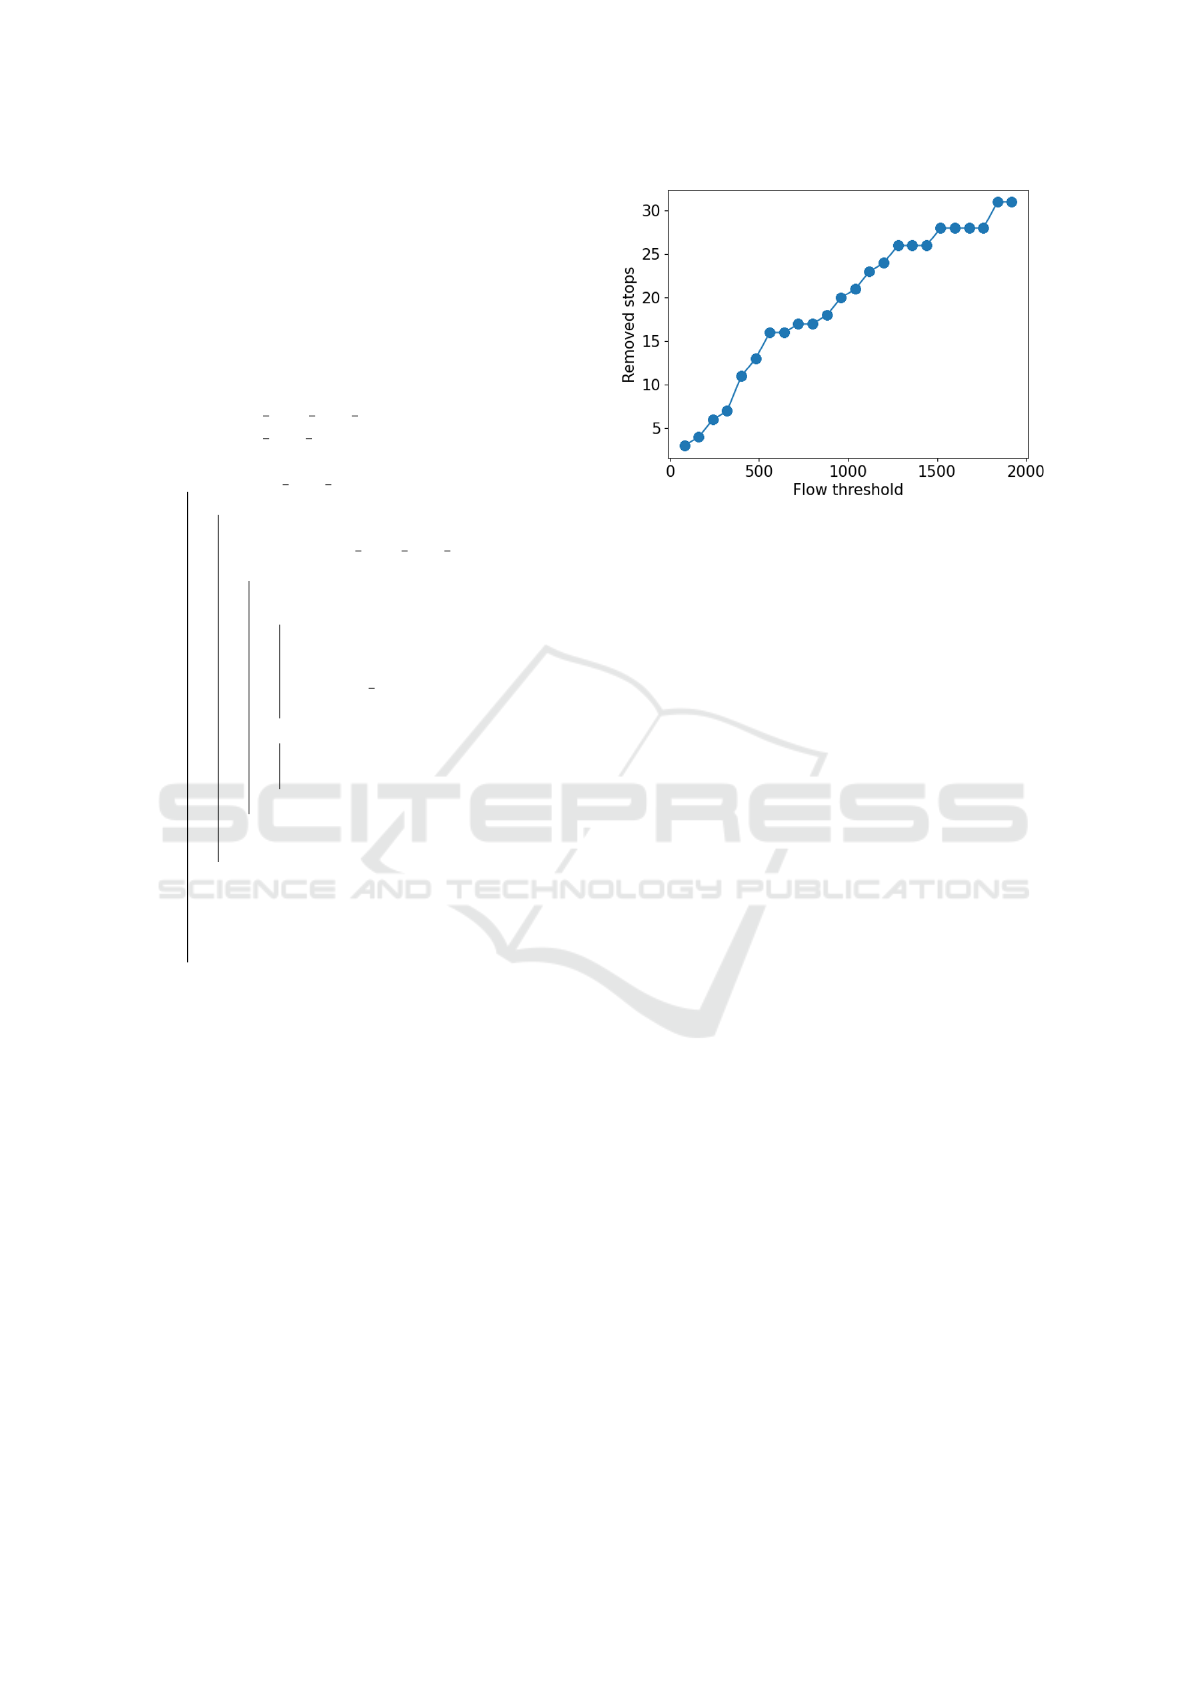
Figure 2: Removed stops as a function of flow threshold.
parks. Additionally, there is a Transport-on-Demand
service for an area with over a million inhabitants
(Tiss
´
eo, 2023).
3.2 Results
In this paper, we present results for one of the High
Service Level Bus. On the studied day, around 24000
passengers used this line, knowing that there 80 pas-
sages in one way. The line is composed of 38 bus
stops and the nominal travelled distance is 14,568 km.
Figure 2 shows the number of stops removed from the
line as a function of the flow threshold values chosen.
The graph shows an increasing trend, as the higher
the flow threshold, the more likely it is that a stop
will be cancelled. In order to achieve the objective
of reducing CO
2
, the minimum flow value accepted is
7 people per stop. With 80 symmetrical passages per
day, this amounts to a minimum threshold of 560 peo-
ple using the stop per day. A graphical reading, con-
firmed by data analysis, shows that for a daily flow of
560 people per acceptable stop, half of the stops on
the line will be cancelled.
Figure 3 represents the ratio of people lost on the
line as a function of the threshold flow value and the
acceptable walking distance in the form of a heat ma-
trix. It can be seen that quality of service will be af-
fected for acceptable walking distances of less than
350m, whatever the flow. For distances greater than
350m, we can see that the ratio of people lost is very
low, which is explained by a stop reassignment be-
cause the median inter-stop distance is 346m. There-
fore, there is a one-in-two chance of finding a consec-
utive stop within 350 metres, hence the completely
blue zone above 400 metres, as very few people are
lost.
When bus stops are removed, users have to walk
to the nearest bus stop. The figure 4 represent the
walking distance that users have to cover. This dis-
Bus Routing Optimisation: A Case Study for the Toulouse Metropolitan Area
373
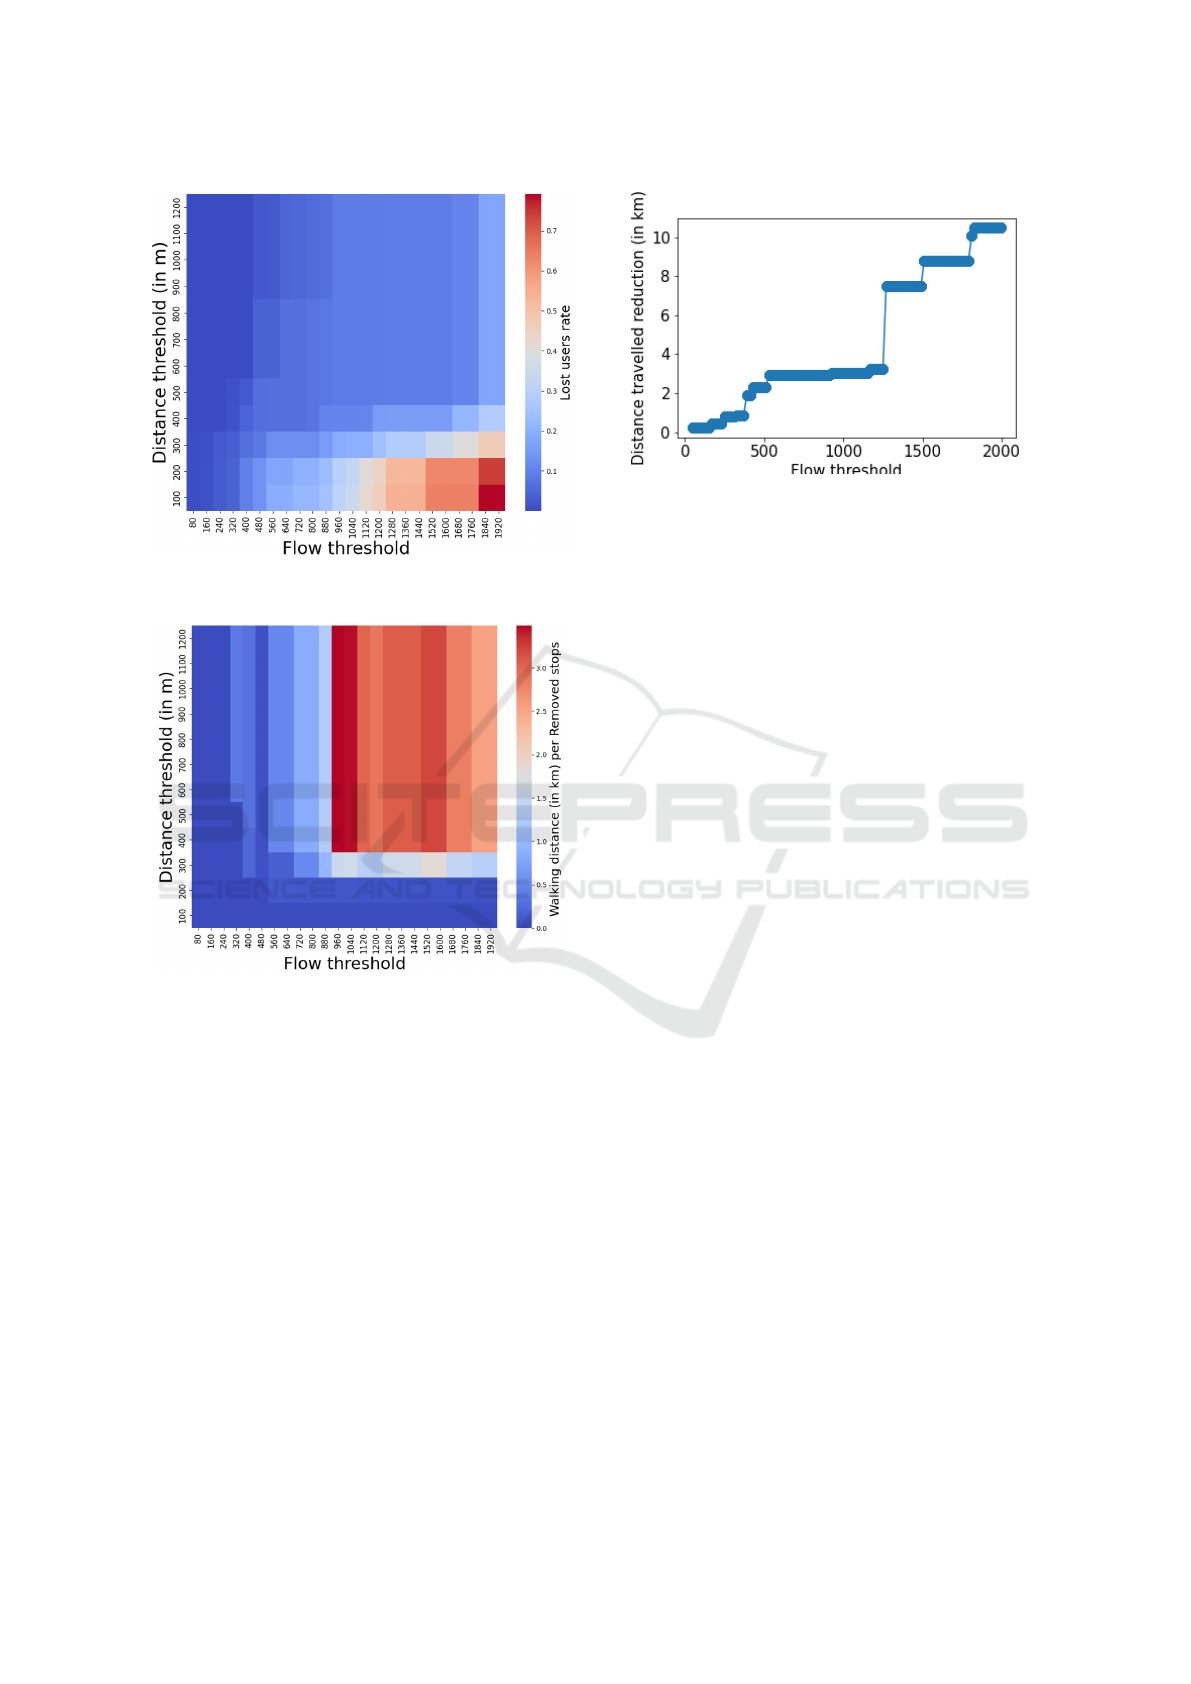
Figure 3: Rate of people lost per flow threshold and distance
threshold.
Figure 4: Walking distance per removed stops as a function
of distance and flow threshold.
tance is a function of the flow threshold and the dis-
tance threshold i.e. the distance that users are willing
to walk, however those distances do not represent an
one-way displacement and not a round trip.
For example, whatever the flow threshold value,
for acceptable walking distances below 250m, users
will have to walk an extra-distance of 500m on the
network to reach a stop. From 250m to 350m, the
distance to be covered is of the order of a kilometre.
Beyond 350m, there is a fracture at a flow threshold of
880 users per stop. For flows above this cut-off, users
will have to walk more than 2km, but for lower flows
the maximum walking distance will be close to 1km.
Figure 5 shows the bus distance travelled reduc-
tion (difference of the distance travelled by the bus
between ante and post optimisation) as a function of
flow threshold. It can be seen that the curve has an in-
Figure 5: Travelled distance reduction as a function of the
flow threshold.
creasing trend, but with levelling off phenomena, par-
ticularly from a flow threshold equal to 560 users per
stop. In this case, the bus reduces its travel distance
by 3km per trip. For flow thresholds between 560 and
1300, the gain in distance is very small because the
removal of stops does not change the bus route in this
range, the removed stops are aligned and the rerout-
ing of buses is therefore not significant. Beyond this
range, the gain in distance is around 8km, as the re-
moval of several consecutive stops is likely to lead to
a change in the route and therefore the use of another
route.
4 DISCUSSION
The question is how the optimisation by stop deletion
affects the service quality. We have therefore plotted
on the figure 6 the distribution of users lost due to a
stop being cancelled (influence of flow threshold, cf.
Figure 2) and as a function of the acceptable walking
distance.
The number of people lost is inversely propor-
tional to the acceptable walking distance. For exam-
ple, for a flow threshold of 560 people per trip and
an acceptable walking distance threshold of 100m,
we lose 4651 users, whereas for a walking distance
threshold of 1200m, we lose around 601 people. For
a total attendance of 24000 people in the worst-case
scenario, this amounts to a loss of 20% of people,
whereas in the best case losses are estimated at around
3%.
The choice of a daily flow threshold of 560 per
stop informs us that the losses will be contained in the
interval [3%,20%]. From figure 5 we can see that the
value of 560 corresponds to the start of the first stage
in achieving a significant saving in distance travelled
of 3km per day and a time saving of around 20%. This
time gain can be an opportunity to increase the buses
VEHITS 2024 - 10th International Conference on Vehicle Technology and Intelligent Transport Systems
374
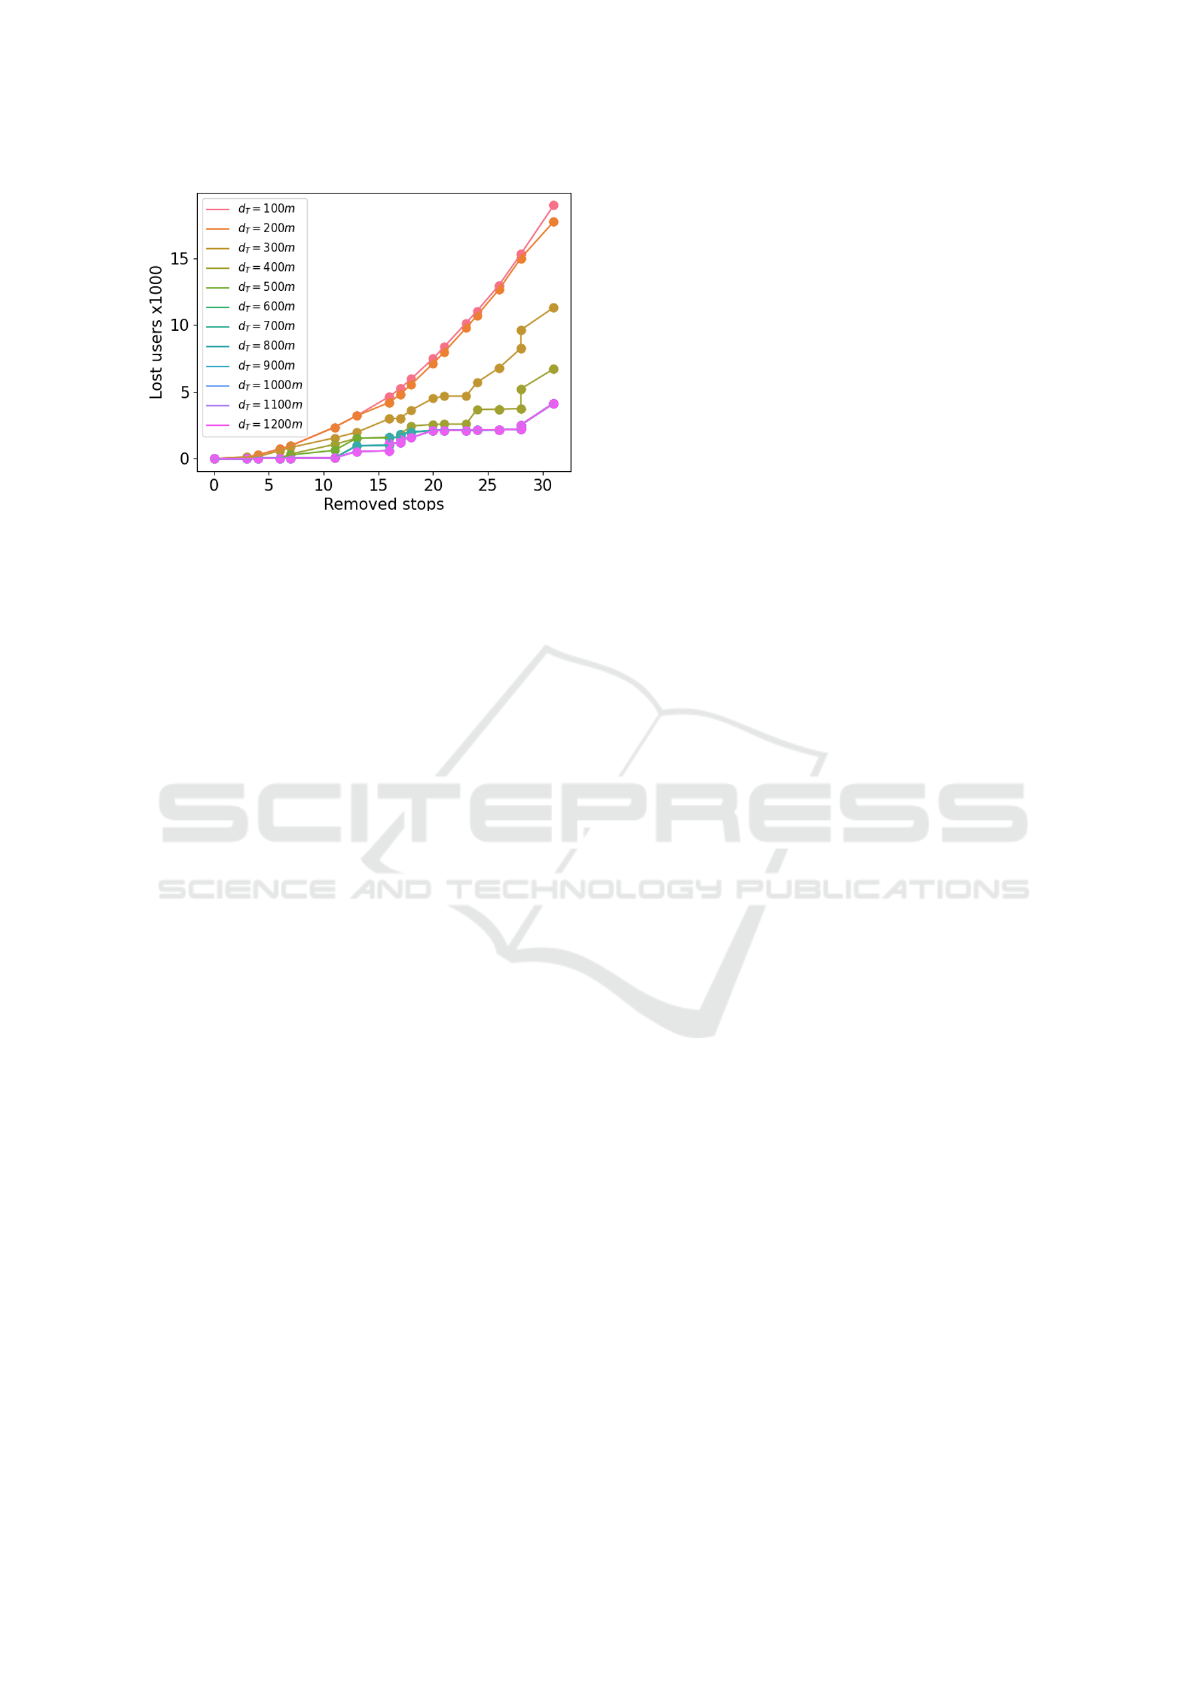
Figure 6: Number of lost users as function of the number
of removed stops for different walking distance threshold
(d
T
).
services frequency. Furthermore, the additional walk-
ing distance that users will have to cover to reach a
replacement stop is between 500m and 1km.
Given that the average bus consumes between 50
and 60 litres of fuel per 100km, we can calculate a
saving of between 240L and 288L per day and for this
line. On the other hand, the CO
2
emission rate is in
the range of [900, 1000] g/km, thus for a reduction of
3km per trip on a line corresponds to a reduction of
CO
2
emissions in the [432, 480] range kg per day for
a given bus line. If we extent the result to the bus
network of more of than 100 bus lines, this represents
several dozens of tons of CO
2
per day and then several
dozens of thousands of tons of CO
2
per year. How-
ever when bus stops are removed, users should take
another transportation mode for example bike shar-
ing, transport for demand, taxis or private car. On
the one hand, environmental parameters may favour
the use of certain transportation mode for example
the weather, congestion network, distance to cover or
proximity with city centre, etc. On the other hand,
socio-economical parameters age, household compo-
sition, employment, etc. The use of carbon modes
generates emissions that need to be taken into ac-
count. Some studies prove that people are more likely
to walk in their neighbourhood if there is a bus station
is located at less than 400m (Boulange et al., 2017).
Moreover, public transport user are more likely to
walk, between 400m and 800m, to reach their stop
(Reck et al., 2022).
The analysis of the figure 4 provides relevant in-
formations but lacks realism, as it seems that the
walking distance is the main factor. However, in our
study the walking distance threshold does not depend
on few parameters that can influence the evaluation of
the acceptability threshold. For example, the weather,
the topography of the site (slope, layout of pedes-
trian zones) or natural barriers such as a river. Hus-
sain in (Hussain et al., 2021) has already raised this
point Moreover, our assessment of the ecological im-
pact takes into account the number of people at the
stops, but the comparison in terms of CO
2
emissions
between car and bus takes into account a journey, i.e.
an inter-stop journey. A possible improvement to our
study would be not to take into account only the flow
of people at the stops, but also to include the occu-
pancy of the bus. If occupancy is below the threshold,
we consider that the network is not optimised in terms
of CO
2
emissions. The model that we propose is suf-
ficiently simple to be implemented but there is some
phenomena that we do not consider. Firstly remov-
ing stops will increase the demand on the other bus
stops so the boarding duration will increase and so on
the pollution due to the longer dwell time. Secondly
there is some factors that can raise greenhouse gas
emissions that our model don’t take into account for
example the traffic congestion, vehicle types, travel
speed or acceleration deceleration rates. Moreover
the CO
2
emission is calculate with (INFRAS, 2023)
which take into account vehicle type, years and type
of engine. It will be interesting to take into account
some other factors to estimate more precisely the CO
2
emission, for example the speed, driving style, dis-
tance or vehicle load. Thirdly, we need to know the
passenger’s behaviour, if a stop is removed, some pas-
senger will not go to the nearest stop but may be they
will use different transportation mode such as private
cars, taxis, transport-for-demand that can increase the
greenhouse gas emission.
5 CONCLUSIONS
With the world’s population constantly on the in-
crease, there is a growing demand for mobility. With
public transport systems under increasing strain, it is
important to find ways of meeting demand efficiently.
At the same time, the ecological impact of transport
must also be taken into account. To this end, we pro-
pose a method for optimising a bus route in terms
of distance travelled, while measuring the impact on
quality of service and greenhouse gas emissions. Our
results show that for a flow threshold value of 560
users per stop, the number of stops removed corre-
sponds to half of the stops on the line. It was found
that the rate of people who would no longer have ac-
cess to the public transport service would be between
3% and 20% depending on the accepted walking dis-
tance of 1200m and 100m respectively. With regard to
greenhouse gas emissions, the reduction in emissions
is estimated more than 450 kg per day for a given bus
Bus Routing Optimisation: A Case Study for the Toulouse Metropolitan Area
375

line which represents a reduction of more than 150
tons per line and per year. Compare to references in
the literature (Stewart and El-Geneidy, 2016) explain
that bus stop consolidation is effective and simple to
the quality of service, and conclude that remove aver-
age 23% bus stops and reducing the system coverage
area by 1%. In addition (Kehoe, 2004) show that bus
stop consolidation improve timetable reliability and
has no negative impact on ridership, and can even im-
prove it.
This study is an initial effort to examine the feasi-
bility of solutions to reduce the carbon impact on the
environment, while also assessing the impact on qual-
ity of service. Our model is not perfect and needs to
be modified to include more factors in the quantifica-
tion of greenhouse gas emissions. However, we also
need to assess the influences and trends on the choice
of mode of transport when there is a modal shift.
ACKNOWLEDGEMENTS
All the mentioned authors performed the contribu-
tions to the present paper. This work was carried
out within the framework of a scientific collabora-
tion agreement with Tiss
´
eo Collectivit
´
es. The authors
thank Tiss
´
eo Collectivit
´
es for having sharing the used
data and their support.
REFERENCES
ADEME (2023). Share of public transport in total passenger
traffic. https://www.odyssee-mure.eu/publications/
efficiency-by-sector/transport/public-transport.html.
Consulted on 2024-01-08.
Alsger, A., Assemi, B., Mesbah, M., and Ferreira, L.
(2016). Validating and improving public transport ori-
gin–destination estimation algorithm using smart card
fare data. Transportation Research Part C: Emerging
Technologies, 68:490–506.
Boulange, C., Gunn, L., Giles-Corti, B., Mavoa, S., Pet-
tit, C., and Badland, H. (2017). Examining associ-
ations between urban design attributes and transport
mode choice for walking, cycling, public transport
and private motor vehicle trips. Journal of transport
& health, 6:155–166.
Cui, A. (2006). Bus passenger origin-destination matrix
estimation using automated data collection systems.
PhD Thesis, Massachusetts Institute of Technology.
Daraio, C., Diana, M., Di Costa, F., Leporelli, C., Mat-
teucci, G., and Nastasi, A. (2016). Efficiency and ef-
fectiveness in the urban public transport sector: A crit-
ical review with directions for future research. Euro-
pean Journal of Operational Research, 248(1):1–20.
Dickens, M. (2023). Public transportation fact book.
https://www.apta.com/wp-content/uploads/APTA-
2022-Public-Transportation-Fact-Book.pdf. Con-
sulted on 2024-01-08.
El Mahrsi, M., C
ˆ
ome, E., Baro, J., and Oukhellou, L.
(2014). Understanding Passenger Patterns in Pub-
lic Transit Through Smart Card and Socioeconomic
Data: A case study in Rennes, France.
Feng, J., Li, Y., Zhang, C., Sun, F., Meng, F., Guo, A., and
Jin, D. (2018). DeepMove: Predicting Human Mo-
bility with Attentional Recurrent Networks. In Pro-
ceedings of the 2018 World Wide Web Conference,
WWW ’18, pages 1459–1468, Republic and Can-
ton of Geneva, CHE. International World Wide Web
Conferences Steering Committee. event-place: Lyon,
France.
Ge, Q. and Fukuda, D. (2016). Updating origin–destination
matrices with aggregated data of GPS traces. Trans-
portation Research Part C: Emerging Technologies,
69:291–312.
Hora, J., Dias, T. G., Camanho, A., and Sobral, T. (2017).
Estimation of Origin-Destination matrices under Au-
tomatic Fare Collection: the case study of Porto trans-
portation system. Transportation Research Procedia,
27:664–671.
Hrelja, R., Khan, J., and Pettersson, F. (2020). How to cre-
ate efficient public transport systems? a systematic re-
view of critical problems and approaches for address-
ing the problems. Transport Policy, 98:186–196.
Huang, D., Yu, J., Shen, S., Li, Z., Zhao, L., and Gong,
C. (2020). A Method for Bus OD Matrix Estimation
Using Multisource Data. Journal of Advanced Trans-
portation, 2020:5740521.
Hussain, E., Bhaskar, A., and Chung, E. (2021). Transit od
matrix estimation using smartcard data: Recent de-
velopments and future research challenges. Trans-
portation Research Part C: Emerging Technologies,
125:103044.
INFRAS (2023). Hbefa. https://www.hbefa.net/en/
software#online-version. Consulted on 2024-01-08.
Ji, Y., Cao, Y., Liu, Y., Guo, W., and Gao, L. (2019).
Research on classification and influencing factors of
metro commuting patterns by combining smart card
data and household travel survey data. IET Intelligent
Transport Systems, 13(10):1525–1532.
Kehoe, O. d. (2004). Effects of bus stop consolidation on
transit speed and reliability: A test case. Master of
Science), University of Washington.
Li, W. (2016). Modelling bike-sharing choice in a develop-
ing country with a focus on the impacts of air pollu-
tion and weather conditions. In General Proceedings
of the 14th World Conference on Transport Research,
volume 14. World Conference on Transport Research
Society (WCTRS).
MinisterForEcology (2019). Se d
´
eplacer en
voiture. https://www.statistiques.developpement-
durable.gouv.fr/se-deplacer-en-voiture-seul-
plusieurs-ou-en-covoiturage-0. Consulted on
2024-01-08.
VEHITS 2024 - 10th International Conference on Vehicle Technology and Intelligent Transport Systems
376

MinisterForEcology (2022). Chiffre clef des transports.
https://www.statistiques.developpement-durable.
gouv.fr/chiffres-cles-des-transports-edition-2022.
Consulted on 2024-01-08.
Osorio, C. and Punzo, V. (2019). Efficient calibration
of microscopic car-following models for large-scale
stochastic network simulators. Transportation Re-
search Part B: Methodological, 119:156–173.
Reck, D. J., Martin, H., and Axhausen, K. W. (2022). Mode
choice, substitution patterns and environmental im-
pacts of shared and personal micro-mobility. Trans-
portation Research Part D: Transport and Environ-
ment, 102:103134.
Stewart, C. and El-Geneidy, A. (2016). Don’t stop just yet!
a simple, effective, and socially responsible approach
to bus-stop consolidation. Public Transport, 8:1–23.
Sudhir Gota, C. H. (2023). Asian transport outlook.
https://asiantransportoutlook.com/documents/11/
Asian Transport 2030 Outlook Nov 2022.pdf.
Consulted on 2024-01-08.
Tiss
´
eo (2023). Plan tiss
´
eo. https://www.tisseo.fr/se-
deplacer/plans. Consulted on 2024-01-08.
UTP (2022). Observatoire de la mobilit
´
e 2022.
https://www.utp.fr/system/files/2022-11/
20220927 dp observatoire de la mobilite v2.0.pdf.
Consulted on 2024-01-08.
Wang, W., Attanucci, J. P., and Wilson, N. H. M. (2011).
Bus Passenger Origin-Destination Estimation and Re-
lated Analyses Using Automated Data Collection Sys-
tems. Journal of Public Transportation, 14(4):131–
150.
Bus Routing Optimisation: A Case Study for the Toulouse Metropolitan Area
377
