
The Contribution of Drones to the Monitoring of Rubble-Mound
Breakwaters
Maria Henriques
1a
, Rui Capitão
1b
, Conceição Fortes
1c
, Rute Lemos
1d
, Luís Gabriel Silva
1
,
Hugo Silva
1
and Rúben Gonçalves
2
1
National Laboratory for Civil Engineering (LNEC), Lisbon, Portugal
2
APS - Ports of Sines and the Algarve Authority, Sines, Portugal
Keywords: Drone, Breakwater, Monitoring, Sines.
Abstract: Breakwaters are built to promote sheltered areas, for people, ships, and harbour activities. In the design of
rubble-mound breakwaters, a common type of breakwater in many countries, including Portugal, it is assumed
that damage may occur in certain stretches of the structures, and therefore maintenance and repair works will
be quite certainly needed. To successfully carry out these interventions, in a timely and cost-effective manner,
the structures must be observed and monitored systematically. This enables one to follow their structural
behaviour and, through diagnosis analysis, to specify the most suitable timespan to undertake any necessary
intervention. The severity of the sea on the Portuguese coasts justified the establishment, by the National
Laboratory for Civil Engineering (LNEC), of a program of Systematic Observation of Maritime Works
(OSOM) which, in 2018, was improved with the introduction of drones to monitor the structural present
condition, evolution condition and risk condition of the structures, namely movements and falls of blocks in
the armour layers. This communication presents some results of the application of OSOM+ program on
breakwaters in Sines and Algarve (Faro-Olhão and Portimão) harbours, an activity that LNEC has developed
for the APS – Ports of Sines and the Algarve Authority.
1 INTRODUCTION
In 1986, the National Laboratory for Civil
Engineering (LNEC) started developing a
programme for Systematic Observation of Maritime
Works (OSOM) to monitor the behaviour of
rubble-mound breakwaters along the Portuguese west
and south coasts and recommend timely interventions
for their maintenance and/or repair. This maintenance
and/or repair works should be carried out at an early
stage following the acknowledgment of problems, at
the time these might likely affect a small area and
therefore repairs are simpler and less expensive.
The OSOM methodology is based on a series of
systematic visual observation campaigns that provide
the necessary information to feed the ANOSOM
database (Reis et al., 1995; Lemos et al., 2007),
which is meant to characterize the Present Condition,
a
https://orcid.org/0000-0001-8982-3967
b
https://orcid.org/0000-0003-3915-9951
c
https://orcid.org/0000-0002-5503-7527
d
https://orcid.org/0000-0003-0380-391X
the Evolution Condition, and the Risk Condition of
the observed maritime structures.
Since the 2010’s the OSOM programme has been
improved and, in 2017, when drone monitoring
started to be used in breakwaters, the programme
changed its name to OSOM (Capitão et al., 2018).
The use of drones improved the monitoring because
it provides detailed and more accurate information on
the condition of the structures, and made it possible
to quantify changes of settlements, volumes, etc..
This paper presents the expertise of LNEC in the
monitoring of rubble-mound breakwaters using
drones. Most of the situations presented here were
obtained in the breakwaters of Sines (Figure 1 and
Figure 2) and Algarve (Faro-Olhão inlet and
Portimão, Figure 3 and Figure 4), in an activity that
LNEC is providing for APS – Ports of Sines and the
Algarve Authority – since 2018 (Capitão et al., 2022).
160
Henriques, M., Capitão, R., Fortes, C., Lemos, R., Silva, L., Silva, H. and Gonçalves, R.
The Contribution of Drones to the Monitoring of Rubble-Mound Breakwaters.
DOI: 10.5220/0012691200003696
Paper published under CC license (CC BY-NC-ND 4.0)
In Proceedings of the 10th International Conference on Geographical Information Systems Theory, Applications and Management (GISTAM 2024), pages 160-167
ISBN: 978-989-758-694-1; ISSN: 2184-500X
Proceedings Copyright © 2024 by SCITEPRESS – Science and Technology Publications, Lda.
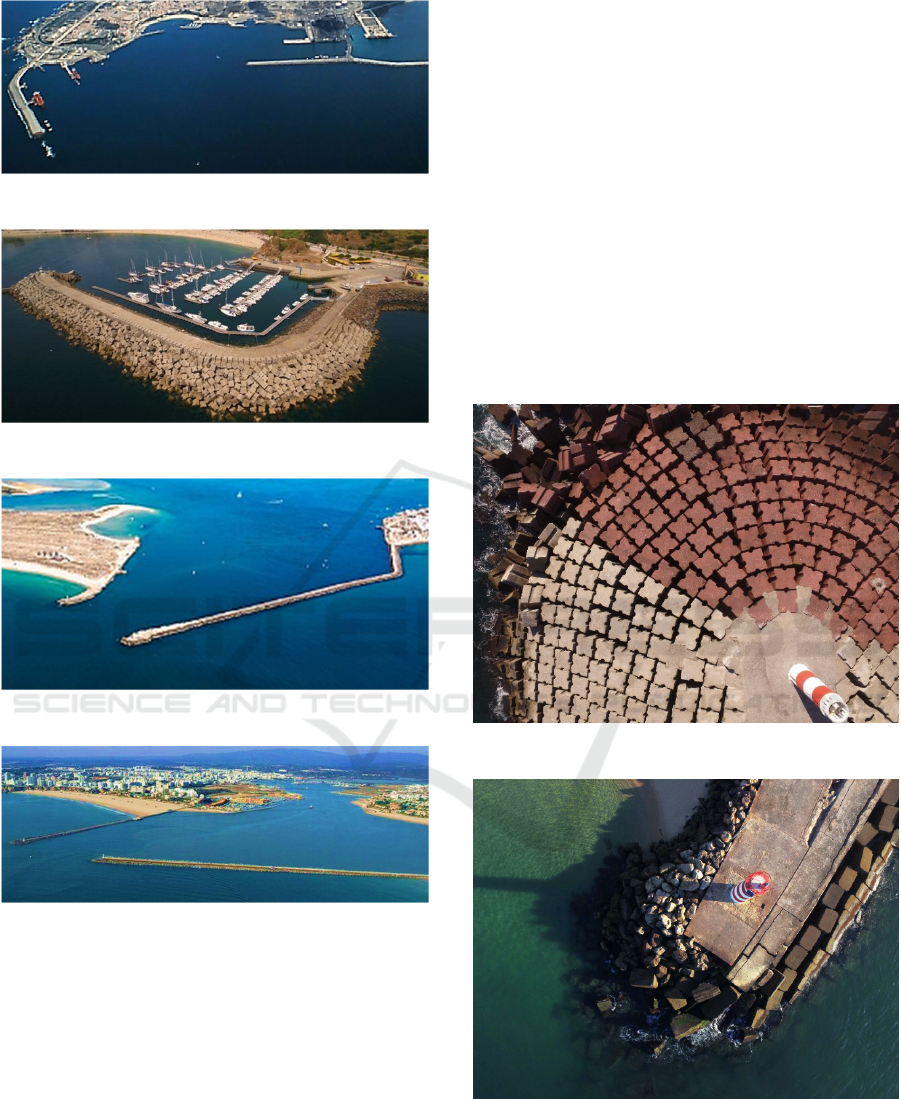
Figure 1: Breakwaters of the port of Sines.
Figure 2: Breakwater of the leisure port of Sines.
Figure 3: Breakwaters of Faro-Olhão inlet.
Figure 4: Breakwaters of the port of Portimão.
2 THE BREAKWATERS
The three ports managed by APS – Sines, Faro and
Portimão – have several breakwaters, all
rubble-mound breakwaters (Figure 5 and Figure 6,
photos taken by one of LNEC's drones). Sines has a
total of six breakwaters (one of these, the less
exposed, is not monitored); Faro-Olhão inlet and
Portimão harbour have two breakwaters each. All the
breakwaters of Sines were constructed to protect
several infrastructures that exist in the area: five
terminals (liquid bulk, petrochemical, dry bulk,
liquified natural gas and containers), a logistic
activity zone, the fishing harbour, and the leisure port.
In Algarve, on the Faro-Olhão area, the construction
of the breakwaters in the 1930’s created a channel that
allowed the development of several ports, while in
Portimão the breakwaters were built at the mouth of
a river to ensure protection at its entrance.
These rubble-mound breakwaters consist of a core
of finer material covered by large blocks forming the
so-called armour layer. The blocks are of rock being
that in areas more exposed the armour layer blocks
are in made concrete in several shapes (tetrapod,
Antifer, or parallelepiped). The superstructures of the
breakwaters are also made in concrete. Some
breakwaters have public access, while others are in
(very) restricted non-public access areas.
Figure 5: The head of Sines west breakwater.
Figure 6: The head of Faro-Olhão inlet west breakwater.
The Contribution of Drones to the Monitoring of Rubble-Mound Breakwaters
161

3 OSOM PROGRAMME
The OSOM – Systematic Observation of Maritime
Works – programme has been developed by LNEC to
help the owners of breakwaters and other maritime
structures.
The objective of this programme is to monitor the
behaviour of these structures and recommend timely
interventions for their maintenance and/or repair. The
OSOM methodology is based on a series of systematic
visual observation campaigns complemented with data
from drone photogrammetric surveys. All the data
provide the necessary information to feed the
ANOSOM database (Maia et al., 2017), which is
meant to characterize the Present Condition, the
Evolution Condition, and the Risk Condition of the
structures. Based on this information, it is then
possible to establish when, where and under what
circumstances maintenance or repair works should be
carried out.
More recently, ANOSOM-WEB interface app
was developed, a web mapping platform accessible
by any device (smartphone, tablet, or PC) equipped
with web connection. During visual observation
campaigns, this app allows the observer to carry out,
on a mobile device, various operations such as, as
examples, consultation of information from previous
campaigns (Figure 7) and accessing, in situ, the
current, evolution and risk conditions of the structure,
and whether the structure needs immediate repair or
maintenance works.
Figure 7: Interface ANOSOM-WEB – Breakwater Sines
west.
4 THE DRONES AND THE
FLIGHTS
The first surveys with the drone (2017), used a DJI
Inspire V1 and a camera Zenmuse X3; since June
2022, it has been used a DJI Matrice 300 RTK and a
camera Zenmuse H20 (
Figure 8
and
Figure 9
). Due to
the use of this drone with RTK, the security of the
landing was improved, especially with mild to strong
winds (up to 54 km/h). Both cameras have sensors
CMOS, the first one with 12.4 MP, the second with
20 MP. At an altitude of 100 m, a pixel in a
photograph taken by the X3 covers about 5 cm
2
, with
the H20 3.4 cm
2
. H20 camera has zoom capabilities.
Before 2020, the breakwaters were fully surveyed,
e.g., the flights covered an area comprising from the
head to root of the breakwaters, always avoiding
flight over pipes of gas or of liquid petrochemical
products. After 2020, due to the European legislation,
in some breakwaters the covered area was reduced to
keep flights more than 150 m away from buildings.
This rule led to some limitations on the image
acquisitions, leading that the seaside armour layer of
one of the breakwaters has been only covered with
oblique photos, with the drone flying over the sea.
Figure 10 presents the two flight plans made over this
breakwater, where the area shaded in blue is the
photographed area, and the green line represents the
flight path. The left image in the Figure 10 shows the
flight path over the head of the breakwater (nadir
photos), while the right image shows the flight path
over the sea (oblique photos).
Until now the RTK was used only with navigation
proposes; in a near future the data collected will be
integrated in the processing, to reduce the number of
ground control points (GCP) needed. Concerning the
information needed for processing the aerial images,
it is mandatory to have GCP (Figure 11) marked on
the surface of the breakwaters, and clearly visible in
photographs. The points have been coordinated with
GNSS (Henriques et al., 2014).
For the necessary flight permissions, relevant
national entities were contacted beforehand. These
include the National Aeronautical Authority and
Local Port Authorities (these are compulsory),
relevant Aerodrome and Heliport Authorities, and the
Institute for Nature and Forest Conservation,
depending on the breakwater locations.
Five days before the survey, national weather
forecast sources were checked (Henriques et al.,
2022). Rain, wind velocity and wind gust velocities
were verified, although wind gust information was
scarcely found.
GISTAM 2024 - 10th International Conference on Geographical Information Systems Theory, Applications and Management
162
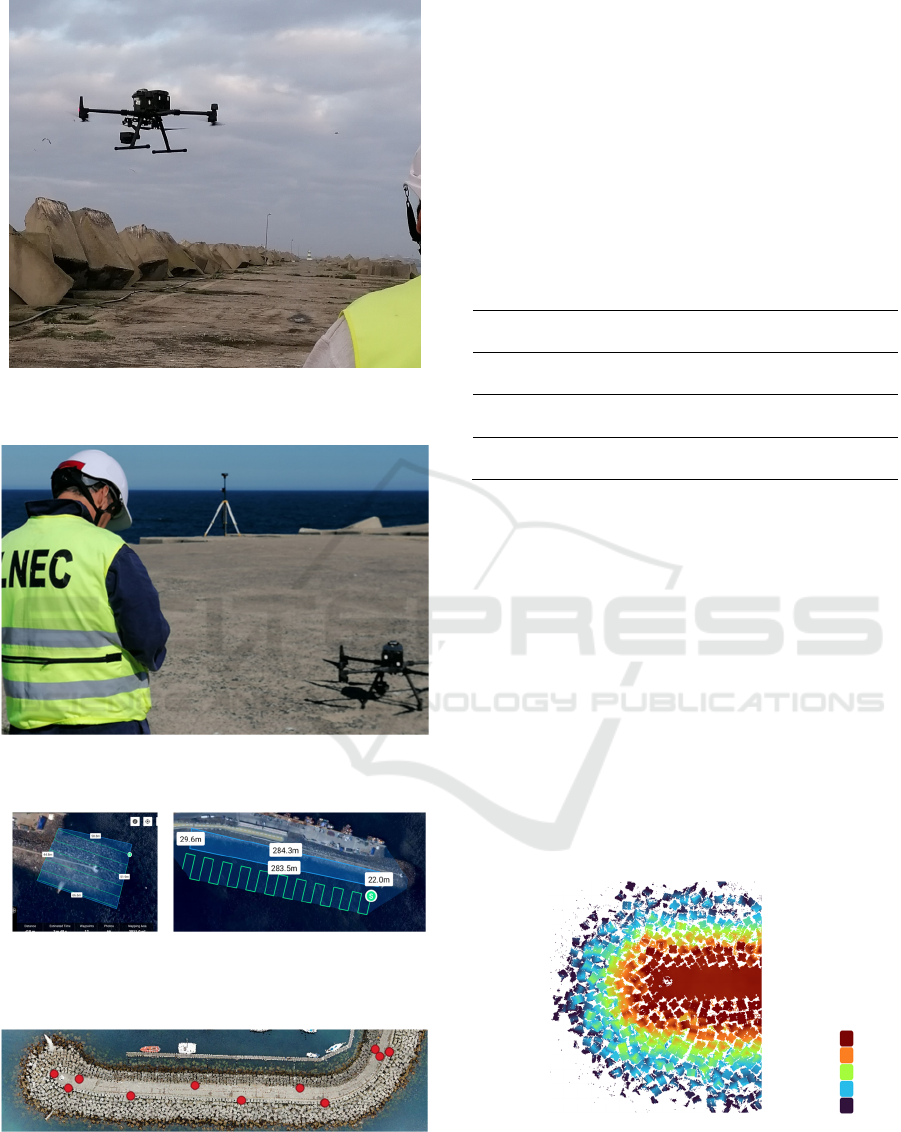
Figure 8: DJI Matrice 300 RTK drone while taking off
Sines east breakwater.
Figure 9: Preparing the flight on Sines west breakwater.
Shown on top is the RTK GNSS antenna base.
Figure 10: Flight plans over the fishing harbour breakwater
at Sines. Left: head – vertical photos; Right: sea face –
oblique photos.
Figure 11: Location of GCP in the leisure port of Sines
breakwater.
The flights have the following parameters: altitude
of the flight: or 30 m or 40 m (depending on the length
of the breakwater or local conditions); overlap 80%
(both longitudinal and transversal). The flights are
always autonomous (i.e. the missions are planned and
upload to the drone before the flight) and made during
low tides to maximize the area exposed. In Table 1 it is
presented some data related to the flights in three
breakwaters in Sines (the shortest, and the two
longest). The pixel size of the orthomosaics produced
is, in the three cases, 1.4 cm.
Table 1: Data concerning three drone surveys at Sines.
BW
Length
Width
N.º
fli
g
hts
Duration
fli
g
hts
N.º
p
hotos
Leisure
250 m
30 m
1 12 min 178
East North
Sec.
1000 m
55 m
2 56 min 982
West
1500 m
65 m
3 74 min 1092
5 DATA PROCESSING
Detection of changes in a rubble-mound breakwater
armour layer is normally done by comparing the
digital surface models (DSM) from two surveys
performed at different dates.
To obtain it, following processing steps are used,
in this order, and for each breakwater: point cloud
computation, DSM creation (Figure 12). After the
orthomosaic is generated (Figure 13).
It has been used Agisoft Metashape Pro software.
Processing parameters used: i) Photo alignment
quality: high; ii) Dense cloud quality: high; iii) Depth
filtering intensity: mild.
10 m
0 m
Figure 12: DSM (matrix form) of the head of Sines east
breakwater.
The Contribution of Drones to the Monitoring of Rubble-Mound Breakwaters
163
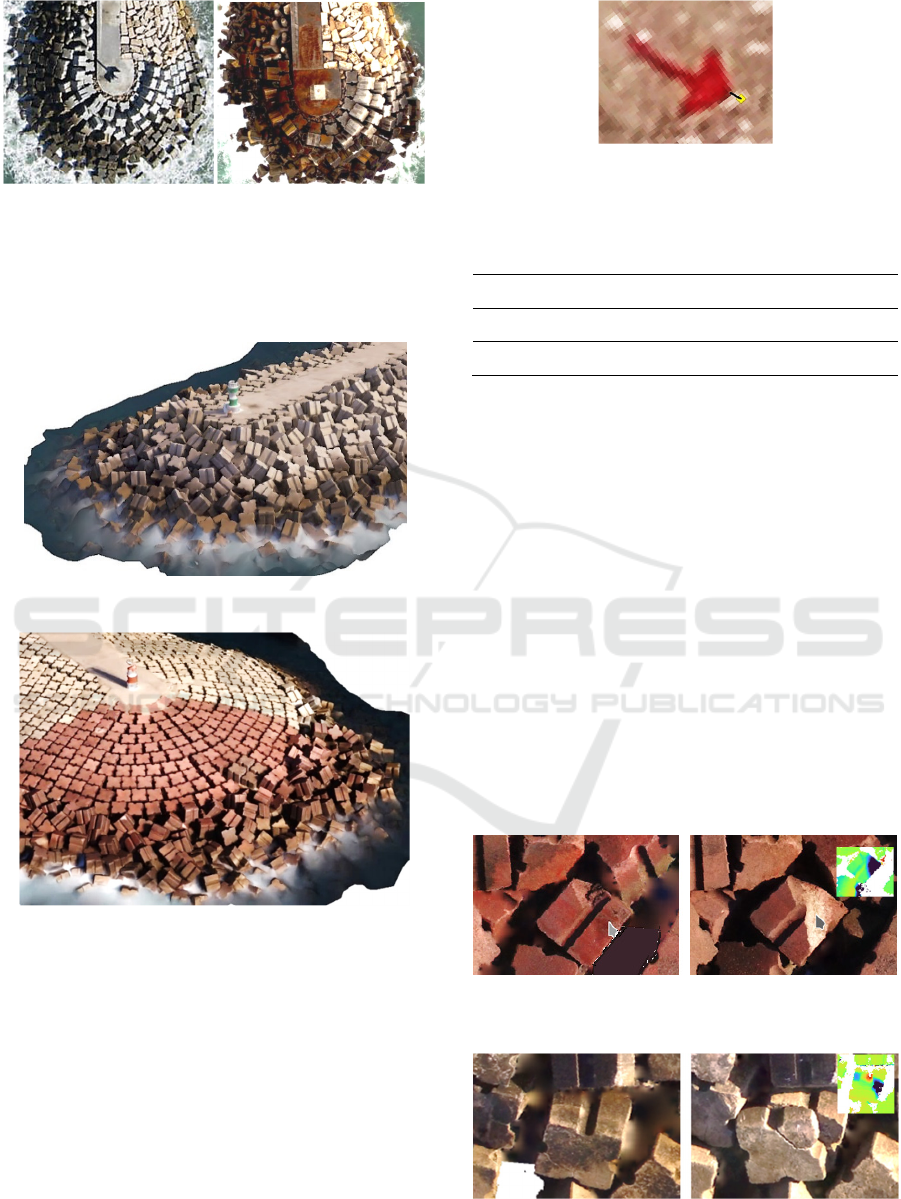
Figure 13: Head of Ericeira breakwater. Two orthomosaic
extracts with five years of difference are shown.
For presentation purposes, in reports, DSM are
sometimes generated in the form of a mesh (Figure 14
and Figure 15).
Figure 14: Mesh of the head of Sines east breakwater.
Figure 15: Mesh of the head of Sines west breakwater.
It was determined the planimetric and altimetric
RMSE (Root Mean Squared Error, see Table 2) for
some breakwaters using the equations presented by
FGDC (1998). Here it is presented the values obtained
in Sines east north section breakwater, in 2020. The
data used is the horizontal distance between a point
coordinated and its image in the orthomosaic (
Figure
16
), and the vertical distance between this point and
the point cloud. In the table are included the results
obtained for the check points (points materialized like
the GCP, used to assess the accuracy of procedures).
Figure 16: Point coordinated (in yellow), its image in the
orthomosaic and vector between both (its length is the
planimetric distance used).
Table 2: RMSE Sines east north section breakwater.
Planimetric Altimetric N.ºPoints
Check Points 2.3 cm 2.5 cm 36
Ground Control Points 1.9 cm 2.0 cm 20
6 ANALYSES OF DATA
Since 2018, only few movements of blocks were
detected and even those were non-significant. Some
cases are presented here.
As stated before, geometric changes in the armour
layer were detected through the analysis of the DSM:
by computing the difference between two DSM
outputs one can notice if there are changes. QGIS
software is used for this task. In reports, the
presentation of significant changes is accompanied by
extracts from orthomosaics to present the evolution.
This is the case of Figure 17 to
Figure 20
, that show
extracts of orthomosaics and DSM that illustrate
some of the detected changes. Differences between
DSM are illustrated in colour to clearly identify
relevant evolution.
Figure 17: A block became more eroded in a period of two
years.
Figure 18: A block that broke.
GISTAM 2024 - 10th International Conference on Geographical Information Systems Theory, Applications and Management
164
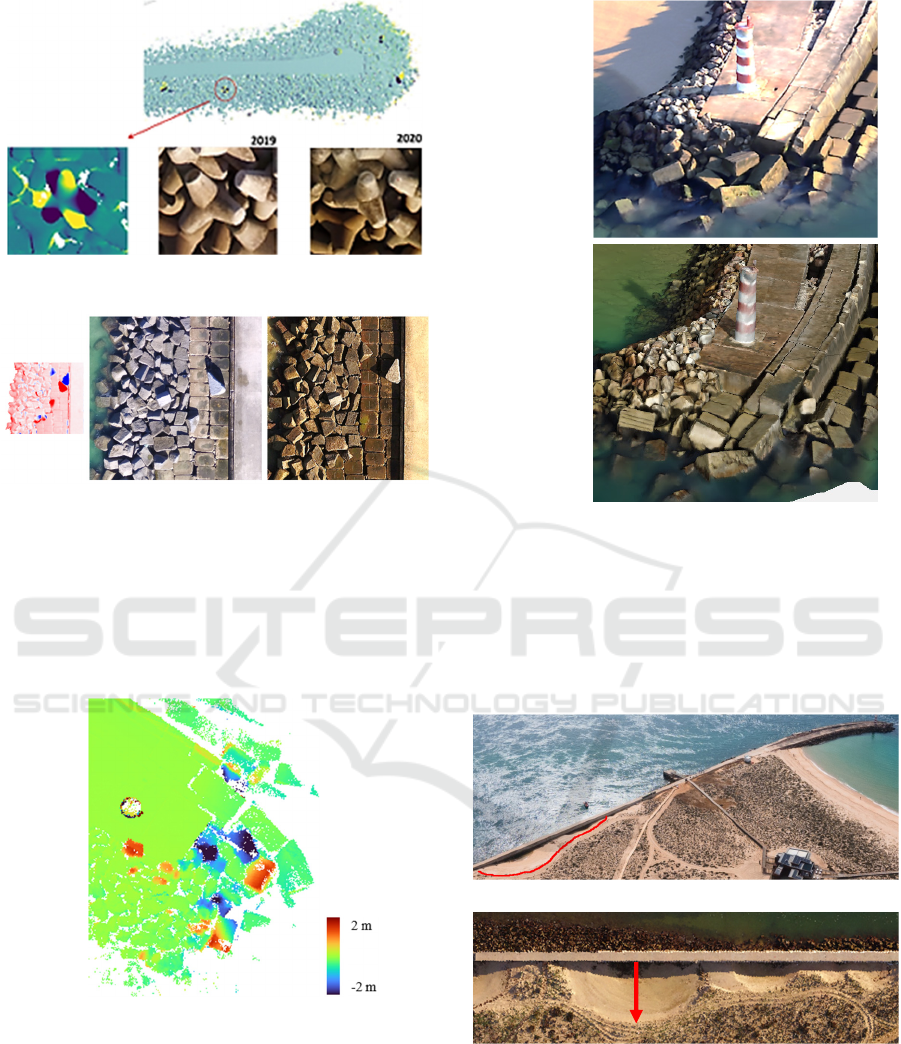
Figure 19: A tetrapod that rotated.
Figure 20: Displacements of blocks.
Figure 21
presents the comparison of DSM of the
head of
Faro-Olhão west breakwater (2023-2018) and
Figure 22 presents the two meshes produced by Metashape
where one can easily see
the changes in the position of
the blocks and verify that the concrete structure of the
crest is less protected.
Figure 21: Block movements in the Faro-Olhão west
breakwater between 2018 and 2023 detected by DSM
comparison.
2018
2023
Figure 22: Meshes of Faro-Olhão west breakwater show the
movements of the blocks.
Figure 23 shows the aerial photo and the orthomosaic
at the Faro-Olhão inlet west breakwater. There, it can
be seen the quite apparent (and, lately, quantified)
erosion of sand in the northern area, on the land side,
leaving the foundation of the breakwater exposed.
←
north south
→
Figure 23: Faro-Olhão inlet west breakwater (aerial photo
and orthomosaic). Indication of the area analysed situated
on the north side. The red arrow shows the beginning and
direction of the X axis of the graph of Figure 25.
Figure 24 shows DSM outputs from different dates.
Figure 25
shows the profile drawn at the deepest
location. The direction of the X axis is presented in
Figure 23
.
The Contribution of Drones to the Monitoring of Rubble-Mound Breakwaters
165
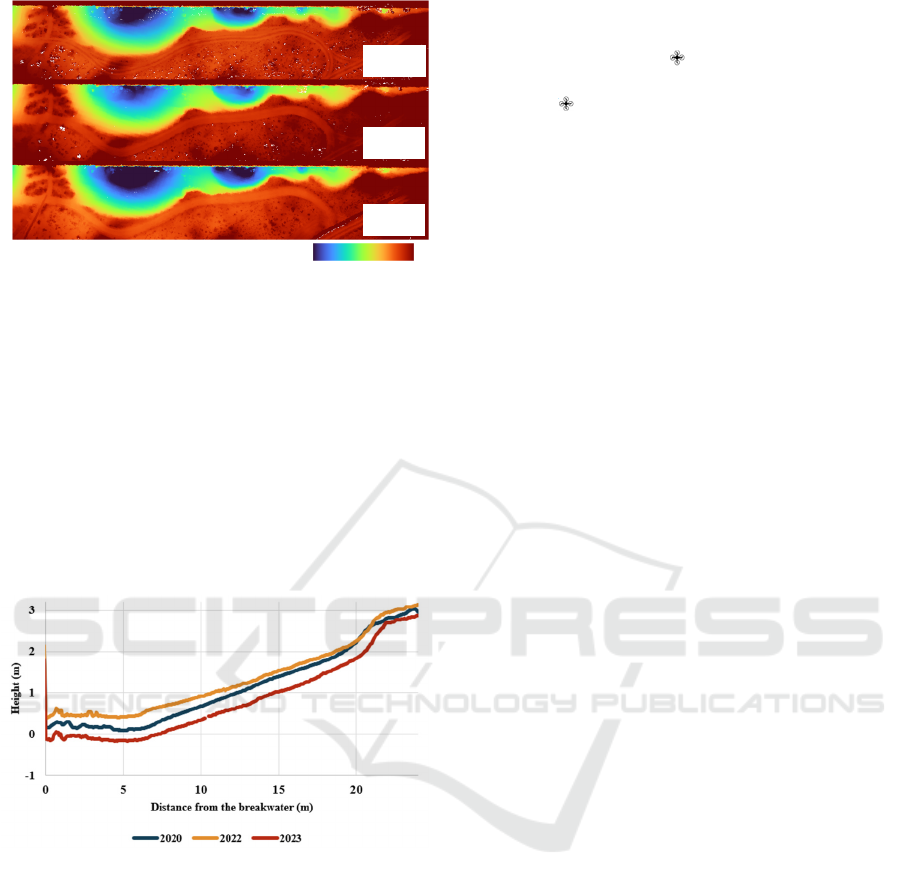
0m 3m
Figure 24: DSM of the area analysed in three years and
colour scale.
Examination of the historical images available on
Google Earth revealed that, in 2006, this problem
already existed, although in a much smaller extent. As
only planimetric information exists, the only values
that can be obtained are distances. It was found that
in 2006 the largest depression had an opening of 6 m.
This area increased until it was clear, from the 2013
image, that, the depression stabilized. In 2023, the
opening was 22 m, according to the DSM, as can be
seen in
Figure 25
.
Figure 25: Profiles, starting from de breakwater, in the
direction of land calculated in the lowest area.
The analyses presented in this paper were based
on products fully generated by LNEC. There is other
information, collected in previous years, which exists
in the archives of APS or in the National Geographic
Information System (orthophotos and DSM) whose
analysis has been included in reports present to APS.
7 CONCLUSIONS
The paper presents the contribution of the aerial
photogrammetric surveys made with the help of
drones to the monitoring of rubble-mound
breakwaters. The information generated from the
photographs, especially DSM and orthomosaics,
contribute to better quantify evolution of observed
structures under OSOM - Systematic Observation
of Maritime Works programme.
OSOM , which initially was primarily based on
qualitative analyses, can now also include additional
quantitative analysis, and detect very small changes,
in the order of a few centimetres, in the structures,
considering the currently attainable quality of the
surveys and, consequently, of the generated products.
This paper focused on the use of surveys to
monitor already existing maritime structures, but the
photo surveys can also have other uses. For example,
by evaluating whether the geometry of the structure
matches its design (Henriques, 2016 and Henriques et
al., 2017), which is especially useful during
construction or repairs of the structure.
Between 2018 and 2023, the changes in the
breakwaters of APS were small. The need to quantify
these changes in the form of volumes, something
simple to do when there are point clouds, was not
considered important. For this reason, this data has
not been included in the reports prepared for the APS
although it was computed to be included in papers
(Henriques, 2016 and Henriques et al., 2016).
In the processing phase, to include drone
coordinates obtained by RTK will reduce the number
of GCP needed. This is an important step to be taken
very soon. Regarding the improvement in the quality
of results that would result from using more complex
flight plans, such as those in the form of grids, or
complementary flights with a camera in an oblique
direction, it is necessary to point out that the time
available for carrying out flights is reduced because
these must be done during low tides. The
improvement in quality of the results is not so
relevant as to justify these procedures.
Concerning the detection of the movements of the
blocks, there are interesting approaches. More complex
analysis of the data produced (like the ones presented
by Soares et al., 2017 and 2022, or Arza-García et al.,
2024) are still academic advances which should evolve
into procedures to be applied in production work (such
as the one presented in this paper). As pointed out,
there were no damages in APS breakwaters during the
period 2018-2023 so there was not the need to more
complete analysis of the breakwaters, as the one
presented by Florio et all. (2024). There is an area in
which research is really needed which is the detection
of the movements of submerged blocks. This research
may need to include the development of equipment.
For instance, Sakamoto et al. (2024) present the
results and limitations of the use of a green laser
scanner in shallow waters.
2020
2022
2023
GISTAM 2024 - 10th International Conference on Geographical Information Systems Theory, Applications and Management
166

ACKNOWLEDGEMENTS
The work has received funding through LNEC
research projects “Digital images for support of civil
engineering studies – DICE” and “Risk and Safety in
Ports and Maritime Structures”.
REFERENCES
Arza-García, M., Gonçalves, J.A., Ferreira Pinto, V.,
Bastos, G. (2024). On-Site Stability Assessment of
Rubble Mound Breakwaters Using Unmanned Aerial
Vehicle-Based Photogrammetry and Random Sample
Consensus. Remote Sensing 2024, 16, 331.
https://doi.org/10.3390/rs16020331
Capitão, R., Lemos, R., Henriques, M.J., Fortes, C.J.E.M.,
Neves, M.G., Silva, L.G. & Reis, M.T. (2018).
Systematic observation of maritime works. The new
OSOM+. In Proc. 5as Jornadas de Engenharia
Hidrográfica, Instituto Hidrográfico.
Capitão, R., Fortes, C.J.E.M., Lemos, R., Silva, L.G.,
Neves, M.G., Henriques, M.J., Martins, T. (2022).
OSOM+: Aplicação às estruturas marítimo-portuárias
do porto de Sines. In 10
as
Jornadas de Engenharia
Costeira e Portuária, PIANC.
FGFC (1998). Geospatial Positioning Accuracy Standards.
Part 3: National Standard for Spatial Data Accuracy.
Federal Geographic Data Committee,
FGDC−STD−007.3−1998.
Florio, A., Di Luccio, D., Robustelli, U., Cutugno, M.,
Pugliano, G., Benassai, G. (2024). UAV close-range
photogrammetry for breakwater damage assessment in
a Tyrrhenian coastal site. Coastal Engineering Journal.
https://doi.org/10.1080/21664250.2024.2308388
Henriques, M.J., Fonseca, A., Roque, D., Lima, J.N. &
Marnoto, J. (2014). Assessing the quality of a UAV-
based orthomosaic and surface model of a breakwater.
In FIG Congress 2014, International Federation of
Surveyors.
Henriques, M.J. (2016). Surveillance par drone des digues
à talus. Revue XYZ n. 148, Association francophone de
topographie.
Henriques, M.J., Roque, D., Santos, A.V. (2016).
Monitorização de quebra-mares com veículos aéreos
não tripulados. In I Seminário Internacional UAV,
Universidade Nova de Lisboa.
Henriques, M.J., Lemos, R., Capitão, R., Fortes, C.J.E.M.
(2017). The monitoring of rubble-mound breakwaters.
An assessment of UAV technology. In INGEO2017, the
7
th
International Conference on Engineering Surveying,
Slovak University of Technology & LNEC.
Henriques, M. J., Roque, D. (2022). Planning UAV
surveys: can we rely on wind forecasts? In 5
th
Joint
International Symposium on Deformation Monitoring
(JISDM 2022), Universitat Politècnica de València.
Lemos, R., Santos, J.A. (2007). ANOSOM. Análise da
observação sistemática de obras marítimas. In 5
as
Jornadas Portuguesas de Engenharia Costeira e
Portuária, PIANC.
Maia, A., Rodrigues, A, Lemos, R., Capitão, R., Fortes,
C.J.E.M. (2017). A Web platform for the systematic
monitoring of coastal structures. In GISTAM 2017,
SCITEPRESS.
Reis, M.T., Silva, L.G (1995). Systematic Observation of
Maritime Works. ANOSOM Database: User’s Manual.
Report NPP, LNEC.
Sakamoto, N. and Nishiyama, S. (2024). 3D monitoring of
coastal erosion control structures using UAV. The
International Archives of the Photogrammetry, Remote
Sensing and Spatial Information Sciences, Vol.
XLVIII-4/W9-2024, https://doi.org/10.5194/isprs-
archives-XLVIII-4-W9-2024-313-2024
Soares, F., Barbon, V. (2023). Image segmentation of
breakwater blocks by edge-base Hough transformation.
Journal of Applied Geodesy, 17(2), 131-137.
https://doi.org/10.1515/jag-2022-0044
Soares, F., Henriques, M.J., Rocha, C. (2017). Concrete
Block Tracking in Breakwater Models. In FIG Working
Week 2017.
The Contribution of Drones to the Monitoring of Rubble-Mound Breakwaters
167
