
Introducing Scaled Model Development to on-Sight Automatic Train
Operation
Tobias Hofmeier
1,2
and Martin Cichon
2
1
Institute of Vehicle Technology, Nuremberg Institute of Technology, Keßlerplatz 12, Nuremberg, Germany
2
Institute of Vehicle System Technology, Karlsruhe Institute of Technology, Rintheimer Querallee 2, Karlsruhe, Germany
Keywords: Automatic Train Operation, ATO, Scaled Model, Scaled Development, Scaled Technology, Scaled Testing.
Abstract: Rail systems are often not an economic option in terms of flexibility and cost in intermodal competition. To
address this issue, there is a push towards implementing automation and digitalization components. In recent
years, there has been a strong focus on on-sight automated train operation systems. As the applications move
beyond protected areas such as metro systems, to complex on-sight driving scenarios, the demands on system
development, verification, and validation increase. Methods from the automotive industry are well known for
overcoming these challenges with virtual development and final field testing. Fundamentally different
operating conditions prevent sufficient field testing, as rail infrastructure and vehicles are difficult to procure
for development and testing purposes. In science and research, scaled models are being promoted for similar
problems. These models allow for simulations to be verified and favorable estimates to be made. This paper
demonstrates the possibility of using scaled model methods for the development of on-sight automatic train
operation (ATO) functions. A demonstrator of a highly automated shunting locomotive is being built as a
scaled model and equipped with sensors for environment detection and localization as well as communication
interfaces. The feasibility of ATO functions in the scaled model is demonstrated using defined use cases.
1 INTRODUCTION
The climate policy framework for the coming decades
requires a shift in traffic volumes from road transport
to more environmentally friendly alternatives, with
rail being one of the preferred solutions (Kaack et al.,
2018).
In order to create a competitive rail-based
alternative to road transport, it is necessary to analyze
the existing disadvantages of rail transport in
passenger and freight transport.
According to (Trepáčová et al., 2020) the
common disadvantages of passenger rail transport are
crowding; organization of the rail system; financial
cost; low number of trains; delays; train route,
boarding and exiting the train as well as luggage
transportation and safety issues.
In rail freight transport, a fundamental distinction
must be made between full train and single
wagonload transport. In full train transport, large
quantities of general cargo or bulk goods are
predominantly transported with the same origin and
destination, whereas in single wagonload transport,
trains with different load types, origins and
destinations of each wagon are transported. The more
flexible single wagon load transport competes with
road transport. Disadvantages against road transport
are less flexibility on the last mile, poor predictability
and high costs. The costs for the shunting process
account for a significant proportion of the total costs
of single wagonload transport, without any direct
value added (Guglielminetti et al., 2015).
Consequently, shunting processes offer potential
for optimizing rail freight transport.
Automation and digitalization are seen as driving
factors for increasing predictability, which has a
positive impact on both passenger and freight
transport and secondarily increases economic
efficiency and performance of railway systems
(Pourian, 2023), (European Union, 2019).
Based on this expectation, several automation
projects in passenger and freight transport have
already been successfully implemented. As
automated railway systems become more widespread,
these systems also need to be developed for use in
critical environments. Current methods do not
guarantee sufficient testing and development
possibilities to reliably bring systems to market
378
Hofmeier, T. and Cichon, M.
Introducing Scaled Model Development to on-Sight Automatic Train Operation.
DOI: 10.5220/0012691500003702
Paper published under CC license (CC BY-NC-ND 4.0)
In Proceedings of the 10th International Conference on Vehicle Technology and Intelligent Transport Systems (VEHITS 2024), pages 378-385
ISBN: 978-989-758-703-0; ISSN: 2184-495X
Proceedings Copyright © 2024 by SCITEPRESS – Science and Technology Publications, Lda.

maturity. The following paper presents the potential
of scaled models for the problems involved in the
development of on-sight automatic train operation
(ATO) functions.
2 AUTOMATIC TRAIN
OPERATION
As already mentioned, several automation projects
are already successfully in operation. The grade of
automation (GoA) is defined in (IEC, 2006) and
describes the ascending takeover of tasks by an
automated system, ranging from on-sight driving
operation GoA0 to unattended operation GoA4.
To examine the influence on systems currently under
development, the operating conditions of some
example systems are described below.
The first GoA4 system was already in use in Kobe,
Japan in 1981 (Powell et al., 2016) and represents a
sealed off system. Subsequently, the underground
railways in European cities became increasingly
automated. Another milestone was the launch of the
U2 and U3 underground lines in Nuremberg, which
was the first to ensure mixed operation with
automated and non-automated lines since 2008
(Zasiadko, 2019). The closed and mostly intersection-
free system, with few clearly defined interfaces to the
outside world, means that subways can be automated
simply by monitoring the infrastructure at critical
locations.
A further step in the automation of rail vehicles is
the S-Bahn in Hamburg, where ATO over European
Train Control System (ETCS) is demonstrated.
Passenger operation is carried out with GoA2
(automated operation with driver monitoring) and
depot operation is carried out according to GoA4
(fully automated) (DB Systemtechnik, 2021).
Rio Tinto also operates highly automated rail vehicles
in Australia with its auto haul project. The automation
is realized via a radio remote control as a fallback
level. Safe operation is realized through the extra
protection of critical points such as level crossings
and inhabited areas. Collisions with wild or grazing
animals pose the greatest risk on most of the route.
The train detects impacts on the locomotive and
provides the supervisor with data to evaluate the
impact. The supervisor can decide remotely whether
the journey must be interrupted or can be continued
(Rio Tinto, 2017).
The systems listed here are located in more or less
protected environments and are operated fully
automatically if human or economic damage can be
ruled out. For the further spread of automated rail
systems, solutions must be developed that also work
in critical areas of application. This process is
explained below.
2.1 Developing ATO Systems
The examples show that the automation of railroad
systems is used in a wide range of applications. In
terms of railroad technology, the areas of application
can be divided into main line and on-sight operation.
In order to promote their automation, it is necessary
to work out the differences.
On the mainline trains are mainly operated using
train control systems featuring signals. Due to their
mechanical properties, the trains have very long
braking distances, meaning that the stopping distance
cannot be monitored by the vehicle. The signals are
used to divide the line into individual blocks to ensure
that trains stop in good time. The signal either blocks
the following block or releases it and transmits the
permitted speed. In manual mode, the driver reacts to
the signal position. this process must be taken over by
the system in automated mode (Pachl, 2020).
In Europe, ETCS is being introduced to automate
main lines. From equipment level 2, it transmits the
permitted speeds by radio, receives position
information and monitors the information generated.
At ETCS level 3, it will be possible to operate without
"fixed block" signals in order to increase line
utilization by means of dynamic virtual blocks.
(Schnieder, 2021).
ECTS already provides a functional automation
basis for the mainline. However, significant
investment in the infrastructure is still required for the
rollout across the entire rail system (European
Commission, 2023).
The 'driving-on-sight' includes more complex
operations such as depot trains, shunting,
approaching stops or mixed tram and road traffic. Due
to the significantly lower speeds, it is possible to
monitor the stopping distance from the vehicle.
When the vehicle is automated, it is therefore
necessary to replace the driver's visual, (acoustic and
sensory) perception with an automated system. This
step is accomplished by merging several sensor data.
Depending on the application, color cameras, infrared
cameras, LiDAR, radar or ultrasonic sensors are used
to replace the driver's visual capabilities (Tagiew et
al., 2022). In addition, it is necessary to locate the
locomotive in the track plan with high accuracy in
order to distinguish between obstacles in the
clearance gauge or objects by merging with the data
from the environment detection system. Since the
Introducing Scaled Model Development to on-Sight Automatic Train Operation
379

installed balises do not provide the necessary
accuracy, positioning systems consisting of
GPS/GNSS, IMU and odometry sensors are used.
The basic problems and the sensor setup used are
similar to autonomous driving in the automotive
sector. Therefore, it is advisable to examine closely
the development and testing methods used in the
automotive industry.
With the increasing complexity, not only the
development but also the adequate testing of
automated systems is becoming more and more
important. In the automotive industry, the scenario-
based test approach developed in (Pegasus, 2019) is a
common practice to support the development process
and bring the automated system to market.
In the early stages of the project, systems are
developed and tested in simulation environments; as
development progresses, the system is tested in the
real environment.
This approach seems appropriate for rail
technology. However, due to the fundamental
differences between road and rail vehicles in terms of
masses, friction coefficients, track characteristics and
operating environments, it is necessary to adapt the
approach for use in rail technology.
A correspondingly derived method for railroad
technology is described in (Greiner-Fuchs et al.,
2022). Due to the lack of general measurement data
with ATO reference in railway technology, the
methodology is driven by a knowledge database
derived from operational regulations, observations in
the field and self-generated data. Similar to the
automotive industry, the methodology propagates the
performance of simulative tests and final verification
and validation in the field.
In (Schäfer et al., 2023), the application of a
virtual environment for the development of highly-
automated rail vehicles is demonstrated. At the level
of research questions, it is therefore feasible to use
virtual environments to pre-develop systems. To date,
these simulations have not been sufficiently verified
and validated, so there is no commercially available
platform for on-sight ATO functions. The
development of field tests using the above-mentioned
method is also still under development and has not yet
been sufficiently validated.
It should therefore be noted that the fundamental
problems of highly automated rail vehicles are known
and the first solutions derived from the automotive
industry are available. The sensor concepts and
system topologies have been concretized, but
unfortunately the test and development standards do
not yet correspond to the desired target image. The
problems still to be solved are discussed below.
2.2 Challenges for Development and
Testing of on-sight ATO
Functions
Based on the research group's experience in the field
of automated on-sight rail systems, some remaining
problems for simulative and field testing can be
identified.
On the simulation side, there is the problem of the
dynamic development of new or other sensor
technologies for which adequate sensor models must
first be developed. Due to a long period of low
demand for simulation environments for rail vehicles,
the number of commercial participants is still very
low, which means that it is not always possible to
adapt the simulation environments in step with sensor
development. State-of-the-art development must
therefore often be carried out with non-validated
sensor models. With sufficient prior knowledge, the
basic sensor simulations can be considered reliable,
although they may not always provide a solid
foundation.
Railroad test sites are not public areas.
Consequently, clearly defined operational and
regulatory conditions apply on the available test sites.
This means that an operational and technical test
manager must be present in addition to the train driver
for the actual test and development personnel. The
high utilization of railway infrastructure also makes it
difficult to provide temporary routes for test and
development purposes without retrospective impact.
Maintenance backlogs for locomotives coupled with
the general availability of railway vehicles also make
field operations more difficult.
Prices for the use of a shunting area e.g. in
Germany are listed in (RLC Wustermark, 2023). A
locomotive including a shunting driver and diesel are
required for testing. This process can be considered a
shunting service for rough calculation purposes.
Additionally, costs are incurred for infrastructure,
such as track utilization. It is important to note that
the locomotive may lose its license when upgraded,
so costs for upgrading, disassembly, and certification
must be factored into the test. Accordingly, it is
advisable to plan test and development runs in the
field for extended periods to reduce the expenses and
labour involved in conversion and transportation.
Taking into account the daily rates for operational and
technical test managers, as well as the test and
development staff, the cost of a single test day can
amount to several thousand euros.
The high cost and inadequate availability of test
facilities and personnel ensure a high degree of
transferability of simulation results to the field.
VEHITS 2024 - 10th International Conference on Vehicle Technology and Intelligent Transport Systems
380

However, this is often not the case due to the
aforementioned non-validated simulation data, non-
simulated interfaces and unforeseen hardware effects.
In order to optimize the test time in the field, the
leap in technology maturity between simulation and
the real environment must be reduced. One possible
solution appears to be the use of scaled models, this
option is presented and discussed below.
Interface technologies such as WiFi, Ethernet or
radio and protocols such as TCP/IP, UDP, I²C, etc.
can still be used in their original form even at very
large downscaling due to their small size. This allows
interface problems, faulty data, bit shifts or similar
connectivity issues to be resolved realistically in the
model.
3 SCALED MODELS
Scaled models are commonly used in the literature
when real test objects are expensive or difficult to
obtain. They are also utilized to verify simulation
models. The reasons described are similar to the
problems observed during on-sight ATO-function
development and testing. The following section
shows how scale models are adapted in technology
and science to identify conditions and limits.
3.1 Scaled Models in Science
A large number of scaled models are known in science
and in engineering applications. These are presented
below as examples and analyzed with regard to
synergies with the problems discussed in the paper.
The investigation of air flows in wind tunnels is
one of the best-known applications of scaled models.
Large objects such as airplanes (Aerospace
Engineering, 2022) or buildings (Geurts & Van
Bentum, 2007) cannot be tested economically in their
original size. Consequently, the wind tunnel (test site)
and test object are scaled until a satisfactory
relationship between cost and gain in knowledge is
achieved. The measurement results are scaled to the
real application using physical correlations, such as
the Reynolds number. The scaled models are also
applied to verify simulation approaches.
Furthermore, scaled models are utilized for the
design of buildings for special cases such as
earthquakes. Various approaches are explored to
determine the scaling factors by which the results and
effects can be transferred to reality (Atar, 2022).
The research and development of autonomous
ships is more closely related to the topic of automated
train operation, because these entail even higher
individual costs for test vehicles and a comparable
availability and utilization of test sites as in railway
technology. Scaled ships are used as test vehicles, the
length of which is chosen to allow for a lighter
regulatory framework is possible in terms of driving
licenses and operation. Due to the large initial size of
ships, it is still possible to use original LiDAR,
camera and radar sensors even after scaling. (Kolewe
& Tietz, 2023).
In the automotive industry, the use of scaled
models for the development and testing of
autonomous driving functions is unknown. It is
assumed that the costs for test vehicles and test sites
are too low to consider investing in scaled models.
3.2 Scaled Models in Railways
In the field of rail vehicles, the use of scaled models
is already in use in teaching and research.
(Aceituno et al., 2017) shows the use of a scaled
vehicle with a 5-in track gauge for the validation of
dynamic simulations.
In the railway operations laboratory (ger.
“Eisenbahnbetrieblabor”) of TU Dresden a model
layout in H0 gauge (16.5 mm) is provided for,
teaching and research focused on safety technology
and signal box technology, with the possibility of
establishing a link to real systems such as the Dresden
suburban railway (TU Dresden, n.d.).
RWTH Aachen University also operates an H0-
scale environment featuring different realistic signal
box technologies, with the ability to simulate real
switch towers, as well as different kinds of safety
technologies up to ETCS simulation, and an extensive
track network to elaborate solutions for dispatch
optimization (RWTH Aachen, n.d.).
In the literature, scaled models are utilized in
railway technology for research, development and
demonstration of safety and interlocking technology,
timetable optimization and validation method for
dynamic simulation. An approach to establish scaled
model methods for on-sight ATO is described below.
4 SCALED MODEL
DEVELOPMENT FOR
ONSIGHT AUTOMATED TRAIN
OPERATION
To map on-sight ATO functions in the scaled model,
it is necessary to develop and set up an appropriate
test field and a demonstrator vehicle. The first step is
to clarify which functions are to be tested with the
Introducing Scaled Model Development to on-Sight Automatic Train Operation
381
development and testing platform. With reference to
a parallel project in which a shunting locomotive is
being automated, the test field and the demonstrator are
to be adapted to the needs of automated shunting
operations in order to improve the comparability of the
results. Due to the increasing complexity and
development effort required for GoA4 functions, it is
expected that scaled models can contribute to
development, especially for highly automated vehicles,
due to the advantages already described. Accordingly,
the scaled model should be planned in a modular way,
so that functions up to GoA4 can be developed.
4.1 Scaled Test Environment and
Demonstrator Locomotive
A marshalling yard usually contains arrival tracks, a
hump, directional tracks and classification tracks. The
tasks of a (automated) shunting locomotive are
divided into use cases for testing and development
purposes. These are “check, move, approach, attach,
pressing-up, push-loose, follow, closing gap, retrieve
wagon, clear track, emergency brake, buffing,
humping and move-up” (Hofmeier et al., 2022). For
an initial exploration of the possibilities of scaled
models for the development of ATO functions, the
focus will be limited to a reduced range of functions
of the shunting locomotive. For the experiment, the
use cases will include "move," where the locomotive
switches the track by moving via the dead-end track;
"approach" and "attach," where the locomotive
approaches an obstacle or wagon at a safe distance or
attaches to it; and "check," where the locomotive
verifies the functionality of the sensors. These use
cases are primarily performed in the area of the arrival
tracks and the hump; consequently, these must be
considered at least in the test field setup.
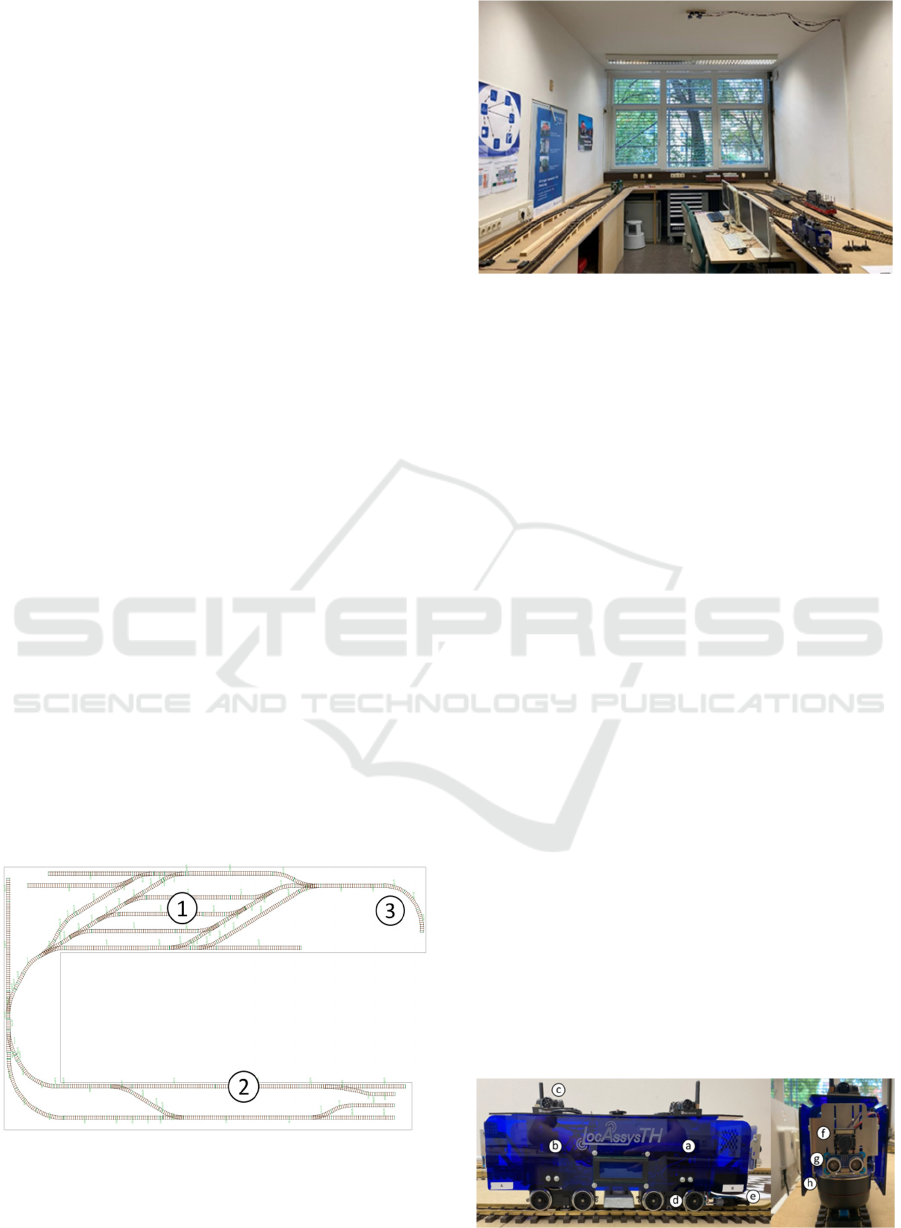
Figure 1: Track layout with arrival tracks (1), hump (2) and
dead-end track (3).
Figure 2: Overview of test area.
The test environment (Figure 1) is constructed on
a u-shaped plate with external dimensions of 6.2 m x
3.6 m, constrained by the room size (Figure. 2) and
features approximately 34 m of track length,
incorporating 17 switches and two three-way
switches, with a track gauge of 45 mm.
The test area consists a track harp as arrival tracks
(1), a hump with two parallel tracks (2) and a dead-
end track (3) used for switching between the tracks.
A range of rail vehicles are also available for
testing, including flat wagons, container wagons,
timber wagons and vehicle transporters.
In order to implement automated driving,
appropriate sensors must be positioned, data analyzed
and actuators controlled. In terms of sensor data, this
primarily requires data for environment detection and
localization. A comparatively high level of
computing power is expected to be required to
analyze environmental data. A Raspberry Pi appears
to be a sensible solution, as it also provides a large
number of interfaces. State-of-the-art ATO systems
mainly use LiDAR sensors for obstacle detection.
Accordingly, a LiDAR sensor should also be used in
the scaled model. It is possible to estimate the
installation space for a demonstrator from the
minimum requirements for computing power, sensors
and interfaces. The G or 1 gauge with 45mm (scale
1:32 to standard gauge) offers the possibility of a
sufficiently large demonstrator to accommodate all
the required components and keeps the effort and
costs for infrastructure construction to a minimum
compared to larger model railway gauges.
Figure 3: Demonstrator setup.
VEHITS 2024 - 10th International Conference on Vehicle Technology and Intelligent Transport Systems
382
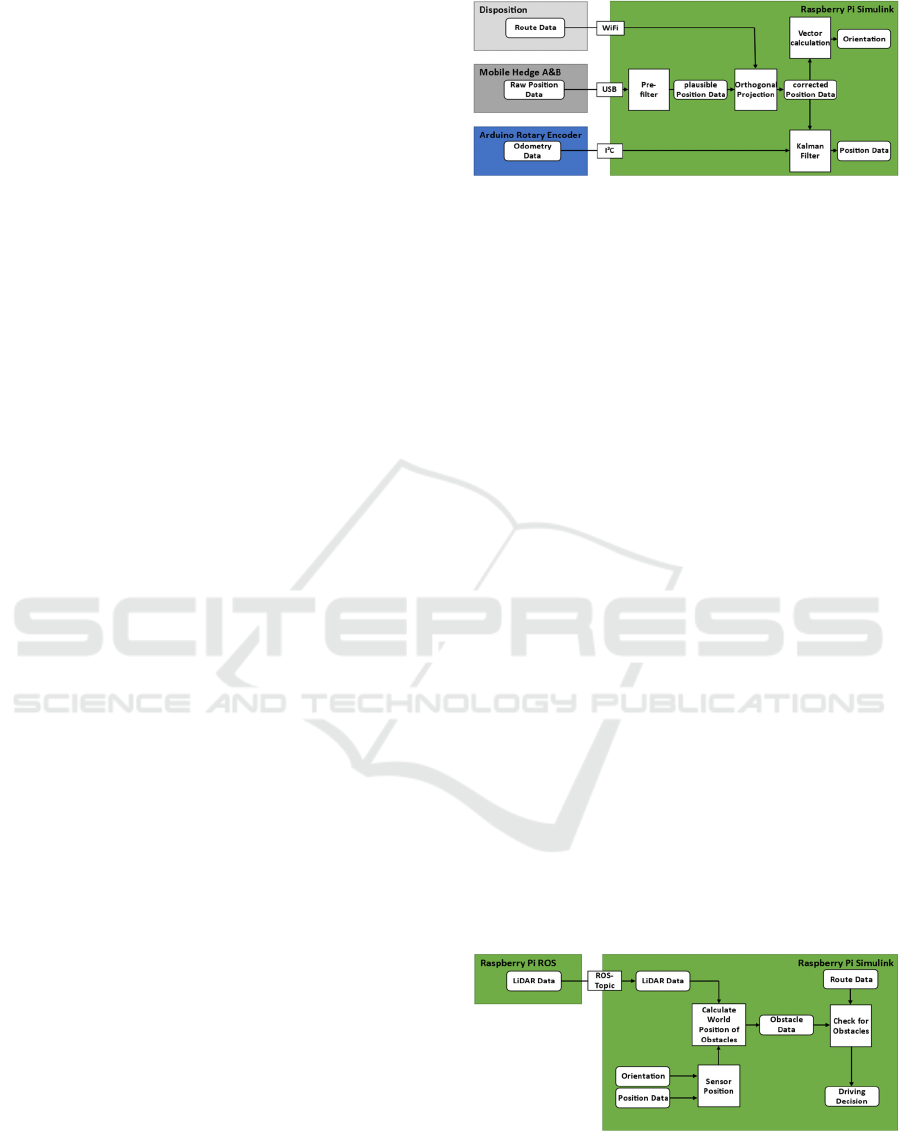
Figure 3 shows the structure of the demonstrator
vehicle. The central unit is a Raspberry Pi 4B 8GB
(a). Two Arduino Nano (b) are used to read out sensor
data. The localization is implemented with an
ultrasound-based Marvelmind Indoor Positioning
System with mobile hedges on the vehicle (c) and
fixed beacons at the labs walls. To record odometry
data, an incremental encoder (d) is attached to the
engine shaft. A strain gauge is installed in (e), which
can be used to measure the trailer load. An RGB
camera RPI WWCAM (f), an ultrasonic sensor HC-
SR04 (g) and a LiDAR sensor RPLIDAR M2A8 (h)
are used as sensors for environment detection.
The sensor data from the strain gauge and
ultrasonic sensor are read out on Arduino 1, and data
can also be visualized on the LCD display via Arduino
1. The incremental encoder is processed with Arduino
2. Both Arduinos are connected to the Raspberry Pi
via I
2
C. The hedges of the indoor positioning system
are connected to the Raspberry Pi via USB.
In the next step, an ATO system is set up with
these components.
4.2 Developing a Scaled ATO Shunting
System
To fulfil the use cases defined at the beginning, the
first step is to derive the position of the locomotive on
the route or in the track plan using reliable positioning
in combination with the route data transmitted
externally to the locomotive (X-coordinates, Y-
coordinates, additional information). Additional
information includes, for example, speed
specifications between two waypoints and expected
obstacles such as a wagon on the track. The Indoor
Position System offers a 100 Hz protocol in which,
among other data, the X and Y coordinates of the
hedges are transmitted via USB. The ultrasonic
beacons use an IMU to interpolate between the
sampling rate of the actual ultrasonic system to
increase the data rate up to 100 Hz.
The localization data is read out via USB on the
Raspberry Pi and the route data is transferred via
TCP/IP.
The hardware support of Simulink for Raspberry
Pi is used for programming. The development process
here is analogue to the development on a dSPACE
MicroAutoBox II used in the real locomotive
application.
Figure 4 describes the procedure for determining
the position. Data is transferred to Simulink via WiFi,
USB and I²C interfaces. There, the position data is
checked for plausibility (verification of coordinates in
the
laboratory), then the measurement data is
Figure 4: Interfaces, process and components of
positioning.
projected onto the distance data in order to eliminate
the lateral deviation. The actual position is estimated
using the odometry data and a Kalman filter. It is also
possible to determine the locos orientation from the
positions of the hedges A & B.
This process enables the determination of the
locomotive's position on the route with sufficient
accuracy, sampling rate, and reproducibility.
The next step is to set up the environment
monitoring system. In the first approach, the
ultrasonic sensor is used to detect obstacles in order
to reduce complexity. This makes it possible to enable
platooning between two demonstrator vehicles in a
straight line. As it is not possible to clearly determine
where the object detected by the ultrasonic sensor is
located, this system cannot be used to ensure safe
movement in the track curve.
The LiDAR sensor is integrated into the system
for fully functional environment detection. For this
purpose, Robot Operating System (ROS) is installed
as a framework to provide LiDAR sensor data.
To make a driving decision based on the LiDAR
data, the raw data is transferred to Simulink via the
ROS topic and processed there in X/Y format
coordinates. In addition, the position of the sensor in
the world coordinate system is calculated using the
position of the beacons and the position of the LiDAR
on the locomotive (see Figure 5). By adding the
sensor position to the point cloud, the detected objects
are available in world coordinates.
Figure 5: Decision-making obstacle detection.
The distances of the objects to the track are
calculated taking the route data into account. If the
distance falls below a defined nominal value (e.g.
Introducing Scaled Model Development to on-Sight Automatic Train Operation
383
clearance profile), the object is classified as an
obstacle. If the distance to obstacles approaches the
stopping distance, braking is initiated.
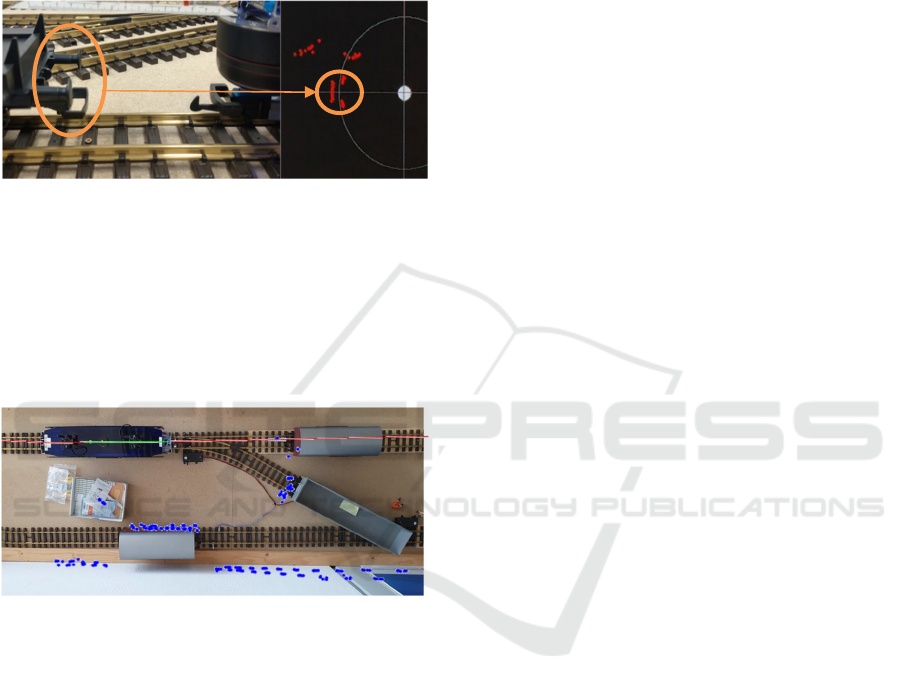
Figure 6 shows the LiDAR point cloud after the
locomotive has approached. The sensor is installed in
such a way that the buffer level of the wagon is
intersected. Buffer and wagon front can be clearly
distinguished at a short distance.
Figure 6: Point cloud after approaching.
Figure 7 visualizes the ATO system in action. The
decision making is able to guide the loco along the
route. During the journey, the system checks the sensor
data for plausibility and executes the use cases check,
move, approach and attach with sufficient reliability.
Consequently, the implementation of ATO functions in
the model has been successfully completed.
Figure 7: Visualization LiDAR-position, route data and
point cloud data.
For the test runs of the “move” use case, target
positions are defined on the track to be approached by
the demonstrator. The system always determines the
correct orientation and therefore moves in the right
direction. The distance to the target point can be
determined at the time of measurement with a
maximum deviation of ±15 mm. In addition, the error
increases with speed (approx. 50 mm/s and effective
sampling rate (approx. 75 - 85 Hz) to the next
measurement point.
For the “approach” case, the system is able to
reliably determine the distance to obstacles within the
clearance gauge. The deviation of the distance
measurement is lower than that of the localization
system and therefore depends heavily on the local
localization accuracy. During the investigations,
borderline cases such as objects at the clearance
gauge boundary were excluded. It is expected that
further software (and hardware) improvements to the
system will be necessary in order to be able to
maintain tight tolerances (<10 mm) around the
boundary of the clearance gauge.
“move” and “approach” have in common that a
(defined) braking curve must be maintained, for
which precise speed information is required. The tests
show that the installed incremental encoder works
unreliably at times and that controlled braking is
intolerably often (>40 %) not possible. Furthermore,
it is not possible to model the realistic control
behavior of a real locomotive with this setup. A
revision of the speed sensor is necessary to increase
the functionality of the demonstrator.
The distances to be covered in the "attached" case
are short and can, in principle, be achieved with the
system stand. However, it is not possible to
implement a realistic approach speed behavior
depending on the load or other factors.
5
CONCLUSION
The test setup demonstrates that it is possible to
develop an ATO system in a scaled model in a cost-
and time-efficient manner. The sensors used in reality
can either also be scaled or have to be mapped using
corresponding substitution technologies (e.g. GPS
ultrasonic positioning). Also, the processes and
programming languages used in reality can be
transferred directly to the model. The problems and
hurdles with regard to different interfaces and
latencies are analogous to reality. Accordingly, it is
expected that it will be possible to transfer the
knowledge gained to the real application.
The most important step is to demonstrate
scalability into the real system. Various hurdles are
expected here that could limit the usability of scaled
models. For instance, the effects caused by masses are
primarily distorted through scaling. Mechanical
processes may, in certain cases, fail to depict reality
with sufficient accuracy for estimating loads or similar
factors. Nevertheless, alternative solutions are already
delineated in the literature regarding this matter.
Moreover, it is anticipated that processes and structures
for environment detection and localization, as well as
interfaces and software architectures, can be
effectively developed within the demonstrated scaled
model approach. However, it is essential to identify
and determine dimensionless quantities for scaling the
individual system components to achieve this.
To this end, it is planned to expand the test field
structure in order to be able to consider further
application areas of driving on-sight and to generate
VEHITS 2024 - 10th International Conference on Vehicle Technology and Intelligent Transport Systems
384

a more flexible and versatile test environment that
requires increased performance in the system.
Additionally, the vehicle will be equipped with
enhanced sensors to address the described issues.
REFERENCES
Aerospace Engineering. (2022, September 15). Inside the
Wind Tunnel: How Aircraft Planes are Tested. https://
www.aerospacengineering.net/inside-the-wind-tunnel-
how-aircraft-planes-are-tested/
Atar, M. (2022). Scaled Earthquake Resistant Structures.
https://pure.manchester.ac.uk/ws/portalfiles/portal/213
188780/FULL_TEXT.PDF
DB Systemtechnik. (2021, September 30). Digitale S-Bahn
Hamburg—A safety concept to operate ATO over
ETCS. https://www.era.europa.eu/system/files/2022-
11/ control _major_risks_-_marc.pdf
European Commission. (2023). State of play—European
Commission. https://transport.ec.europa.eu/transport-
modes/rail/ertms/state-play_en
European Union. (2019). Digitalisation in railway transport.
https://www.europarl.europa.eu/RegData/etudes/BRIE/
2019/635528/EPRS_BRI(2019)635528_EN.pdf
Geurts, C., & Van Bentum, C. (2007). Wind Loading on
Buildings: Eurocode and Experimental Approach. In T.
Stathopoulos & C. C. Baniotopoulos (Hrsg.), Wind
Effects on Buildings and Design of Wind-Sensitive
Structures (Bd. 493, S. 31–65). Springer Vienna.
https://doi.org/10.1007/978-3-211-73076-8_2
Greiner-Fuchs, L., Schäfer, S., Hofmeier, T., & Cichon, M.
(2022). Database-supported methodical approach for
the development of a toolchain for the evaluation of
ATO functions using a scenario-based test
methodology. Proceedings of the Fifth International
Conference on Railway Technology: Research,
Development and Maintenance.
https://doi.org/10.4203/ccc.1.13.4
Guglielminetti, P., Lagraulet, M. F., Artuso, D., Lunadei,
E., Musso, A., Fusco, G., Licciardello, R., Piccioni, C.,
& Seno, F. (2015, Juli). Study on Single Wagonload
Traffic in Europe – challenges, prospects and policy
options. https://transport.ec.europa.eu/system/files/20
17-02/2015-07-swl-final-report.pdf
Hofmeier, T., Greiner-Fuchs, L., Schäfer, S., & Cichon, M.
(2022, Oktober). Task analysis of a shunting
locomotive to derive use-cases for scenario based tests
of ATO Functions. 9th Auto Test Conference, Stuttgart.
https://www.researchgate.net
IEC. (2006). IEC 62290-1:2006 Railway applications –
urban guided transport management and command/
control systems – part 1: System principles and
fundamental concepts (IEC 62290–1).
Kaack, L. H., Vasihnav, P., Morgan, M. G., Azevedo, I. L.,
& Rai, S. (2018). Decarbonizing intraregional freight
systems with a focus on modal shift. Environmental
Research Letters, 13(8). https://doi.org/10.1088/1748-
9326/aad56c
Kolewe, B., & Tietz, L. (2023, Oktober 5). Vom Seehafen
bis zur Haustür – autonomer Gütertransport auf dem
Wasserweg. Fachkonferenz "Neue Technologien und
Testfelder für Wasserstraßen und Häfen.
Pachl, J. (2020). Railway Signalling Principles.
Universitätsbibliothek Braunschweig. https://doi.org/
10.24355/ DBBS.084-202006161443-0
Pegasus. (2019). PEGASUS Method: An Overview.
https://www.pegasusprojekt.de
Pourian, T. N. (2023). Effects of Automation in Railway on
the Capacity – At the Example of the S-Bahn Stuttgart
https://www.diva-portal.org/smash/get/diva2:1777801/
FULLTEXT01.pdf
Powell, J. P., Fraszczyk, A., Cheong, C. N., & Yeung, H. K.
(2016). Potential Benefits and Obstacles of
Implementing Driverless Train Operation on the Tyne
and Wear Metro: A Simulation Exercise. Urban Rail
Transit, 2(3–4), 114–127. https://doi.org/10.1007/
s40864-016-0046-9
Rio Tinto. (2017, Oktober 2). Rio Tinto completes first fully
autonomous rail journey in Western Australia.
https://www.riotinto.com/en/news/
RLC Wustermark. (2023, Juni 21). Zugangs- und
Nutzungsbedingungen. Rail & Logistik Center
Wustermark GmbH. https://www.rlcw.de/zugangs-und-
nutzungsbedingungen.html
RWTH Aachen. (n.d.). Die Eisenbahntechnische Lehr-
Versuchsanlage der RWTH Aachen. https://www.via.
rwth-aachen.de/elva.php
Schäfer, S., Greiner-Fuchs, L., Hofmeier, T., & Cichon, M.
(2023). Entwicklung eines echtzeitfähigen virtuellen
Laborprüfstands (Simulationsumgebung) für das
szenariobasierte Testen und Validieren hoch-
automatisierter Fahrentscheidungs- und Steuerungs-
systeme von Rangierlokomotiven. Tagungsband 19.
Internationale Schienenfahrzeugtagung Dresden,
Tagungsband, 108.
Schnieder, L. (2021). European Train Control System
(ETCS). Springer Berlin Heidelberg. https://doi.org/
10.1007/978-3-662-62878-2
Tagiew, R., Leinhos, D., von der Haar, H., Klotz, C., Sprute,
D., Ziehn, J., Schmelter, A., Witte, S., & Klasek, P.
(2022). Onboard Sensor Systems for Automatic Train
Operation. In S. Marrone, M. De Sanctis, I. Kocsis, R.
Adler, R. Hawkins, P. Schleiß, S. Marrone, R. Nardone,
F. Flammini, & V. Vittorini (Hrsg.), Dependable
Computing – EDCC 2022 Workshops (S. 139–150).
Springer International Publishing.
Trepáčová, M., Kurečková, V., Zámečník, P., & Řezáč, P.
(2020). Advantages and disadvantages of rail
transportation as perceived by passengers: A qualitative
and quantitative study in the Czech Republic.
Transactions on Transport Sciences, 11(3), 52–62.
https://doi.org/10.5507/tots.2020.014
TU Dresden. (n.d.). The Laboratory. TU Dresden. https://tu-
dresden.de/bu/verkehr/ibv/ebl/das-labor/start
seite?set_language=en
Zasiadko. (2019, November 19). Fully automated metros
run in six EU countries. RailTech.Com.
https://www.railtech.com/infrastructure
Introducing Scaled Model Development to on-Sight Automatic Train Operation
385
