
Machine Learning for a Better Agriculture Calendar
Pascal Francois Faye
1 a
, Jeanne Ana Awa Faye
2
and Mariane Senghor
1
1
Universit
´
e du Sine Saloum El Hadj Ibrahima NIASS (USSEIN), Sing Sing, Kaolack, Senegal
2
Universit
´
e Aix-Marseille, Institut de Management Public et Gouvernance Territoriale, Aix-Marseille, France
Keywords:
Agriculture Calendar, Internet of Things, Data Analysis, Artificial Intelligence, Crop Yield.
Abstract:
In Senegal, agriculture is subsistence, low-input, and significantly less mechanized than many other nations in
Africa, and is also highly dependent on soil, climate, and water. Food crops take up to 46% of the total land
and make up 15% of the Gross Domestic Product (GDP), ensuring between 70% and 75% employment. In this
work, we provide a set of mechanisms that uses a set of trust database of agro-climatic parameters and a set
of artificial intelligence algorithm in order to assess agricultural calendar for a good distribution of the farm’s
activities over time and find the relationship between crops. Our results show the effectiveness of our solution
to overcome the abandonment of agricultural perimeters or an agriculture depending on the raining season.
That means, taking these data into account makes possible to understand crops dependencies and anticipate
the agroecological phenomena, the crop diseases and pests that impact the planning of production facilities
and variations in agricultural yields.
1 INTRODUCTION
With the arduousness of agriculture works and the
gradual abandonment of land due to the demographic
pressure of cities, climate change and soil deteriora-
tion, several research questions are done in order to
find solutions or advice with the reduction of agricul-
tural perimeters. In order to continuously feed the fu-
ture, in computer sciences we have several advances
on sensor network, robot automation, computer vision
and artificial intelligence for pest detection, predic-
tion, decision making, etc.
Computer vision recognition has been increas-
ingly applied to numerous field of agricultural with
the advancement of computer graphics and image
processing technology. The development of sensors
technologies for smart agricultural, such as soil tem-
perature and humidity sensors, air temperature and
humidity sensors, etc., enhance data collection and
processing for decision making in the agricultural en-
vironment. Usually, the data is wirelessly transferred
from the sensor to the sink node for data collection
and the server for processing and decision making.
Between them, the gateway changes the protocol into
one that can be communicated over the Internet when
it receives data from the sink node. In addition, the
use of robots in agriculture that uses a variety of sen-
a
https://orcid.org/0000-0002-2078-5891
sors to sense the dynamic of the agricultural environ-
ment and then picks the target using this knowledge
and a decision-making algorithm based on artificial
intelligence help farms in order to manage (plough-
ing, sowing, harvesting, attack detection, etc.) their
field.
In this work we tackle the planning of the agri-
cultural calendar for a good distribution of activities
over time. This in order to take into account climate
changes, soil degradation, etc. for improving the farm
crop plan and to overcome the seasonality of the agri-
culture.
In the rest of this paper, section 3 presents our re-
search problem, section 4 highlights our objectives
and section 5 discusses related works. Section 6
presents some preliminaries and methodologies. Sec-
tion 7 highlights the results that lead to the proposed
cropping calendar before the conclusion.
2 RESEARCH PROBLEM
An agriculture that deals with the environment and
the climate change has become an imperative if we
aim to feed the future. All fields of agriculture are
affected and need to limit the disadvantages of cli-
mate change and soil degradation. A better under-
standing of the changes of resources (water, energy,
Faye, P., Faye, J. and Senghor, M.
Machine Learning for a Better Agriculture Calendar.
DOI: 10.5220/0012691800003753
Paper published under CC license (CC BY-NC-ND 4.0)
In Proceedings of the 19th International Conference on Software Technologies (ICSOFT 2024), pages 307-314
ISBN: 978-989-758-706-1; ISSN: 2184-2833
Proceedings Copyright © 2024 by SCITEPRESS – Science and Technology Publications, Lda.
307

etc.) in the farm’s environment is needed to make
the right varietal choices and crop options. This is
not to mention the rise in temperatures, which leads
to increased evaporation or evapotranspiration, which
influences yields and the seasonality of the agricul-
ture. That is why, in this work, we propose to process
historical agro-ecological data using Machine Learn-
ing (ML) algorithms and probability laws in order to
make fair decisions about cropping calendars and un-
derstand changes in cropping practices. In addition,
we aim to find the relation between a set of crop in
order to give the farmers the possibility to test other
crop type in the peanut basin of Senegal.
3 OUTLINE OF OBJECTIVES
Knowledge of climate change and its effects on the
various sectors of the national economy is a major
challenge for the country’s developers. Various ini-
tiatives are therefore being developed to better iden-
tify the implications of climate variability in the agri-
cultural sector. However, while a causal relationship
has clearly been established between the vulnerabil-
ity of the agricultural sectors and a set of parame-
ters like: the climate, the challenge of accurate infor-
mation, the sharing and pooling efforts (Faye et al.,
2022). This calls for a review of existing frameworks,
but it should also help to find ways of collaborating,
sharing and other one in order to provide better sup-
port for decision-making, particularly for grassroots
users such as producers. Supporting farmers to bet-
ter manage the risks associated with climate variabil-
ity is now a major necessity. All economic activities
which promote food security and suitable agriculture
must incorporate the risks of climate change into their
planning. The aims of this work are proposing :
1. a crop calendar that is adapted to variations in
endogenous resources and meteorological factors
during the annual seasons.
2. to find similarities between different crops in or-
der to propose an annual soil occupation manage-
ment strategy.
This by using historical agro-meteorological and
agroecological database to ensure sustainable crop
yields. In this way, farmers can make decisions about
the technical itineraries for their crops and the dates
set for the cropping calendars (ploughing dates, sow-
ing dates, fertiliser application dates, irrigation hours
and other inputs), which can enable precision farm-
ing. This work combines:
1. laws of probability to model the dynamics and un-
predictable events;
2. Machine learning algorithms (ML) to find the bet-
ter decision making;
This combination delivers a solution that addresses
well the dynamism and uncertainty challenges tar-
geted in this work.
4 STATE OF THE ART
In (Sellam and Poovammal, 2010), the authors per-
sist to research the environmental parameters that af-
fect the crop yield and related parameters. Here a
multivariate Regression Analysis is applied for the
same. A sample of environmental factors considers
a period of 10 years. The System is applied to find
the relationship between explanatory variables like
annual rainfull,area under cultivation, food price in-
dex and hence the crop yield as a response variable
and R
2
value clearly shows that, the yield is espe-
cially hooked into annual rainfall,area under cultiva-
tion and food price index are the opposite two factors
that are influencing the crop yield. This research is
often enhanced by considering other factors like min-
imum support price, cost price index, wholesale price
index, etc. and their relationship with crop yield. In
paper (Paswan and Begum, 2013), the authors have
compared feed forward neural networks with tradi-
tional statistical methods through linear regression.
This work presents the capability of neural networks
and their statistical counterparts used in the world of
crop yield prediction. In (Zhang et al., 2010), the
authors have done a comparison between the linear
regression model based on the ordinary least square
(OLS) and special autoregressive model for crop yield
prediction in Iowa. The special autoregressive model
has shown enormous enhancement in the model per-
formance over the OLS model. The model can pro-
vide better prediction than the OLS model and has
capability of adjust with the special autocorrelation,
which is not considered by the OLS model. This
work has shown that NDVI (Normalized Difference
Vegetation Index) and precipitation are the most im-
portant predictors for corn yield in Iowa. In (Zingade
et al., 2018), the authors have presented an android
based application and an internet site that uses Ma-
chine learning methods to predict the foremost prof-
itable crop in the current weather and soil conditions
and with current environmental conditions. This sys-
tem helps the former with a sort of option for the crops
that will be cultivated, which will be helping them
over the long run. In (Sun et al., 2022b) they im-
proved a density peak cluster segmentation algorithm
for RGB (Red Green Blue) images with the help of a
gradient field of depth images to locate and recognize
ICSOFT 2024 - 19th International Conference on Software Technologies
308

target fruit during the process of green apple harvest-
ing or yield estimation. Specifically, the image depth
information is adopted to analyse the gradient field of
the target image. In (Feng et al., 2022a), the automatic
separation between two diseases was examined using
image processing technologies. The acquired disease
images were preprocessed using morphological open-
ing and closing reconstruction, color image contrast
stretching, and image scaling. Then, two crop leaf
lesion segmentation algorithms based on circle fit-
ting were suggested and applied. Support vector ma-
chine (SVM) models and random forest models were
used based on individual LBP histogram features and
various LBP (Local Binary Pattern) histogram fea-
ture combinations. (Fu et al., 2022) created rape-
seed dataset (RSDS) using eight categories of data
gathered. The target-dependent neural architecture
search (TD-NAS) was proposed. Usually, smart agri-
cultural produces enormous quantities of multidimen-
sional time series data. However, due to the techno-
logical’s limitations, data loss and misrepresentation
are frequent problems with the smart agricultural’s
IOT devices. In order to solve the issues (Cheng
et al., 2022) proposes a anomaly detection model that
can handle these multidimensional time series data.
Meanwhile, a multi-objective strategy based on super-
vised machine learning was utilized in (Uyeh et al.,
2022) to identify the ideal number of sensors and in-
stallation locations in a protected cultivation system.
A machine learning tree-based model in the form of a
gradient boosting technique was specifically adapted
to observed (temperature and humidity) and derived
circumstances (dew point temperature, humidity ra-
tio, enthalpy, and specific volume). Time series fore-
casting was used for feature variables. In (Maia et al.,
2022), sensor data analysis over two irrigation sea-
sons in three cotton fields from two cotton-growing
regions of Australia revealed a connection between
soil matric potential and cumulative crop evapotran-
spiration (ETcn) derived from satellite measurements
between irrigation events. In (Ma et al., 2022) ex-
plore the distributed averaging issues of agriculture
picking multi-robot systems under directed commu-
nication topologies by utilizing the sampled data. A
distributed protocol based on nearest-neighbor infor-
mation is presented using the principles of algebraic
graph theory and matrix theory. The brown planthop-
per (BPH), Nilaparvata lugens (Stl; Hemiptera: Del-
phacidae), is a piercing-sucking insect that seriously
harms rice plants by sucking out their phloem sap and
spreading viruses. For reducing mating rates, a phys-
ical control mechanism based on BPH courting dis-
ruption is a viable approach to reducing environmen-
tal pollution. To gather effective courtship disrupting
signals. (Feng et al., 2022b) created a vibration sig-
nal recording, monitoring, and playback system for
BPHs. This technology was used to gather and eval-
uate male competitiveness and BPH courting signals
in order to determine their frequency spectra. Accord-
ing to the findings, the mean main vibration frequency
and mean pulse rate of female courtship signals are
234 Hz and 23 Hz, respectively. Male courting sig-
nals had mean main vibration and pulse frequencies
of 255 Hz and 82 Hz, respectively. Furthermore,
Cnaphalocrocis medinalis, Sogatella furcifera, and
Nilaparvata lugens are three kinds of migratory pests
that severely reduce rice yield and result in economic
losses each year. (Sun et al., 2022a) create an intel-
ligent monitoring system of migrating pests based on
searchlight trap and computer vision to replace man-
ual identification of migratory pests in. The system
consists of a cloud server, a Web client, a migratory
pest automatic identification model, and a searchlight
trap based on computer vision. The searchlight trap
uses lights at night to draw in high-altitude migrat-
ing insects. All captured insects are distributed using
rotary brushes and multi-layer insect conveyor belts.
The intelligent monitoring system can automatically
monitor the three migratory pests in time.
In contrast to our work, these works do not pro-
pose a cropping calender in order to minimize the risk
depending to climate change, pest migration and other
agrometeorological information and soils parameters
like ours. In addition, we aim to enhance productivity
and sustainability in the peanut basin of Senegal by
taking into account the socio-economic impact. This,
because in Senegal, there are different types of farms
and various levels of complexities in terms of organi-
zation. We have on the one hand, family farms with
limited levels of organizations, financial capabilities
and standard procedures. On the other hand, there are
some farms working on fruits and vegetables exporta-
tion with better organizations and procedures.
5 METHODOLOGY
Our study is motivated by the environmental and cli-
mate challenges that make difficult the prediction on
crop yield, crop diseases and pests in the peanut basin
of Senegal (Fatick, Kaolack and Kaffrine) (cf. Fig-
ure 1). The peanut basin of Senegal has a set of
different climatic characteristics (Faye et al., 2023).
Many agroclimatic challenges are observable due to
changes in land degradation, soil salinization, temper-
ature, rainfall, etc. We conduced a two years study
that has shown the correlation relationship (Figure 3)
between a set of climatic parameters and the NDVI of
Machine Learning for a Better Agriculture Calendar
309
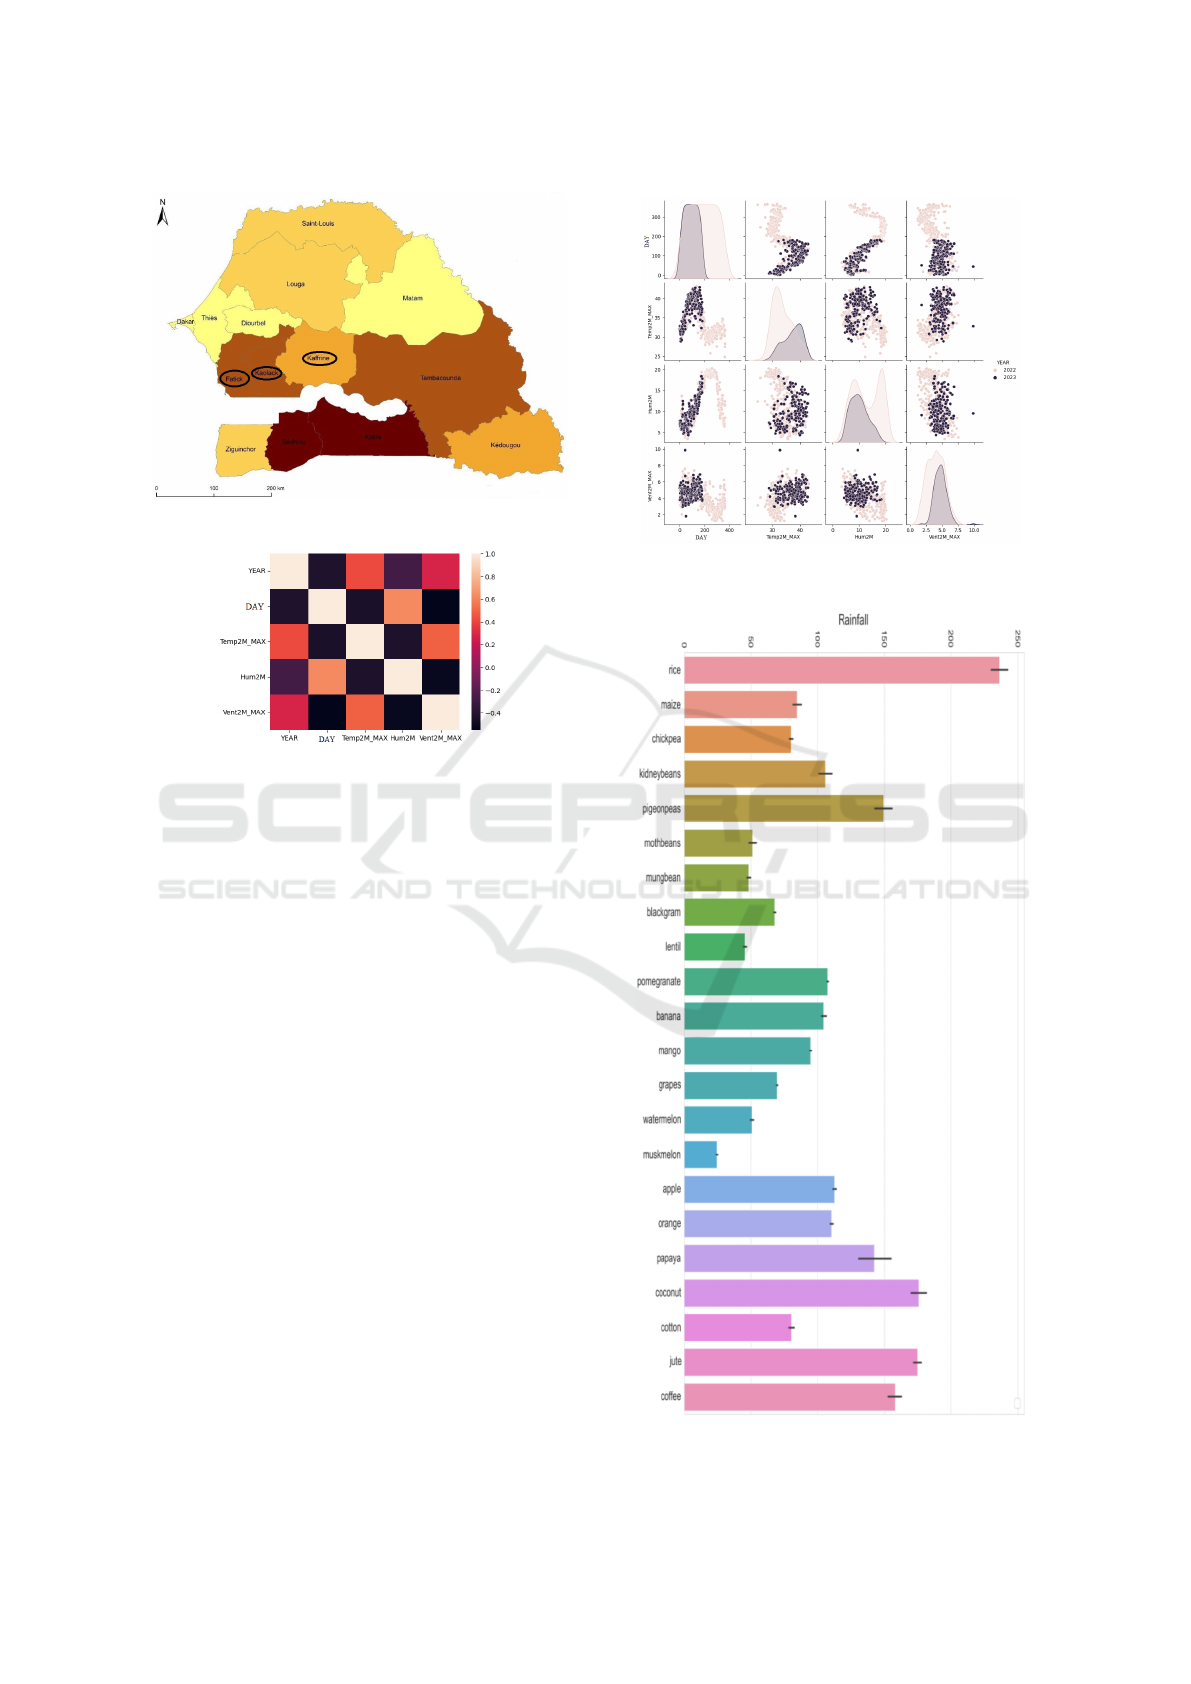
Figure 1: Peanut basin of Senegal.
Figure 2: Data correlation of the agents data.
the peanut basin by using our dataset from our sensor
network (figure 6).
To do this, we use an agent concept. An agent is a
device or an application which can sense the environ-
ment compute some processes and provide results or
acts on its environment.
The figure 2 is a two-dimensional representation of
data which highlights the dependencies between our
set of variables. Each square shows the correlation (a
measure of dependencies) ranges from -1 to +1. Val-
ues closer to zero means there is no linear trend be-
tween the variables. Close to 1 the variables are more
positively correlated, and stronger is the relationship.
This means, as one increases so does the other. A cor-
relation closer to -1 means one variable will decrease
as the other increases. The legend on the right side
help to interpret this heatmap.
In (Faye et al., 2023), a set of results in this peanut
basin shown the crop yield relative to the rainfall (cf.
Figure 4) and to the temperature (cf. Figure 5).
To study the set of real-time interactions between at-
mospheric phenomena and all parameters of agrom-
eteorology (set of scientific and technical tools that
take into account meteorological and agronomic data
to help farm management and agricultural forecast-
ing), we have to deal with the real needs of farmers.
There are three different types of agrometeorological
information: short term (from day to day), medium
Figure 3: Data clustering between 2022 and 2023 using De-
cisionTreeClassifier.
Figure 4: Crop yield relative to the rainfall.
ICSOFT 2024 - 19th International Conference on Software Technologies
310
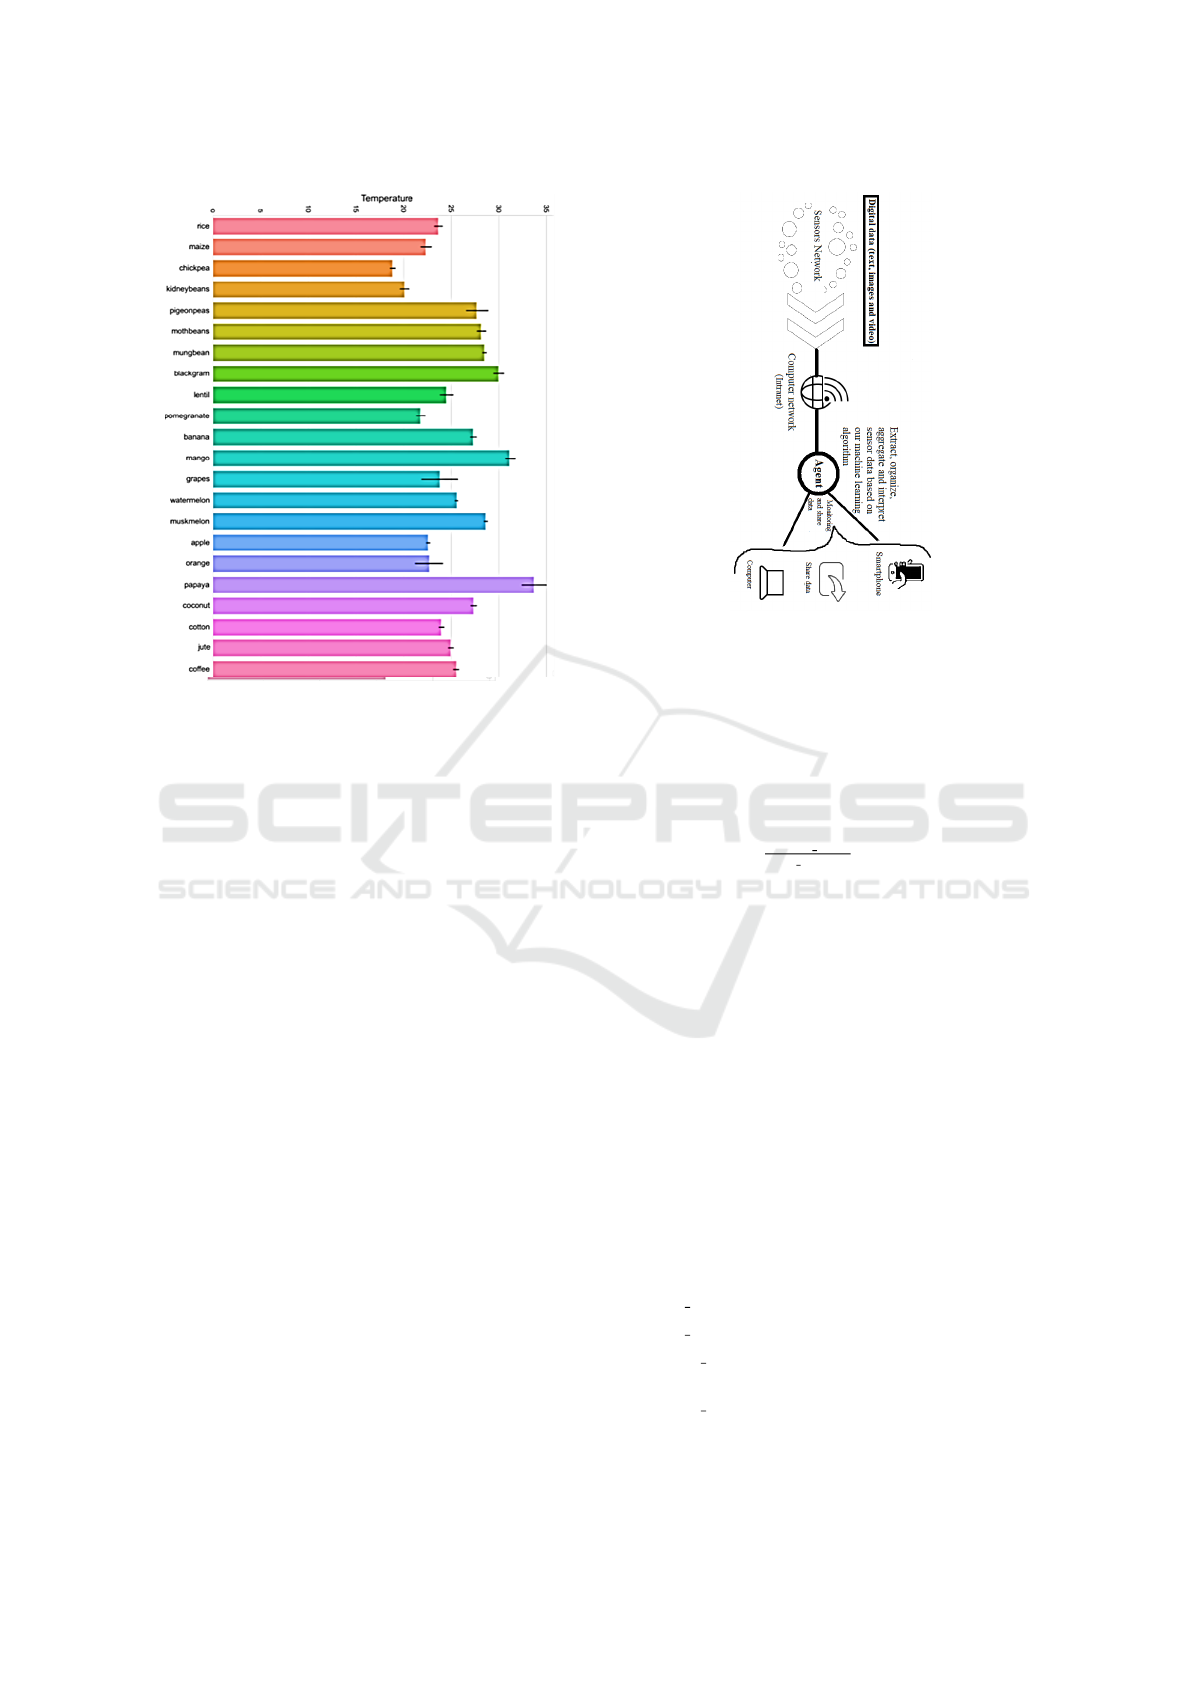
Figure 5: Crop yield relative to the temperature.
term (from fifteen days to two months), and long
term (from one year to more year). Such information
must meet the agricultural requirements for planning
work, forecasting the development risks of certain
climate-related diseases, monitoring the water bal-
ance of soils, monitoring of temperatures in connec-
tion with the plant development schedule. The func-
tioning of the crop, soil and water system depends
mainly on five meteorological variables, namely:
• The air temperature measured under cover at 2
meters above the ground.
• The partial pressure of water vapour in the air
measured under cover at 2 meters above the
ground.
• Wind speed measured at 10 meters above the
ground.
• The overall solar radiation or the daily insolation
time.
• The rainfall.
The first three physical variables are intensive be-
cause they describe the state of a system at a given
time, while the other two are extensive variables that
quantify an exchange of energy or mass between the
atmosphere and the ground. Derived variables are
also used, such as relative air humidity, which de-
pends on the temperature and partial pressure of wa-
ter vapour. An agent which extract, organize, aggre-
gate and interpret sensor data based on our machine
learning algorithm is constrained by the parameters:
Figure 6: Sensors network for local climate and soil data.
{Rs, Hs, ϑ
t
, U, L
Net
}. Rs is its resource(s) and Hs is
its history set which consists of a set of previous deci-
sions. A view ϑ
t
is the set of sensors in its neighbor-
hood with whom it can directly communicate at time
t. U is its private utility function. L
Net
defines the de-
pendence level between the received data in a given
sensors network (Net). The utility function U of the
agent is the score used in order to help to improve the
learning rate U =
errors rate
good decision
To provide decision the agent may compute the
following steps (cf. Figure 7 and Figure 8) by taking
into account its constraints and the agrometeorology
parameters. This help us to refine the crop calender.
6 CROPPING CALENDAR
PROPOSAL
To obtain the agrometeorology parameters we used a
set of trusted open source database like powerlarc.
Dates (month/day/year): From 01/01/2000 to
12/31/2023
Location: Latitude 14.1635 Longitude -16.1268
The parameter(s)collected are:
• PS = Surface Pressure (kPa)
• QV2M = Specific Humidity at 2 Meters (gkg)
• T2M MAX = Temperature at 2 Meters Maximum (C)
• T2M MIN = Temperature at 2 Meters Minimum (C)
• WS2M MAX = Wind Speed at 2 Meters Maximum
(ms)
• WS2M MIN = Wind Speed at 2 Meters Minimum (ms)
• PREC = Precipitation Corrected (mmday)
Machine Learning for a Better Agriculture Calendar
311
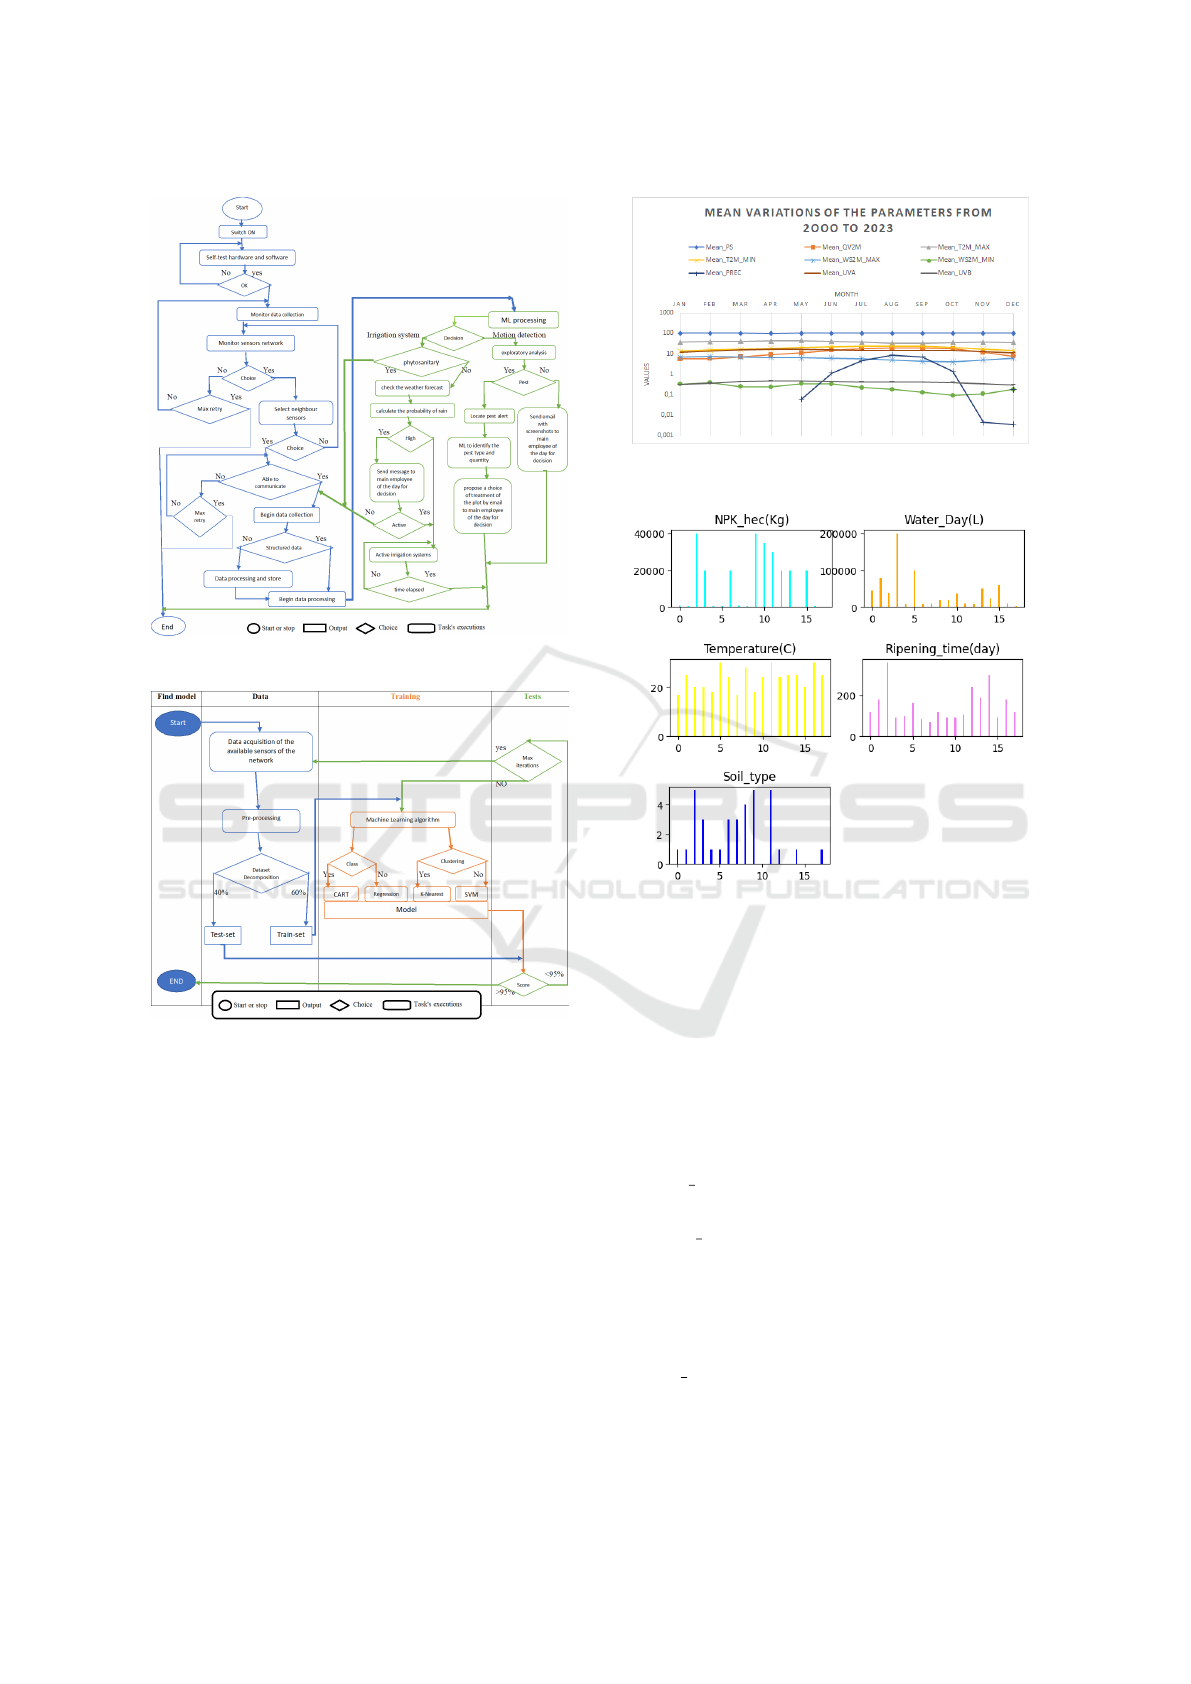
Figure 7: Agent’s main steps.
Figure 8: Agent’s Machine Learning processing.
• UVA = All Sky Surface UVA Irradiance (Wm
2
)
• UVB = All Sky Surface UVB Irradiance (Wm
2
)
Temperatures in Senegal, range from very warm
to hot, with an annual average temperature of 35 Cel-
sius. At least 4 months of the year are tropical and
frequently sultry with temperatures above 35 Celsius.
The distribution of crop types grown in Senegal cor-
relates with the timing of seasonal rainfall (figure
9 and figure 14). Moreover, some of the practices
of the Green Revolution, especially the use of mod-
ern crop varieties and the addition of synthetic fer-
tilizers and pesticides/herbicides are not sustainable
practices, especially under climate change conditions.
NPK(nitrogen, phosphorus, potassium) input are the
most important parameters in maximizing yields and
economic returns to farmers. However, in the peanut
Figure 9: The study of the mean variations of the parameters
from 2000 to 2023.
Figure 10: Comparative study of the needs of speculation.
basin it is required to take into account to the soil pH
(potential of hydrogen) and salinity ((Electro Conduc-
tivity)) for agriculture calendar. In Figure 10, the se-
quence of bars represents the following speculations
list :
1-Carrot, 2-Sweet potato, 3-Eggplant, 4-Lettuce, 5-
Cabbage, 6-Okra, 7-Tomato, 8-Turnip, 9-Melon, 10-
Zucchini, 11-Cucumber, 12-Bell pepper, 13-Chilli,
14-Onion, 15-Cassava, 16-Potato, 17-Hibiscus sab-
dariffa, 18-Parsley. For each speculation we consider:
• NPK
hec(Kg): nitrogen, phosphorus, potassium
for each hectare.
• Water Day(L): stream-day water requirements
(litre).
• Temperature(C): Temperature (Celsius).
• Light(UV): Means of Ultraviolet (UVA and
UVB).
• Soil type: Soil type (e.g. tropical ferruginous
soils, hydromorphic soils, loamy soils, clay soils,
etc.).
ICSOFT 2024 - 19th International Conference on Software Technologies
312
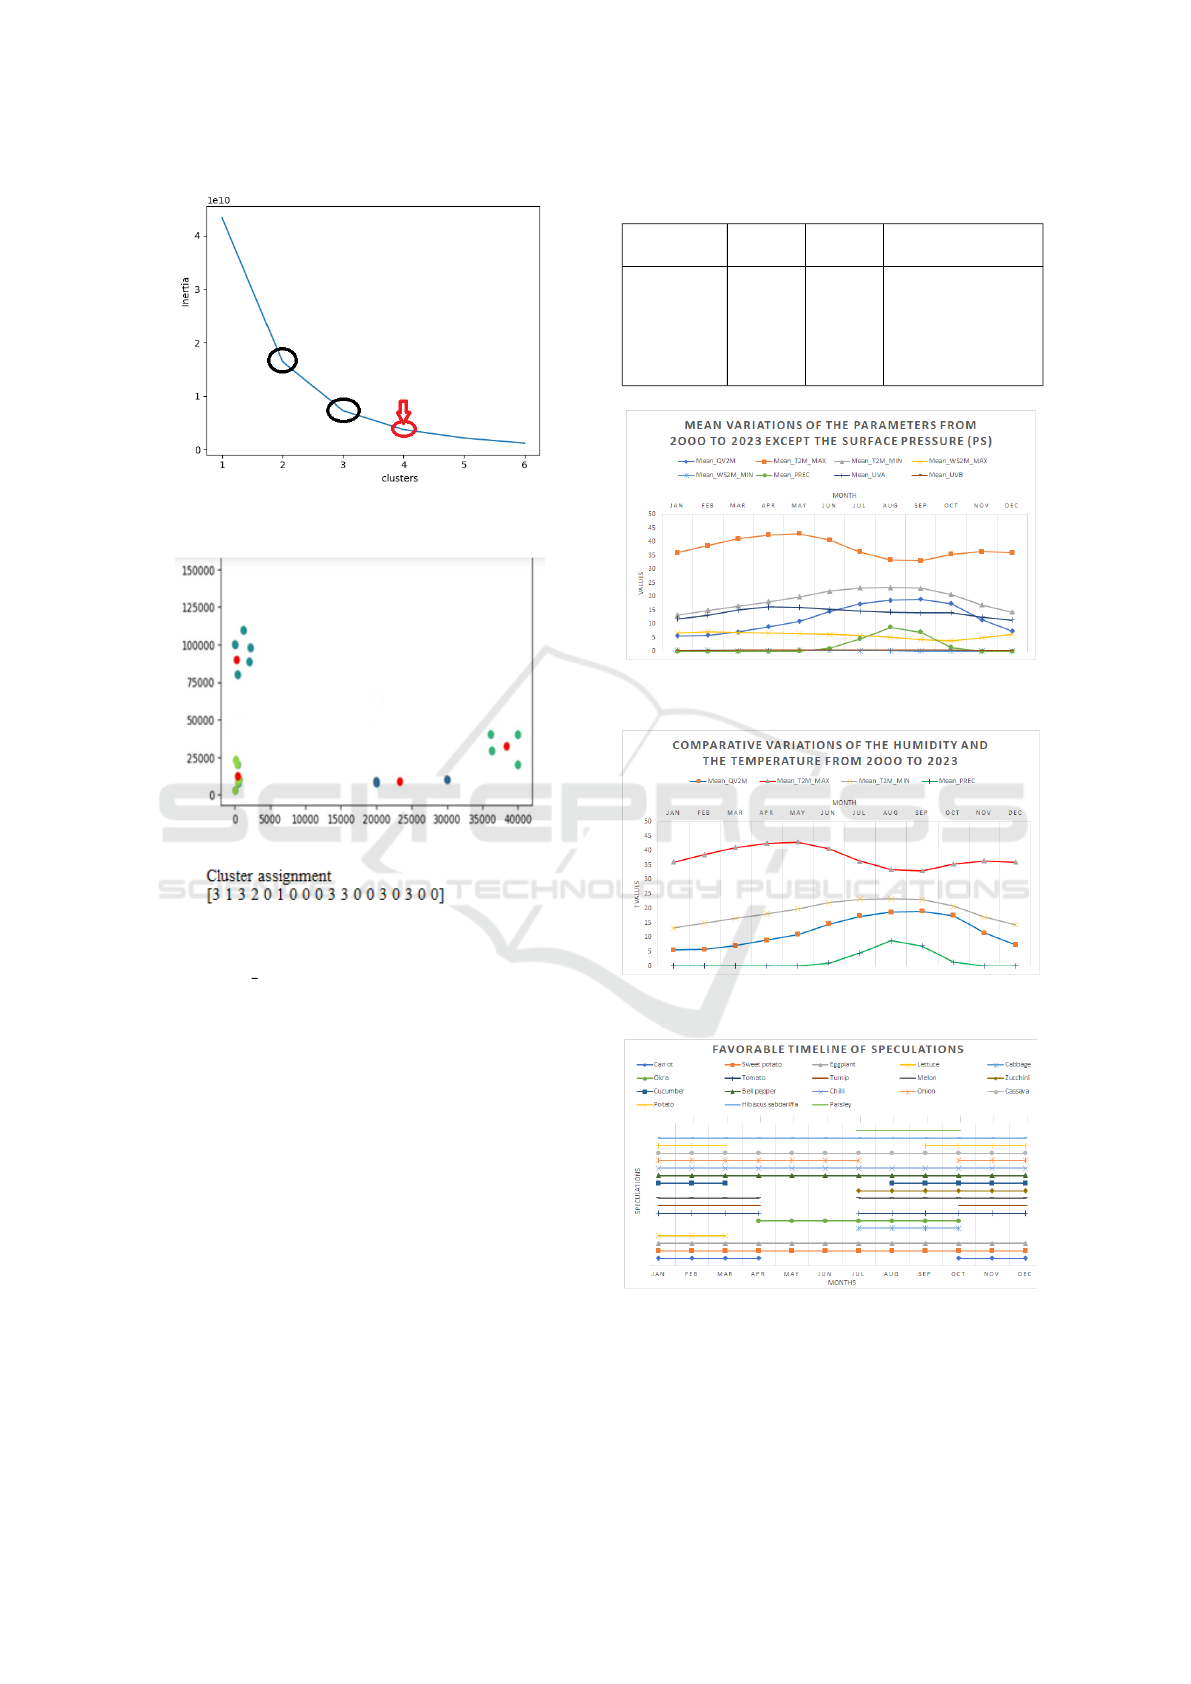
Figure 11: Elbow Method to evaluate the optimal cluster
number.
Figure 12: Output of the clustering.
• Ripening time(day): Number of days before har-
vest.
• Salinity tolerance: Electro conductivity (EC).
After this comparison of needs, we used an AI cluster-
ing algorithm (KMeans) in order to find the similari-
ties in the following crops. In order to be sure about
the better number of clusters with these data, we used
also the Elbow method (Umargono et al., 2020). Fig-
ure 11 shows that, the optimal number of clusters with
our data is four.
Figure 12 shows the similarity between a set of
speculations regarding the parameters that are deter-
mining the crop adaptation.
Depending to the analyse of the figure 9, figure 13
and figure 14, we propose the following crop calender
(figure 15) by taking into account the possibility of an
out-of-season cultivation. This in order to overcome
the abandonment of agricultural perimeters or an agri-
culture depending on the raining season. This figure
15 in combination with the figure 12 permit to find a
Table 1: Cluster assignment by similarity.
Cluster 1
Cluster
2
Cluster
3 Cluster 4
Carrot,
Eggplant,
Zucchini,
Cucumber,
Onion,
Potato
Sweet
potato,
Okra Lettuce
Cabbage, Tomato,
Turnip, Melon, Bell
pepper, Chilli,
Cassava, Hibiscus
sabdariffa, Parsley
Figure 13: The study of the mean variations of the parame-
ters from 2000 to 2023 except the surface pressure (PS).
Figure 14: Comparative variations of the humidity and the
temperature from 2000 to 2023.
Figure 15: Agricultural calendar for a good distribution of
farm activities over seasons.
set of other speculations adaptable in the peanut basin
when the salinity (Electro Conductivity) is between
0.1 and 1.2 and Ph (Potential of Hydrogen) between
5 and 8.
Machine Learning for a Better Agriculture Calendar
313

7 CONCLUSION
In Senegal, particularly in his peanut basin, agricul-
ture is subsistence, low-input, and significantly less
mechanized than many other parts of the country, and
is also highly dependent on soil, climate, soil salin-
ity and water. In addition, due to the lack of the use
of new field in agriculture like data-sciences, artificial
intelligence, etc. the distribution of crop types grown
correlates with the timing of seasonal rainfall. In this
work, we provide a set of mechanisms that uses a set
of trust database of agro-climatic parameters and a set
of artificial intelligence algorithm in order to assess
agricultural calendar for a good distribution of agri-
culture activities over time and find the relationship
between crops. Our results show the effectiveness
of our solution. That means, taking these data into
account makes possible to understand crops depen-
dencies and anticipate the agroecological phenomena,
the crop diseases and pests that impact the planning
of production facilities and variations in agricultural
yields.
In the future we aim to disseminate this technique
in the other agroecological area of the Senegal. In-
corporate an analysis of the socio-economic impact
of our agricultural calendar on local communities by
selecting performances metrics and comparison with
traditional methods. As we have already done the
tests on the peanut basin of Senegal, it would be valu-
able to discuss the scalability of the approach to other
regions and crops. And, the work will be expanded
to potential collaborations to further develop and im-
plement. In addition, to refine our predictions we aim
to compare our methods with the tools provided by
FAO (CROPWAT and CLIMWAT) (Food and of the
United Nations, 2023) to measure positive or negative
deviations from the predictions.
REFERENCES
Cheng, W., andXiaoting Wang, T. M., and Wang,
G. (2022). Anomaly detection for internet of
things time series data using generative adversar-
ial networks with attention mechanism in smart
agriculture. Frontiers in Plant Science, page
https://doi.org/10.3389/fpls.2022.890563.
Faye, P. F., Sall, M. M., Dembele, B., and Faye, J. A. A.
(2023). Plateforme num
´
erique de guides culturaux
dans un contexte de changement climatique et de
baisse des rendements agricoles. RAMReS Sciences
des Structures et de la Mati
´
ere, pages vol. 7, no. 1, pp.
85–115, ISSN : 2630–1180.
Faye, P. F., Senghor, M., and Ndione, G. A. (2022). Stable
trade coordinations in smart agriculture. International
Joint Conference on Web Intelligence and Intelligent
Agent Technology (WI-IAT), pages 215–222.
Feng, Q., Wang, S., Wang, H., Qin, Z., and Wang,
H. (2022a). Circle fitting based image segmen-
tation and multi-scale block local binary pattern
based distinction of ring rot and anthracnose on
apple fruits. Frontiers in Plant Science, 13:doi:
10.3389/fpls.2022.884891.
Feng, Z., Wei, Q., Ye, Z., Yang, B., Gao, Y., Lv, J.,
Dai, Y., Bao, J., and Yao, Q. (2022b). Vibrational
courtship disruption of nilaparvata lugens using arti-
ficial disruptive signals. Frontiers in Plant Science,
13:https://doi.org/10.3389/fpls.2022.897475.
Food and of the United Nations, A. O. (2023). Land and
water databases and software.
Fu, L., Li, S., Rao, Y., Liang, J., Teng, J., and He, Q. (2022).
A novel heuristic target-dependent neural architecture
search method with small samples. Frontiers in Plant
Science, page 10.3389/fpls.2022.897883.
Ma, F., Yao, H., Du, M., Ji, P., and S, X. (2022). Distributed
averaging problems of agriculture picking multi-robot
systems via sampled control. Frontiers in Plant Sci-
ence, page https://doi.org/10.3389/fpls.2022.898183.
Maia, R. F., Lurbe, C. B., and Hornbuckle, J. (2022).
Machine learning approach to estimate soil matric
potential in the plant root zone based on remote
sensing data. Frontiers in Plant Science, page
https://doi.org/10.3389/fpls.2022.931491.
Paswan, R. P. and Begum, S. A. (2013). Regression and
neural networks models for prediction of crop produc-
tion. International Journal of Scientific and Engineer-
ing Research, pages Volume 4, Issue 9,ISSN 2229–
5518.
Sellam, V. and Poovammal, E. (2010). Prediction of crop
yield using regression analysis. IEEE Trans. Knowl.
Data Eng., pages vol.23, no. 10, pp. 1498–1512.
Sun, G., Liu, S., Luo, H., Feng, Z., Yang, B., Luo, J., Tang,
J., Yao, Q., and Xu, J. (2022a). Intelligent monitor-
ing system of migratory pests based on searchlight
trap and machine vision. Frontiers in Plant Science,
13:https://doi.org/10.3389/fpls.2022.897739.
Sun, M., Xu1, L., Luo, R., Lu, Y., and Jia, W. (2022b).
Fast location and recognition of green apple based
on rgb-d image. Frontiers in Plant Science, 13:doi:
10.3389/fpls.2022.864458.
Umargono, E., Suseno, J. E., and K., V. G. S. (2020).
K-means clustering optimization using the elbow
method and early centroid determination based-on
mean and median. International Conferences on In-
formation System and Technology (CONRIST 2019,
DOI: 10.5220/0009908402340240:pages 234–240.
Uyeh, D. D., Iyiola, O., Mallipeddi, R., Asem-Hiablie,
S., Amaizu, M., Ha, Y., and Park, T. (2022). Grid
search for lowest root mean squared error in pre-
dicting optimal sensor location in protected culti-
vation systems. Frontiers in Plant Science, page
https://doi.org/10.3389/fpls.2022.920284.
Zhang, L., Lei, L., and Yan, D. (2010). Comparison of
two regression models for predicting crop yield. IEEE
International Symposium on Geoscience and Remote
Sensing (IGARSS).
Zingade, P. D., Buchade, O., Mehta, N., Ghodekar, S., and
Mehta, C. (2018). Machine learning-based crop pre-
diction system using multi-linear regression. Interna-
tional Journal of Emerging Technology and Computer
Science(IJETCS), pages Vol 3, Issue 2.
ICSOFT 2024 - 19th International Conference on Software Technologies
314
