
On the Robustness of Correlation Network Models in Predicting the
Safety of Bridges
Prasad Chetti
1
and Hesham Ali
2
1
Northwest Missouri State University, U.S.A.
2
University of Nebraska at Omaha, U.S.A.
Keywords: Bridge Safety, National Bridge Inventory, Correlation Network Model, Deterioration Rates, Risk Management.
Abstract: The problem of assessing the safety of bridges and predicting potential unacceptable deterioration levels
remains one of the major problems in civil engineering. This work provides a comprehensive evaluation of
the Correlation Network Model (CNM) in safety assessment and the prediction of potential safety hazards of
bridges. The study applies a population analysis approach to compare individual or cluster performance
against a larger set of peers. The CNM outcomes were validated using a linear regression model and a
robustness analysis, resulting in a high level of consistency in identifying bridge clusters with different
deterioration rates, and thereby identifying clusters with high- risk and low risk bridges. This process allows
for the detection of significant parameters affecting bridge deterioration. The findings affirm the CNM's
capability in capturing complex relationships between input parameters and bridge deck conditions, which
exceeds the capabilities of simple linear regression models. Furthermore, the CNM's robustness, under various
conditions and assumptions, is confirmed. The study demonstrates the potential of CNM as an effective tool
for strategic planning and for efficient resource allocation, enabling focused maintenance and repair
interventions on bridge infrastructures that could potentially extend their service life.
1 INTRODUCTION
Every year, the U.S. Federal Highway
Administration (FHWA) collects data on the
condition ratings of more than 600,000 bridges. The
data document over 100 parameters for each bridge
in the National Bridge Inventory (NBI) database
(FHWA ASCII format, 2023) and the definitions of
these parameters are given in the "Recording and
Coding Guide for the Structure Inventory and
Appraisal of the Nation's Bridges" (FHWA coding
guide, 2023). This wealth of data presents a
significant big data challenge, requiring effective
analysis techniques. One essential parameter is the
condition rating, which is represented by a numerical
value ranging from 0 to 9. A rating of 9 signifies
excellent bridge condition, while a rating of 0
indicates that the bridge has failed. Ensuring public
safety and promoting economic growth are crucial
drivers for governments to prioritize the maintenance
and safety of transportation infrastructure,
particularly bridges. However, the current state of
bridges in the United States has raised concerns.
According to the American Society for Civil
Engineers (ASCE, 2021) report card, U.S. bridges
received a 'C' grade, indicating the need for sufficient
funds to ensure safety and optimal distribution of
those funds to address critical bridges first (ASCE
report card, 2021). With 42% of bridges being 50
years or older, 7.5% are classified as structurally
deficient, and an estimated $125 billion is required
for backlog bridge repairs, making it essential to
allocate funds effectively. To achieve this, a
comprehensive understanding of factors influencing
bridge safety is necessary, including structural
condition, age, materials used, design, exposure to
environmental factors (e.g., corrosion, weathering),
vulnerability to natural hazards (e.g., earthquakes,
floods), maintenance needs, traffic volume,
functional importance, socio-economic impacts,
available resources, budget constraints, stakeholder
preferences, and decision-making tools.
Additionally, accounting for geographical, material,
and design effects on bridge deterioration rates is
crucial. Various bridge deterioration models were
developed in the past to assess bridge performance
(Hatami & Morcous, 2011). However new data
driven approaches, such as the correlation network
Chetti, P. and Ali, H.
On the Robustness of Correlation Network Models in Predicting the Safety of Bridges.
DOI: 10.5220/0012692800003708
Paper published under CC license (CC BY-NC-ND 4.0)
In Proceedings of the 9th International Conference on Complexity, Future Information Systems and Risk (COMPLEXIS 2024), pages 107-113
ISBN: 978-989-758-698-9; ISSN: 2184-5034
Proceedings Copyright © 2024 by SCITEPRESS – Science and Technology Publications, Lda.
107

models, have recently been developed by researchers
to identify the similarities in the bridge deteriorations
with respect to various bridge parameters (Chetti &
Ali, 2020; Chetti & Ali, 2019; Fuchsberger & Ali,
2017; Chetti et al., 2021).
Correlation network models (CNM) have
demonstrated their effectiveness in various domains
such as social networks and finance. In the context of
social networks, CNM has been used to identify early
opinion leaders on platforms like Twitter during the
COVID-19 pandemic (Hatami et al., 2021).
Similarly, in finance, correlation networks, combined
with population analysis, have been employed to
analyze the impact of crises on different sectors
(Hatami et al., 2023). In recent years, several
researchers have leveraged CNM and population
analysis to highlight the advantages of using
population analysis for identifying enriched
parameters and estimating inspection frequencies of
bridges within specific clusters parameters (Chetti &
Ali, 2020; Chetti & Ali, 2019; Fuchsberger & Ali,
2017). Additionally, it has been emphasized that
smart big data pipelines are necessary to tackle the
challenges associated with civil infrastructure in the
United States (Gandhi et al., 2018). Existing literature
indicates that the combination of CNM and
population analysis serves as a robust, big data model
for visualizing clusters of bridges and their
deterioration rates parameters (Chetti & Ali, 2020;
Chetti & Ali, 2019; Fuchsberger & Ali, 2017; Chetti
et al., 2021).
CNM was introduced by Chetti et al., (Chetti et
al., 2021) for analyzing safety and performance
factors in civil infrastructures, specifically focused on
highway bridges from the United States. The study
utilized correlation network models within
population analysis to understand the impact of
various parameters on bridge safety and deterioration
rates. In their study, Chetti et al. proposed a
population analysis approach, which involves
assessing the performance of an individual element or
community/cluster in comparison to a group of peers
or communities. The methodology they proposed
includes identifying significantly enriched
parameters for different bridge communities, as
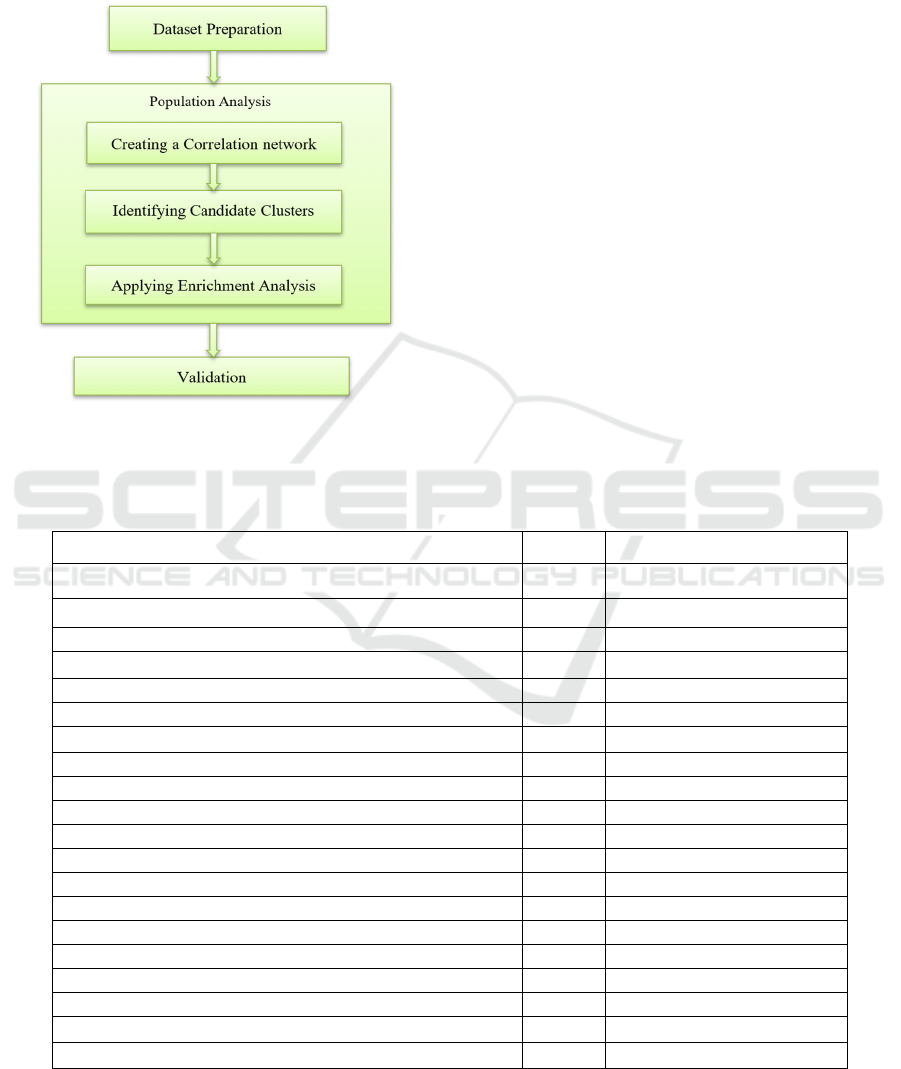
illustrated in Fig. 1. The process consists of three
main steps: dataset preparation, population analysis,
and validation. Within the population analysis, three
specific steps are involved, namely creating a
similarity/correlation network, identifying candidate
clusters (CCs), and applying enrichment analysis.
Using a Spearman ranking correlation coefficient
of at least 0.90, a correlation network was created for
the condition ratings data, with bridges as nodes and
condition rating relationships as edges. The threshold
of correlation coefficient .90 is taken to capture the
clusters with bridges that have very high similarity in
their deterioration behavior. The Markov clustering
(Dongen, 2000) method was used to discern CCs, and
an inflation value of 1.9 was chosen for its modularity
and average deck condition rating differences. Of the
initial 17 clusters, 10, with a median size of 10 or
above, were viewed as CCs, constituting 233 out of
268 bridges as shown in Fig.2. Enrichment analysis
revealed a significant overrepresentation of input
parameters in seven CCs, as shown in Table 1. These
clusters were further divided into above-average and
below-average groups, each associated with
geographical regions, materials used, and factors
indicating high traffic usage and maintenance
effectiveness. However, a common limitation of
CNM for civil infrastructures is its validity. This
current study extends the work done in (Chetti et al.,
2021)
with a validation step, where the validation is
done by comparing CNM produced results with a
linear regression model and through a robustness
analysis.
2 METHODOLOGY
The verification of outcomes from a CNM, using a
population analysis strategy, can be undertaken in
three distinct ways. Initially, it can be accomplished
by scrutinizing existing scholarly works to identify
recurring themes or corroborating evidence. The
second technique contrasts the findings generated by
the CNM against those obtained from a linear
regression model by looking for alignment between
the two. Finally, implementing a robustness analysis
provides a means to assess the consistency and
reliability of the results under various conditions or
presumptions. This article primarily concentrates on
the latter two techniques, as the results were validated
using the existing literature about the durability of
concrete decks using the study done by Chyad et. al.
(Chyad et al., 2018).
2.1 Validation Using Simple Linear
Regression Model
Simple linear regression model can also be used to
validate the deterioration patterns of the candidate
clusters. The dependent variable (Y) is the condition
rating, and the independent variable (Age) is the time
in years. So, the regression equation is:
Y = b0 + b1 * Age (1)
COMPLEXIS 2024 - 9th International Conference on Complexity, Future Information Systems and Risk
108
Using the extrapolation from the regression equation,
one can estimate how a bridge could go to a structural
deficiency status (deck condition rating that is <=4 is
said to be structurally deficient (ASCE report card,
2021).
Figure 1: Methodological Steps of Population Analysis
with Correlation Network Model.
2.2 Validation Through Robustness
Analysis
Robustness analysis tests a model's stability by
evaluating its performance under data perturbations
or variations (Watts & Strogatz, 1998). It ensures that
significantly enriched parameters aren't overly reliant
on selected correlation coefficients. The analysis was
conducted by randomly selecting a percentage of
bridges (90% in this case) to identify the significant
input parameters. This robustness underscores CNM's
reliability in predicting bridge deterioration and
identifying clusters requiring maintenance and repair,
irrespective of differing correlation coefficients.
3 RESULTS
This section examines the outcomes obtained from
the application of the CNM, and its validation using
simple linear regression models, and robustness
analysis. These results highlight the capability of
CNM in predicting future bridge deterioration and
informing effective maintenance planning.
Table 1: Significant parameters of candidate clusters for the Robustness Analysis with 90% bridges selected and with >= .90
correlation.
Parameter CC pair End Avg. Condition Rating
Steel * Midwestern CC24 5.714
Hi
g
hPlains CC64 6.333
Prestr'CncrtCon
t
CC6 6.5
BxBm
_
GrdrSn
g
lSpr
d
CC23 6.555
Prestr'CncrtCon
t
* BxBm
_
GrdrSn
g
lSpr
d
CC23 6.555
Hi
g
hPlains CC23 6.555
N
ortheas
t
CC51 6.576
Prestr'Conc *
N
ortheas
t
* ADT
_
C CC51 6.576
Prestr'Conc * Southern CC3 6.933
Southern CC1 7
Prestr'Conc * St
g
r
_
Ml'bm
_
Grd
r
CC4 7
Prestr'Conc * Southeas
t
CC4 7
StateTollAuthorit
y
CC4 7
CncrtCont's * Southeas
t
* ADT
_
D CC4 7
Prestr'Conc * Southeas
t
* ADT
_
D CC4 7
CncrtCont's * Slab * ADT
_
D CC4 7
Prestr'Conc * St
g
r
_
Ml'bm
_
Grd
r
* ADT
_
D CC4 7
Prestr'Conc * St
g
r
_
Ml'bm
_
Grd
r
* Southeas
t
CC4 7
CncrtCont's * Slab * Southeast * ADT_D
CC4 7
Prestr'Conc * Stgr_Ml'bm_Grdr * Southeast * ADT_D
CC4 7
On the Robustness of Correlation Network Models in Predicting the Safety of Bridges
109
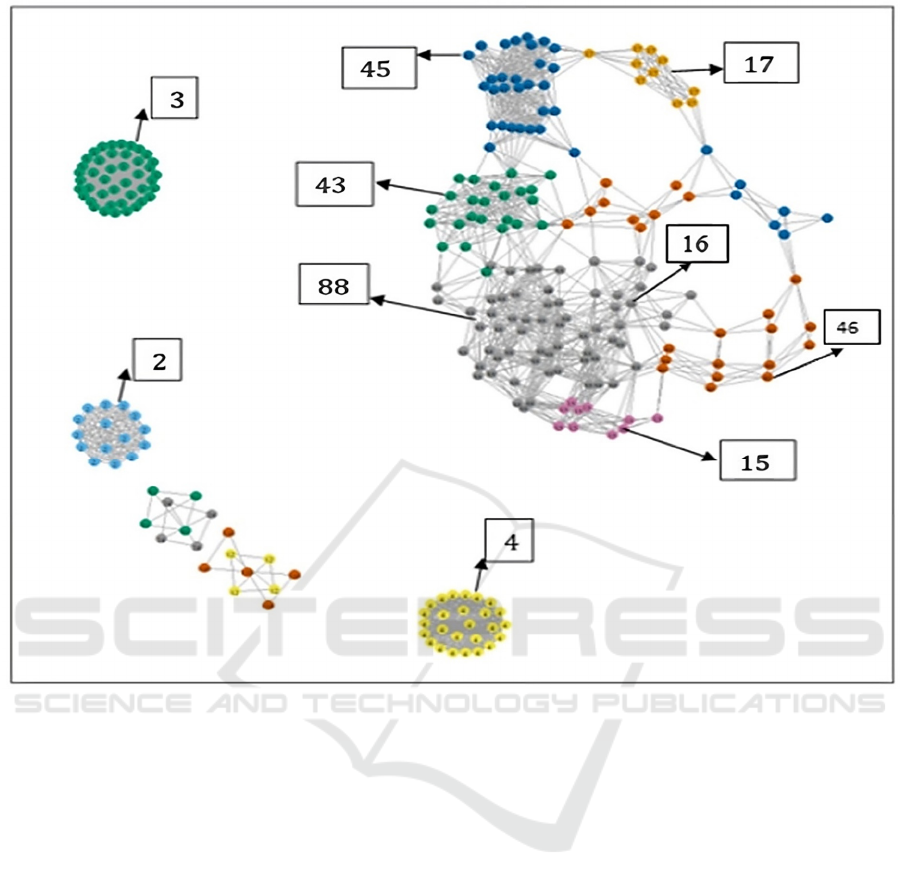
Figure 2: Correlation network of 268 bridges. Clusters with different numbered labels are generated using MCL clustering
algorithm (Chetti, 2023).
The regression models for each significant cluster
gave specific coefficients and statistical measures that
helped understand the lifespan and maintenance
requirements of bridge decks within each cluster. As
seen in Table 2, the β0 coefficient was the mean
response or average deck rating at age zero, indicating
the baseline value of the dependent variable before
age-related changes. The β1 coefficient denoted the
mean response change or average deck rating when
age increased by one unit, suggesting the
relationship's direction and magnitude between
independent and dependent variables. The adjusted
R-Square value measured the regression model's
strength and predictive power and assessed the
model's data fit.
3.1 Validation Using Simple Linear
Regression Model
It is worth noting that all bridges in this study started
with an initial deck condition rating of 9, with the
rating scale being 0-9, and 4 indicating a structurally
deficient status. Thus, the study bridges were initially
in good shape, deteriorating over time. Fast
deteriorating clusters were identified as CC43 and
CC88, with CC43 expected to reach structural
deficiency within the next 12 years, and CC88 within
the next 14 years (as the data started 26 years ago
(Chetti et al., 2021). These bridges are classified as
high-risk bridges based on their deterioration rate.
This data is crucial for prioritizing maintenance and
repairs. Other clusters, like CC15, CC45, CC17, CC4,
and CC3, displayed negative relationships between
age and average deck rating, with varying strength
and predictive power. The predicted timelines for
these clusters to reach structural deficiency ranged
from 49 years to over 100 years. These bridges are
classified as low-risk bridges.
Fig. 3 displays the deterioration curves of
significant clusters using simple linear regression. It
illustrates the relationship between average deck
rating and age for each cluster. The x-axis denotes
COMPLEXIS 2024 - 9th International Conference on Complexity, Future Information Systems and Risk
110

bridge deck age in years, and the y-axis indicates the
average deck rating on a 0-9 scale. The figure
highlights the swift decline of CC43 and CC88 as
their average deck ratings decrease rapidly with the
age of the bridge deck. This finding aligns with earlier
predictions suggesting that these clusters will likely
reach structural deficiency status within the next 12
and 14 years, respectively. Other clusters present a
slower decline, demonstrating a more gradual
decrease in their average deck ratings.
3.2 Comparing CNM with Linear
Regression Model
The CNM results were validated by comparison with
linear regression outcomes. The significant input
parameters identified by the CNM were found
consistent with the significant coefficients of the
linear regression models. This consistency
underscored the utility of the CNM in predicting
bridge deterioration and recognizing clusters needing
maintenance and repair.
Both models identified swiftly deteriorating
candidate clusters, specifically CC43 and CC88,
predicted by the linear regression model to reach
structural deficiency within 12 and 14 years,
respectively. These clusters were also identified as
underperforming by the CNM, signifying their faster
deterioration, potentially due to certain enriched input
parameters. Additionally, prior literature affirmed
that certain geographic regions, like the Midwest,
suffer from inferior bridge deck conditions (Chyad et
al., 2018), reinforcing the need for specific
maintenance and repair interventions. Besides
validating CNM usage, the study illuminated several
CNM benefits over the linear regression model.
These include capturing complex relationships
between input parameters and bridge deck
deterioration, identifying aberrant performance
clusters, pinpointing significantly enriched input
parameters in clusters, and informing efficient
resource allocation for bridge owners and managers
by identifying key clusters and input parameters
contributing to deck deterioration. The robust
validation of the CNM's use in predicting future
bridge deterioration and pinpointing maintenance and
repair intervention clusters was further enhanced by
its comparison with other models and existing
literature.
3.3 Robustness Analysis
Robustness analysis is a technique used to check the
stability of a model by evaluating its performance
when subjected to perturbations or variations in the
data (Watts & Strogatz, 1998). In this study,
robustness analysis was performed on the same set of
deck condition ratings of bridges by taking 90% of
the existing set of bridges with a .90 and above
correlation. The resultant candidate clusters, the ones
with significant parameters, are shown in Table 1.
There are seven candidate clusters with significant
parameters, and the comparison of the main dataset
(the previous dataset with all the bridges) with the
dataset with 90% of the bridges considered for the
robustness analysis indicates that both have the same
number of candidate clusters and similar significant
parameters.
Furthermore, robustness analysis was also
performed by checking other correlation coefficients,
such as >=.70 and >=.80. with correlation coefficient
>=.70. It is observed that there are only two candidate
clusters, indicating that the Midwestern region is
significantly enriched in the low rating cluster
category, while Southern and Southeast bridges are
still in the high-performing candidate cluster
category.
Table 2: Years to get to structural deficiency status.
Cluster β0 coefficient β1 coefficient Adjusted R-Square
Structural Deficiency
Years
CC43 8.962 -0.131 0.899 38
CC88 9.147 -0.13 0.927 40
CC15 9.802 -0.107 0.643 54
CC45 8.63 -0.096 0.654 49
CC17 8.303 -0.071 0.502 61
CC4 7.868 -0.047 0.278 83
CC3 7.597 -0.033 0.181 >100
On the Robustness of Correlation Network Models in Predicting the Safety of Bridges
111
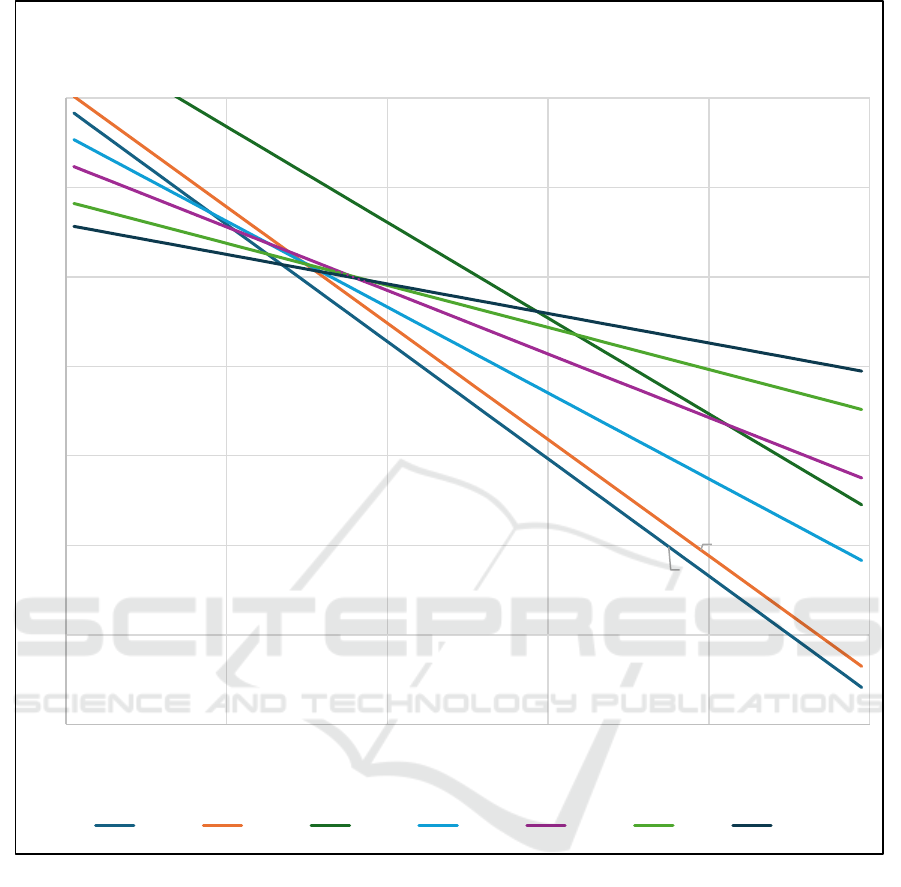
Figure 3: Deterioration curves of the significant clusters using simple linear regression.
Similar results were obtained with correlation
coefficient >=.80. The results show that there are four
candidate clusters with significant input parameters,
with the Steel parameter significantly enriched for the
low-performance cluster, such as CC20, while
Southern and Southeast bridges (along with other
parameters) are still in the high-performing candidate
cluster. These results suggest that the CNM is robust
and consistent in identifying candidate clusters with
significant parameters across different correlation
coefficients, and therefore demonstrating its
reliability in predicting future deterioration of bridges
and identifying clusters in need of maintenance and
repair interventions.
4 CONCLUSION
In conclusion, this research validates the
effectiveness of the CNM in predicting future
deterioration of bridges by using a population
analysis approach. Through the comparison with
linear regression models and robustness analysis, the
study has confirmed the CNM's ability to consistently
identify high and low risk bridge clusters with
different rates of deterioration. In addition, it has been
revealed that the CNM can detect significant
parameters influencing bridge deterioration and
outperforming simple linear regression models in this
3,984
3,947
3,926
2
3
4
5
6
7
8
9
1 11213141
Deck Rating
Age_Years
Deteriorations based on Regression Model
CC43 CC88 CC15 CC45 CC17 CC4 CC3
COMPLEXIS 2024 - 9th International Conference on Complexity, Future Information Systems and Risk
112

regard. Furthermore, the study has demonstrated the
CNM's robustness across different conditions and
assumptions. These findings have considerable
implications for strategic planning and resource
allocation in bridge infrastructure management. The
ability of the CNM to predict future bridge
deterioration, and highlight clusters that require
maintenance and repair interventions, could
potentially enhance the efficiency of these operations
and extend the service life of the bridges. This study
has thus underscored the value of the CNM as an
innovative tool for bridge infrastructure management,
deserving further exploration and application in this
field
.
REFERENCES
ASCE report card on US bridges. https://www.infrastru
cturereportcard.org/wp-content/uploads/2021/01/Bridg
es-Final.pdf (2023, August 15).
Chetti, P., & Ali, H. (2020). Estimating the inspection
frequencies of civil infrastructures using correlation
networks and population analysis. International Journal
on Advances in Intelligent Systems, 13(1&2), 151-162.
Chetti, P. (2023). Analyzing Structural Health of US
Bridges Using Correlation Networks and Population
Analysis (Doctoral dissertation, University of Nebraska
at Omaha).
Hatami, Z., Hall, M., & Thorne, N. (2021). Identifying early
opinion leaders on covid-19 on twitter. In HCI
International 2021-Late Breaking Papers: Design and
User Experience: 23rd HCI International Conference,
HCII 2021, Virtual Event, July 24–29, 2021,
Proceedings 23 (pp. 280-297). Springer International
Publishing.
Hatami, Z., Chetti, P., Ali, H., & Volkman, D. (2024). A
novel population analysis approach for analyzing
financial markets under crisis-a focus on excess returns
of the US stocks under 9/11 and COVID-19. Applied
Economics, 56(9), 1063-1076.
Chetti, P., & Ali, H. (2019). Analyzing the structural health
of civil infrastructures using correlation networks and
population analysis. In Proceedings of the Eighth
International Conference on Data Analytics, Porto,
Portugal.
Federal Highway Administration. (2023, August 15).
https://www.fhwa.dot.gov/bridge/nbi/ascii.cfm
Federal Highway Administration. (2023, August 15).
https://www.fhwa.dot.gov/bridge/mtguide.pdf
Hatami, A., & Morcous, G. (2011). Developing
deterioration models for Nebraska bridges (No. SPR-P1
(11) M302). Nebraska Transportation Center.
Dongen, S. (2000). A cluster algorithm for graphs. CWI
(Centre for Mathematics and Computer Science).
Fuchsberger, A., & Ali, H. (2017). A correlation network
model for structural health monitoring and analyzing
safety issues in civil infrastructures.
Chetti, P., Ali, H., Gandhi, R., Ricks, B., Ghersi, D., &
Najjar, L. (2021). A new approach for analyzing safety
and performance factors in civil infrastructures using
correlation networks and population analysis. Will be
Coming in the Proceedings of the 13th IWSHM.
Chyad, A. M., Abudayyeh, O., Zakhil, F., & Hakimi, O.
(2018, May). Deterioration rates of concrete bridge
decks in several climatic regions. In 2018 IEEE
International Conference on Electro/Information
Technology (EIT) (pp. 0065-0068). IEEE.
Gandhi, R. A., Khazanchi, D., Linzell, D., Ricks, B., & Sim,
C. (2018, May). The hidden crisis: Developing smart
big data pipelines to address grand challenges of bridge
infrastructure health in the United States. In
Proceedings of the... International ISCRAM
Conference.
Watts, D. J., & Strogatz S. H. (1998). Collective dynamics
of ‘small world’ networks. Nature, 393(6684), 440-442.
On the Robustness of Correlation Network Models in Predicting the Safety of Bridges
113
