
Evaluating the Urban Parks Cooling Extent Using Satellite
Observations: An Alternative Approach
Tesfaye Tessema
1,2
, Dale Mortimer
3
and Fabio Tosti
1,2
1
School of Computing and Engineering, University of West London, St Mary’s Road, Ealing, London W5 5RF, U.K.
2
The Faringdon Research Centre for NDT and Remote Sensing, University of West London, London, W5 5RF, U.K.
3
Tree Service, London Borough of Ealing, Perceval House, London, U.K.
Keywords: Green Infrastructure, Satellite Remote Sensing, Landsat-8, Sentinel-2, LST.
Abstract: Green infrastructure is the cooling hub of the built environment in urban settings. These interactions could
contribute towards the reduction of the rise in temperature due to urban heat island effects. It is common
practice to evaluate the cooling extent using onsite observations. Alternatively, satellite data could be a
possible source to perform the former. We analyse and evaluate the extent using the satellite observations.
Intuitively, as we go further from a park, the cooling effect will decrease but this need to be quantified. We
analyse Landsat-8 images to generate a temperature distribution in urban environment. The Land Surface
Temperature (LST) was derived from Landsat-8 and downscaled from 30 m to 10 m using the Sentinel-2
spectral indices in the Greater London area. This gives a relatively high resolution LST variation in urban
environment. A profile over a park was extracted to observe the extent of cooling from the green infrastructure
extends towards the build environment. The cooling effect varies with the park and the effect extends up to
300 m. These observations contribute towards the urban planners to maximise the cooling benefits of urban
parks to promote urban resilience and sustainability.
1 INTRODUCTION
The urbanisation and expansion of built environment
in cities are putting a lot of loads to the heat sinks such
as parks, woodlands, and street trees, collectively
called green infrastructure (GI) (Jeyachandran et al.,
2010; Tessema et al., 2023). As a result, problem such
as the Urban Heat Iceland (UHI) effect and extreme
weather conditions are observed in cities (Almeida et
al., 2021). A high temperature in cities, poses risks to
the public health (Nieuwenhuijsen, 2021). GI play a
vital role in mitigating the UHI and moderate the
thermal variations in urban settings. Quantifying the
extent of GIs in absorbing the heat and improving
thermal comfort of the environment is essential. In
this regard, in addition to the in-situ measurements of
temperature, Earth Observation (EO) satellites can be
used as a tool to investigate surface temperature
variations in urban environments (Mackey et al.,
2012). There are various studies that have evaluated
the GIs effect at different scales (Almeida et al., 2021;
J. C. Jiménez-Muñoz et al., 2014; Mackey et al.,
2012; Vieira Zezzo et al., 2023).
Microscale weather variability study is essential
in urban environment for the wellbeing of the
population live in the cities (Almeida et al., 2021;
Vieira Zezzo et al., 2023). The extreme temperature
above the normal climate range should be monitored
to reduce the impact on public health
(Nieuwenhuijsen, 2021). In addition, the data analysis
on macroscale would contribute to the urban planners
and city councils to plan reducing the extreme heat in
urban settings.
Figure 1: Location map of the study area.
168
Tessema, T., Mortimer, D. and Tosti, F.
Evaluating the Urban Parks Cooling Extent Using Satellite Observations: An Alternative Approach.
DOI: 10.5220/0012693700003696
Paper published under CC license (CC BY-NC-ND 4.0)
In Proceedings of the 10th International Conference on Geographical Information Systems Theory, Applications and Management (GISTAM 2024), pages 168-172
ISBN: 978-989-758-694-1; ISSN: 2184-500X
Proceedings Copyright © 2024 by SCITEPRESS – Science and Technology Publications, Lda.

In this study, we investigate the variability in
temperature in the urban areas and the effect of the
green areas and parks in reducing the variability. As
a show case, we focus on the Greater London area
(Figure 1). The city has a very diverse land use,
functions, and vitality. The GI cooling effects was
quantified based on hyperspectral images of optical
observation satellites. The spatial extent of cooling
effect of selected green space was analysed. Landsat-
8 and Sentinel-2 satellite data was used to analyse the
temperature variation in the city.
2 MATERIAL AND METHOD
2.1 Data
In this research, multispectral satellite imageries of
the Landsat mission by NASA and the Sentinel-2
mission by ESA that are acquired over the London
area were used. The Landsat data is available from
2013 and the Sentinel-2 mission is available from
2015, we used here the overlapping period. Landsat-
8 OLI/TIRS has a native spatial resolution of 30 m for
the eight reflective bands (B1-B7, B9), 15 m for the
panchromatic band (B8), and 100 m for the thermal
bands (B10-B11) (Storey et al., 2014). The Landsat-8
collection 1 Level-2 surface reflectance product was
used to generate spectral indices in 30 m spatial
resolution. The Sentinel-2 MSI Level-2A imagery
was used, and the mission has no thermal band. But it
provides multispectral imagery at a spatial resolution
of 10 m and with a temporal resolution of 5 days
(Drusch et al., 2012). We use the Sentinel-2 data to
analyse and optimize the Landsat-8 data to higher
spatial resolution. The percentage cloud cover over
the images was also considered when we select the
images.
2.2 Method
The heat distribution in urban areas is controlled by a
diverse land cover distribution. The interaction
between the built environment and the green spaces
determines partly the heat dynamics of urban areas.
The thermal band from Landsat-8 allow us to map the
surface thermal radiance at 100 m ground sampling
resolution. The final distribution of the thermal band
is resampled to 30 m spatial resolution by the United
States Geological Survey. LST measures the
emission of thermal radiance from the land surface
where the incoming solar energy interacts with and
heat the ground (Hulley et al., 2019). The surface
thermal radiance of the Landsat thermal band can be
used to calculate the Land Surface Temperature
(LST). LST can be computed using an empirical
relationship between TOA brightness temperatures in
a single TIR channel (Freitas et al., 2013).
LST = A
+B
+C
(1)
Where Tb is the TOA brightness temperature in
the TIR channel, and is the surface emissivity for
the same channel. The coefficients (A
,B
,C
) are
determined from linear regressions of radiative
transfer simulations.
The spectral indices such as NDVI (normalised
difference vegetation index), built-up index (NDBI),
and water index (NDWI) are determined from both
Landsat-8 and Sentinel-2 data (Defries &
Townshend, 1994; Gao, 1996; Onačillová et al.,
2022). The 10 m spatial resolution of indices from
Sentinel-2 have given an opportunity to spatially
downscale the products from Landsat-8. The
downscaling is important in urban and semi-urban
areas to analyse parameters such as LST in high
resolution. In this research, we used the method
proposed by Onačillová et al., (2022) to downscale
the spatial resolution of the LST calculated from
Landsat-8.
3 RESULTS AND DISCUSSION
The hyperspectral images were used to calculate land
cover indices such as NDVI, NDBI and NDWI
(Defries & Townshend, 1994; Gao, 1996; Varshney,
2013). From these indices, surface reflectance
products are derived to determine the land surface
temperature (LST) using Landsat-8. In addition to
this, the Sentinel-2 images were used to derive similar
land cover indices with 10 m resolution. Figure 2
shows the Sentinel-2 NDVI derived from green, red,
and near-infrared band, and the LST derived from the
green, red, near-infrared, and infrared bands from the
Landsat-8 (J. C. Jiménez-Muñoz et al., 2014). We
considered images from both satellites with a
maximum cloud coverage of 20%. As a result of high
cloud cover, we selected very limited images from the
archive. The variation in NDVI in Figure 2 (a) varies
from 0 to -1 from built environment to water bodies
and 0 to +1 from built environment to vegetations.
The NDVI index contributes for dividing the land
cover based on the chlorophyl content of the
vegetations. The white part in NDVI image represents
the built environment. Figure 2 (b) shows the LST
derived from Landsat-8 with a spatial resolution of 30
Evaluating the Urban Parks Cooling Extent Using Satellite Observations: An Alternative Approach
169
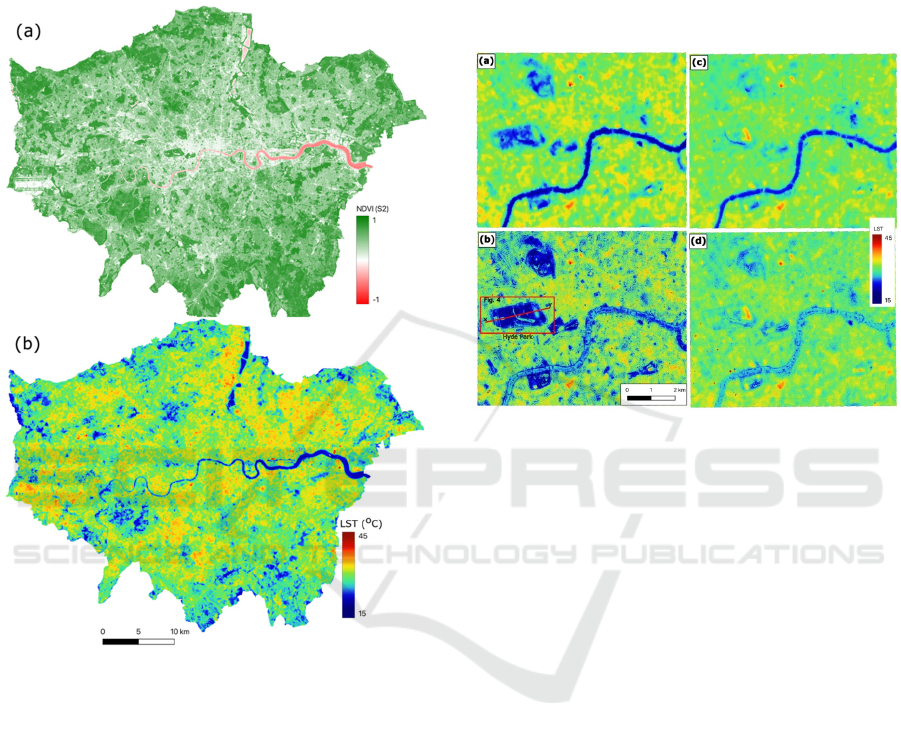
m. The temperature variation shows the average
temperature over the 2023 summertime over the
Greater London area. The temperature represented in
the figure is in degree Celsius and varies from 15
o
C
in water bodies and up to 45
o
C in places dominated
by buildings.
Figure 2: NDVI and LST map for Greater London. (a)
NDVI using Sentinel-2 with a 10 m spatial resolution. (b)
The LST derived from Landsat-8 with a 30 m spatial
resolution. The temperature varies from 15
o
C in water.
To see the variation in temperature at the
microscale, we selected the Central London area as
outlined in the black rectangle in Figure 3 (b). The
LST calculated from the Landsat-8 has a spatial
resolution of 30 m and the derived temperature
variation Figure 3 (a) and (c) acquired on May 26,
2023, and September 15, 2023, respectively. The
temperature difference between these dates on
average is about 5
o
C. The cooling effect of parks are
significant in May as compared to September. The
temperature in the parks in May on average was 15-
20
o
C but in September the average temperature rises
to 30
o
C. The cooling effect of parks in September is
very much reduced and limited to water bodies and
areas with dense trees.
LSTs in Figure 3 (b) and (d) are the downscaled
version which shows relatively variable temperature.
The downscaled map shows clear demarcation
temperature in the parks, built environments, and
linear civil structures. Hyde Park in Central London,
UK, was selected based on its size and complexity.
Figure 3: LST in Central London. On 26-05-2023, (a) is
LST 30 m resolution and (b) LST downscaled using
Sentinel-2 indices. On 15-08-2023, (c) is LST 30 m
resolution and (d) LST downscaled using Sentinel-2
indices.
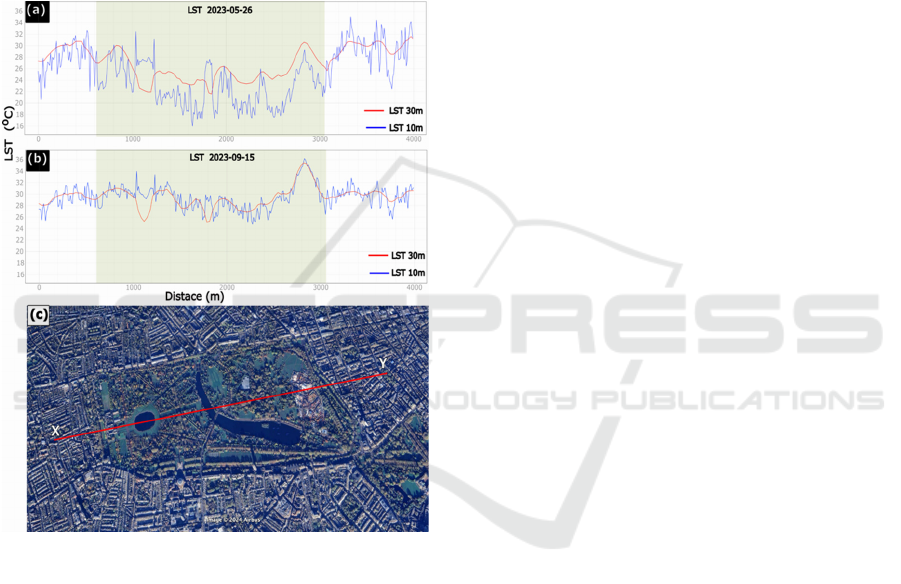
The LST profile was extracted across the park as
shown in Figure 4. Figure 4 (a) and (b) shows the
temperature variation in end May and September
respectively. The LST relatively smoothly vary in the
30 m resolution (the red lines) image profiles and
showed similar pattern in both dates. The downscaled
LST shows a high frequency variability in
temperature but follows a similar general trend with
the 30 m spatial resolution LST profile.
The other important aspect of downscaling of the
LST is that it enables us to identify pocket areas of
anomalously high or low LST areas. For instance, in
Figure 4a and b, the dome shaped high temperature
anomaly at a distance from 2.8 to 3 km on the profiles
is the Winter Wonderland in Hyde Park. Places such
as train stations, large shopping centres and public
centres produces high heat anomaly in the urban
settings.
GISTAM 2024 - 10th International Conference on Geographical Information Systems Theory, Applications and Management
170
4 CONCLUSIONS AND FUTURE
DEVELOPMENT
In this study, we used Landsat thermal signal and
Sentinel-2 observations to calculate the LST. The
LST generated from Landsat at 30 m resolution is
downscaled to 10 m by implementing the spectral
indices of Sentinel-1 to calibrate the Landsat LST.
We compared two dates at the beginning and ending
months of the summer 2023. The LST profile across
the park was extracted and the extent of the cooling
effect was determined.
Figure 4: LST profile on Hyde Park in Central London, UK,
the park extent is highlighted the profile plots with shaded
rectangle. (a) shows the LST in May 2023 and (b) shows
the LST in September 2023, (c) shows the profile and the
RGB image of the area, the profile is shown by the XY red
line.
The cooling effect can be extending up to 300 m
from the border of the park. In addition, our profile
analysis showed that there is a temperature variation
within the park. The limitation in the data coverage is
the percentage of the cloud cover during this period,
and the availability of Landsat images in study area.
This work would also help authorities in developing
countries to support fast growing cities and help them
to balance the urban development and the use of parks
and public spaces towards sustainable and comfort-
oriented practices.
This research will be further developed based on
geostatistical analysis of cooling effects and the
dynamics with the built environment. Validation of
the results with the in-situ weather station database
and other measurement will be done to evaluate the
accuracy of the freely available satellite data for
urban temperature monitoring. The newly launched
thermal satellites such as the UK based satellite
SatVu (SatelliteVu,2024), which has 3.5 m resolution
thermal images would be a potential for further
research endeavors.
ACKNOWLEDGEMENTS
The Authors would like to express their sincere
thanks and gratitude to the following trusts, charities,
organisations and individuals for their generosity in
supporting this project: Lord Faringdon Charitable
Trust, The Schroder Foundation, Cazenove
Charitable Trust, Ernest Cook Trust, Sir Henry
Keswick, Ian Bond, P. F. Charitable Trust, Prospect
Investment Management Limited, The Adrian Swire
Charitable Trust, The John Swire 1989 Charitable
Trust, The Sackler Trust, The Tanlaw Foundation,
and The Wyfold Charitable Trust.
REFERENCES
Almeida, C. R., Teodoro, A. C., & Gonçalves, A. (2021).
Study of the Urban Heat Island (UHI) Using Remote
Sensing Data/Techniques: A Systematic Review.
Environments, 8(10)10.3390/environments8100105
Defries, R., S., & Townshend, J., R.G. (1994). NDVI-
derived land cover classifications at a global scale.
International Journal of Remote Sensing, 15(17), 3567-
3586.
Drusch, M., Del Bello, U., Carlier, S., Colin, O., Fernandez,
V., Gascon, F., Hoersch, B., Isola, C., Laberinti, P.,
Martimort, P., Meygret, A., Spoto, F., Sy, O.,
Marchese, F., & Bargellini, P. (2012). Sentinel-2:
ESA's Optical High-Resolution Mission for GMES
Operational Services. Remote Sensing of Environment.
Freitas, S. C., Trigo, I. F., Macedo, J., Barroso, C., Silva,
R., & Perdigão, R. (2013). Land surface temperature
from multiple geostationary satellites. International
Journal of Remote Sensing, 34(9-10), 3051-3068.
Gao, B. (1996). NDWI—A normalized difference water
index for remote sensing of vegetation liquid water
from space. Remote Sensing of Environment, 58(3).
Hulley, G. C., Ghent, D., Göttsche, F. M., Guillevic, P. C.,
Mildrexler, D. J., & Coll, C. (2019). 3 - Land Surface
Temperature. In G. C. Hulley, & D. Ghent (Eds.),
Taking the Temperature of the Earth (pp. 57-127).
Elsevier.
Evaluating the Urban Parks Cooling Extent Using Satellite Observations: An Alternative Approach
171

J. C. Jiménez-Muñoz, J. A. Sobrino, D. Skoković, C.
Mattar, & J. Cristóbal. (2014). Land Surface
Temperature Retrieval Methods from Landsat-8
Thermal Infrared Sensor Data. IEEE Geoscience and
Remote Sensing Letters, 11(10), 1840-1843.
Jeyachandran, I., Burian, S. J., & Stetson, S. W. (2010).
Estimating Urban Canopy Parameters Using Synthetic
Aperture Radar Data. Journal of Applied Meteorology
and Climatology, 49(4), 732-747.
Mackey, C. W., Lee, X., & Smith, R. B. (2012). Remotely
sensing the cooling effects of city scale efforts to reduce
urban heat island. Building and Environment, 49, 348-
358. 10.1016/j.buildenv.2011.08.004
Nieuwenhuijsen, M. J. (2021). Green Infrastructure and
Health. Annual Review of Public Health, 42(1), 317-
328. 10.1146/annurev-publhealth-090419-102511
Onačillová, K., Gallay, M., Paluba, D., Péliová, A.,
Tokarčík, O., & Laubertová, D. (2022). Combining
Landsat 8 and Sentinel-2 Data in Google Earth Engine
to Derive Higher Resolution Land Surface Temperature
Maps in Urban Environment. Remote Sensing,
14(16)10.3390/rs14164076
SatelliteVu (2024). https://www.satellitevu.com. Retrieved
24 Jan 2024, from https://www.satellitevu.com
Storey, J., Choate, M., & Moe, D. (2014). Landsat 8
Thermal Infrared Sensor Geometric Characterization
and Calibration. Remote Sensing, 6(11), 11181.
10.3390/rs61111153
Tessema, T., Uzor, S., Mortimer, D., & Tosti, F. (2023).
(2023). Estimation of tree height using radar remote
sensing in urban settings: a preliminary result.
https://doi.org/10.1117/12.2684325.
Varshney, A. (2013). Improved NDBI differencing
algorithm for built-up regions change detection from
remote-sensing data: an automated approach. Remote
Sensing Letters, 4(5), 504-512.
Vieira Zezzo, L., Pereira Coltri, P., & Dubreuil, V. (2023).
Microscale models and urban heat island studies: a
systematic review. Environmental Monitoring and
Assessment, 195(11), 1284. 10.1007/s10661-023-
11906-2
GISTAM 2024 - 10th International Conference on Geographical Information Systems Theory, Applications and Management
172
