
SpectraNet: A Neural Network for Soybean Contents Prediction
Henry Julio Kobs
1,2 a
, Henrique Liesenfeld Krever
1,2 b
, Denilson S. Ebling
1,2 c
and Celio Trois
3 d
1
Technology Center, Federal University of Santa Maria, Santa Maria, Brazil
2
Zeit Artificial Intelligence Solutions Ltd., Santa Maria, Brazil
3
Department of Physical and Inorganic Chemistry Engineering, Rovira i Virgili University, Tarragona, Spain
Keywords:
Neural Network, Near-Infrared Spectroscopy, Soybean, Artificial Intelligence.
Abstract:
Soybeans are integral to global agriculture and food production, playing a vital role in human and animal nutri-
tion. Accurate assessment of moisture, oil, and protein contents in soybeans is crucial for various applications,
including human nutrition, animal feed, and food manufacturing. This paper introduces SpectraNet, a Neural
Network architecture designed for predicting soybean contents using Near-infrared Spectroscopy (NIRS) data.
NIRS technology provides a cost-effective and non-destructive means of analyzing agricultural samples. Spec-
traNet leverages a 1D convolutional Neural Network and multiple prediction heads, demonstrating its efficacy
in handling non-linearities present in spectral data. The architecture’s flexibility and adaptability contribute to
accurate predictions, automatic feature extraction, and suitability for varying conditions. Comparative anal-
ysis with traditional Partial Least Squares Regression (PLSR) models reveals the superior performance of
SpectraNet in predicting protein, moisture, and oil contents in soybeans. The presented methodology involves
comprehensive data collection, laboratory analysis, and model training, showcasing the potential of SpectraNet
for real-world applications in agriculture. The results highlight the efficiency and precision of SpectraNet, of-
fering a valuable tool for advancing agricultural practices and ensuring soybean quality.
1 INTRODUCTION
Soybeans (Glycine max) play a crucial role in global
agriculture and food production, contributing signif-
icantly to both human and animal nutrition. Under-
standing and monitoring the contents of moisture, oil,
and protein in soybeans are essential for human nutri-
tion (Young et al., 1979), animal feed (Willis, 2003),
and food manufacturing (Wilson, 1995).
Understanding the moisture, oil, and protein con-
tents of soybeans is essential for ensuring the quality
of the crop, facilitating effective agricultural manage-
ment, and meeting the diverse needs of the food and
feed industries. However, the traditional approaches
are often time-consuming since it needs to be sent to
a certified laboratory, and it can take up to weeks to
get the results ready. By using Near-infrared Spec-
troscopy (NIRS) technology, the results are readily
available, improving the food chain. NIRS, in particu-
lar, is widely used in various fields, including agricul-
a
https://orcid.org/0009-0007-9834-6235
b
https://orcid.org/0000-0002-5791-5557
c
https://orcid.org/0000-0002-3094-5991
d
https://orcid.org/0000-0002-7386-9749
ture, pharmaceuticals, and environmental monitoring.
Portable Near-infrared Spectroscopy is a technol-
ogy that can be used in agricultural systems, and pre-
cision agriculture, since it is cheaper than traditional
analysis, non-destructive, easy to carry, and time-
saving for use in many applications (Batten, 1998).
It involves the measurement of interactions between
electromagnetic radiation and matter, providing valu-
able information about the composition of substances.
Near-infrared (NIR) is used with data analysis al-
gorithms that learn the relationship between the sam-
ple composition and NIR spectra (Zhang et al., 2022).
These data often show complex relationships and
non-linear patterns, making modeling difficult. How-
ever, as stated by (Ghosh et al., 2019), Neural Net-
works (NN) are particularly well-suited for learning
and processing data from spectroscopy, as these net-
works can learn intricate spectral features and rela-
tionships that might be challenging for traditional an-
alytical methods. So, the NIRS in conjoint with NN,
can be used to determine characteristics like mois-
ture, oil, and protein contents in soybean. Making
it an easy to use, efficient, reliable, and cheap way of
knowing soy contents without the need of a sample
502
Kobs, H., Krever, H., Ebling, D. and Trois, C.
SpectraNet: A Neural Network for Soybean Contents Prediction.
DOI: 10.5220/0012697600003690
Paper published under CC license (CC BY-NC-ND 4.0)
In Proceedings of the 26th International Conference on Enterprise Information Systems (ICEIS 2024) - Volume 1, pages 502-509
ISBN: 978-989-758-692-7; ISSN: 2184-4992
Proceedings Copyright © 2024 by SCITEPRESS – Science and Technology Publications, Lda.
being taken into the lab for strict measurements.
This paper presents SpectraNet, a new NN ar-
chitecture which is capable of dealing with NIRS
data and its non-linearities for predicting the contents
of soybean with a better accuracy than the works in
the known literature. SpectraNet offers a powerful
and flexible approach for learning from spectroscopy
data, enabling accurate predictions, automatic fea-
ture extraction, and adaptability to varying conditions.
Through an empirical comparison between Partial
Least Squares Regression (PLSR) model and Spec-
traNet, it is demonstrated the superior performance
of SpectraNet in predicting soybean contents, encom-
passing moisture, oil, and protein.
The presented results manifest a tangible improve-
ment in the prediction errors for all contents pre-
dictions in this work, comparing the performance
of SpectraNet with the traditional PLSR model.
Specifically, our approach achieved a Root Mean
Square Error (RMSE) of 0.75 for protein, showcas-
ing a notable enhancement over the PLSR model,
which yielded an RMSE of 1.10. For oil content
prediction, SpectraNet outperformed the traditional
PLSR model, achieving an RMSE of 0.50 compared
to PLSR’s 0.72. In moisture content prediction, our
network excelled with an RMSE of 0.31, showcasing
its superior accuracy over PLSR, which had an RMSE
of 0.73.
This work is organized as follows: Section 2, de-
scribes the domain where the model applies, explains
the background behind this work. Section 3 details
the solution developed to approach the problem. Sec-
tion 4, presents and discusses the results obtained
by the developed solution, Section 5 presents related
works and comparisons, and at last, Section 6 presents
a closure to this work.
2 SOYBEAN NIRS DATASET
NIRS sensors are commonly used for analyzing
chemical (Ortega et al., 2021) and compositional
properties (Hell et al., 2016) of materials by measur-
ing the absorption of Near-infrared light. However,
differences in the optical characteristics of these sen-
sors can introduce variability, impacting the accuracy
and reliability of measurements. The Near-infrared
Spectroscopy was used in portable sensors that had
a wavelength in the ranges 900 nm to 1700 nm and
physical resolution of 10 nm and digital resolution of
3.1 nm divided into 256 segments.
A total of 745 soybean samples were sourced
from diverse geographical locations and cultivation
practices to ensure representativeness for many years
(from 2020 to 2024) in Brazil. Care was taken to se-
lect samples with varying maturation stages and con-
ditions. Prior to analysis, all samples were thoroughly
cleaned and sorted to remove impurities and foreign
materials, then the samples were loaded on top of the
recipient for further analysis. Since many calibra-
tions errors may occur because of changes in moisture
over time, before the actual readings, samples went
through weight measurement to ensure moisture con-
tent correctness.
Spectral data for each soybean sample was
recorded using a Near-infrared Spectroscopy (NIRS)
device, employing a portable sensor with a spectral
range from 900 nm to 1700 nm and a resolution of
10 nm. Each sample was individually scanned, and
the resulting spectra were recorded and stored in a
dedicated database for subsequent analysis. When the
soybean samples were loaded into the portable NIRS,
the sample spun while the sensor took the readings
about the light reflecting off the soybean, these read-
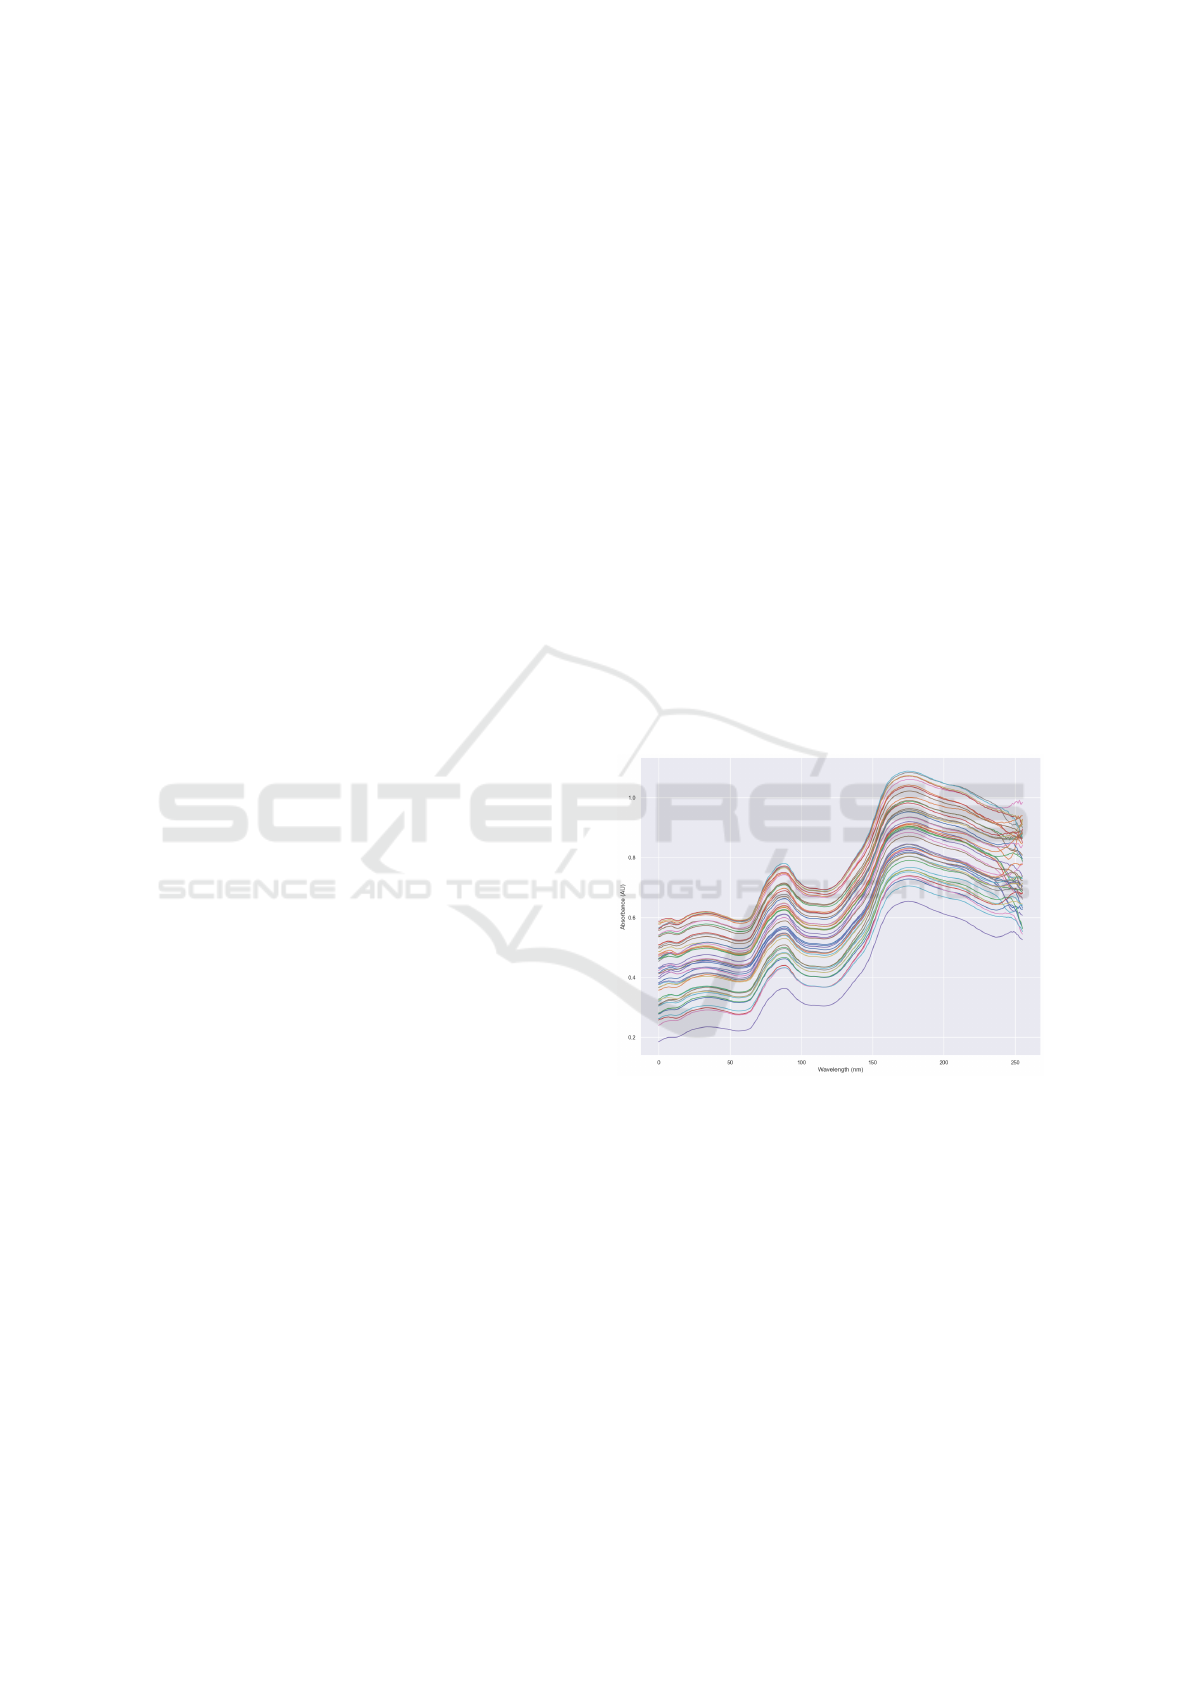
ings resulted in spectral data presented in the Figure 1.
As it can be seen, there are 2 peaks in the spectrum
as well as perceivable shift variance, this spectrum is
very similar to the one found in (Aulia et al., 2022).
Figure 1: Spectral data of soybean.
The same set of soybean samples underwent
comprehensive laboratory analysis to determine their
moisture, oil, and protein contents, only a part of
them were kept on premises for backup. Standard-
ized methods were employed to ensure accuracy and
precision in the measurements. All samples were sent
to a certificate laboratory in which official methods
were applied: Ac 4-91 (Nitrogen and Protein in Soy-
beans, Modified Kjeldahl Method), Ac 3-44 (Oil in
Soybeans) and Ac 2-41 (Moisture and Volatile Matter
in Soybeans) from AOCS (American Oil Chemists’
Society).
Out of these 256 segments of the spectrum, the last
SpectraNet: A Neural Network for Soybean Contents Prediction
503

19 where cut off because they ended up adding more
noise into the NN as well as the PLS and did not give
any useful information, as it can be seen in Figure 1,
so those segments where just discarded. Spectral data
can have noise for various reasons (Xu et al., 2019),
such as temperature, light from the ambient, incorrect
calibration of the sensor and sensor optics variability
can be factors that turn data gathering harder.
3 SPECTRANET
Neural Networks, because of their capability of deal-
ing with non-linear data, are being used in many bi-
ology related fields (Almeida, 2002). Spectroscopy
is not different, the data is non-linear, and because of
this, Neural Networks are shown to have better results
than traditional regression models. This being the rea-
son why NN was chosen to be used on this work, since
they are able to better comprehend the data.
The Neural Network in SpectraNet consists of a
1D convolutional network, since convolutional net-
works are best suited for working with array like data.
They are shown to be, more compact, easy to train and
more efficient as well as the state-of-the-art in signal
processing applications given the fact that 1D CNNs
can work with scarce data (Kiranyaz et al., 2021; Ki-
ranyaz et al., 2019). Different from 2D CNNs that
need big data to work properly (Schroff et al., 2015),
1D CNNs are an interesting option for spectroscopy
applications since acquiring data and validating it is
expensive, given the fact that the samples have to be
sent to a lab for the analysis of the moisture, protein,
and oil contents in the soybean.
Our CNN has as presented in the Figure 2 three
preprocessing layers, the first one is Standard Nor-
mal Variate (SNV), as shown in (Guo et al., 1999)
is a robust way to improve results on pattern recogni-
tion from NIR data, the second layer, is the Standard
Scaler which does the same as the SNV, the differ-
ence is, that while the SNV does the preprocessing on
the feature’s axis, the Standard Scaler does the pre-
processing on the batch axis, and the third layer is the
Gaussian Noise layer is necessary for the regulariza-
tion of the data, adding some noise to the data, our
parameter of noise is 0.01.
Then our CNN has the convolutional layers, the
first one has an input of 1 channel the spectral data,
and an output of 16 channels with kernel size 8, then
our activation function, followed by a max pooling
layer with kernel size and stride of 2, followed by an-
other convolutional layer, which has input of 16 and
output of 32 channels, with a kernel size of 16, with
again the activation function and max pooling layer
that have the same parameters as the one before.
Finally, we get to the end of the architecture which
uses a dropout of 50%, and is followed by simple 2
linear layers with the Exponential Linear Unit (ELU)
activation function, the last layer of the architecture
consists of multiple heads, each responsible for pre-
dicting protein, oil and moisture, separately. For
building the neural network architecture and defin-
ing the hyperparameters, we followed the methodol-
ogy stated by (Goodfellow et al., 2016). This neu-
ral network is trained altogether, because of mass bal-
ance (Preece et al., 2017), it is easier to learn the rela-
tionship between the different contents. For example,
given the spectrum of a sample with higher moisture
content, considering the mass balance, the protein and
oil values are lower.
Then the technique for data augmentation pro-
posed by (Bjerrum et al., 2017) was used on the
dataset. The augmentation consists of a random shift
on the spectrum of the sample using the standard de-
viation of the dataset as the shift parameter and a ran-
dom scaling by a scaling factor drawn from the same
distribution, and all samples were repeated 20 times.
This augmentation process was only made on the cal-
ibration dataset, and not on the validation one.
Besides the Neural Network Architecture, this
work used the Huber Loss as the loss function,
the Huber loss function is known for its robustness
against outliers in the training dataset. Furthermore,
L
2
-regularization was used, with the weight decay of
1e-5. For the optimizer, the Adam optimizer was used
with a learning rate of 4e-5.
Calibration models were developed using mul-
tivariate regression techniques to establish relation-
ships between the recorded NIRS spectra and the lab-
oratory reference values. Partial Least Squares (PLS)
regression, a widely accepted method for NIRS cali-
bration, was employed. The dataset was divided into
calibration and validation sets to assess model perfor-
mance. The developed calibration models were val-
idated using an independent set of samples not used
during the model training phase. The performance of
the models was assessed based on statistical parame-
ters such as root-mean-square error (RMSE) and coef-
ficient of determination (R
2
) to ensure their accuracy
and reliability.
In addition to the Partial Least Squares (PLS)
regression, the SpectraNet model was trained us-
ing the same dataset. The dataset, consisting of the
recorded NIRS spectra and corresponding laboratory
reference values for moisture, oil, and protein content,
was split into training and validation sets. The model
and PLS algorithm were trained to learn the relation-
ships between the input spectral data and the target
ICEIS 2024 - 26th International Conference on Enterprise Information Systems
504
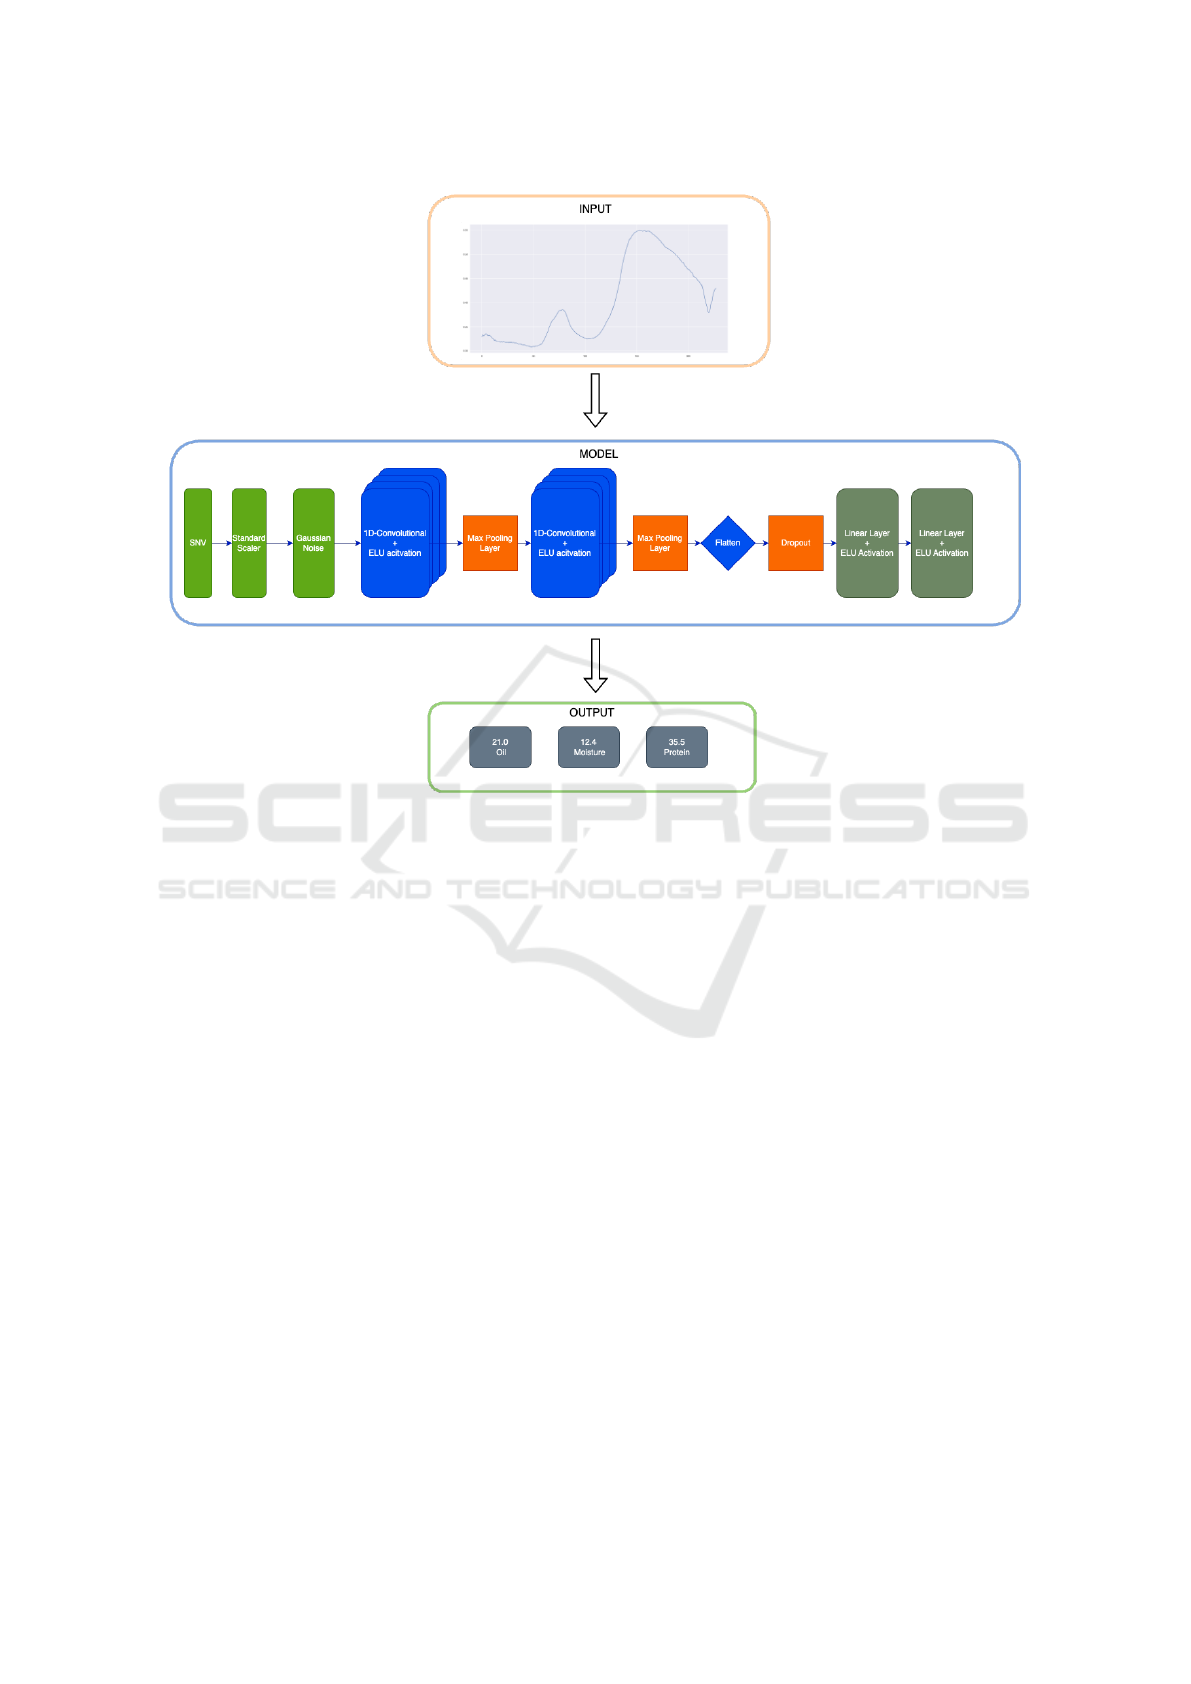
Figure 2: Neural Network Architecture.
output variables.
After training the neural network model, its per-
formance was compared with the established PLS re-
gression models for moisture, oil, and protein content.
The comparison included evaluating statistical met-
rics such as root-mean-square error (RMSE), coeffi-
cient of determination (R²) which are presented in the
results section. To assess the models’ applicability to
new and unseen data, an independent set of soybean
samples not used during the model training phase was
employed. Both the neural network and PLS regres-
sion models were tested on this new dataset to evalu-
ate their performance in real-world scenarios.
One limitation of our proposal comes from the in-
herent variability among optical sensors, since data
from one sensor cannot be used for calibrating the
PLSR or NN of another sensor, meaning that, for
every new sensor, many samples would be needed
making the process of data acquisition really time-
consuming. The NN for the new sensor would need
transfer learning (Torrey and Shavlik, 2010), a well-
known technique for calibration transfer, around 150
samples are needed for training the new model to have
an almost identical and sometimes better performance
as the first NN.
4 RESULTS
In this section, we show the results of SpectraNet, in
comparison with the well-known and much used PLS
for predicting soybean contents (Aulia et al., 2022).
This analysis aims to verify the efficacy of both meth-
ods. As explained in Section 3, we accessed these
metrics using the evaluation metrics RMSE and R
2
.
The results are summarized in Table 1 and shown
graphically in the Figure 3, Figure 4, and Figure 5 the
SpectraNet is more efficient than the PLS algorithm.
In Table 1, it is possible to see that SpectraNet
improves the previous method for protein from an
RMSE of 1.10 down to 0.75, for oil it improves from
0.72 down to 0.50, for moisture it improves hugely
from 0.73 down to 0.31.
Our network has the capacity of predicting three
contents at the same time, differing from the work
in (Aulia et al., 2022) that only predicts protein in soy-
beans, even so SpectraNet has a RMSE of 0.75 for
protein, and their work shows a RMSE of 1.08, Spec-
tra only has an R
2
lower (0.79) because their work
(0.92) focuses on 3 varieties of protein, while our
work has many of varieties from the entire Brazil, and
their range is higher, reaching 45% of protein content.
SpectraNet: A Neural Network for Soybean Contents Prediction
505
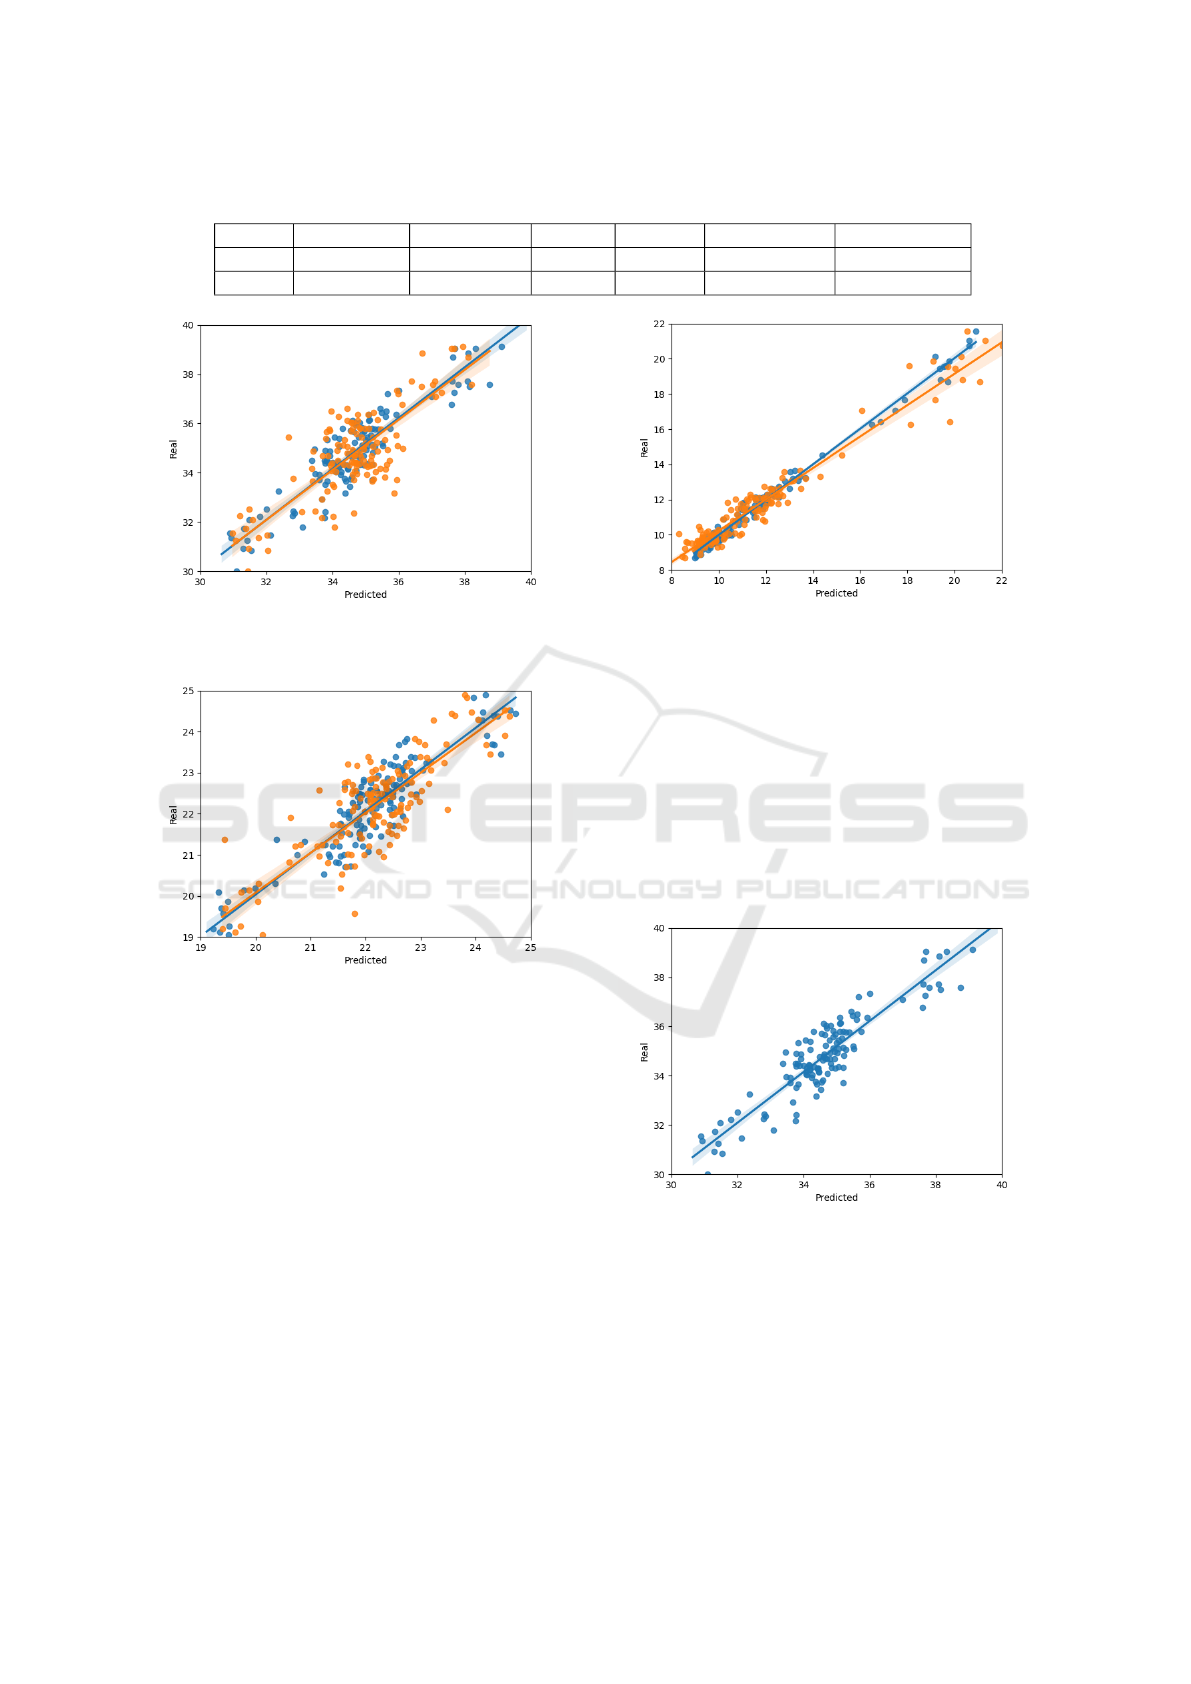
Table 1: Comparison between the neural network model (SpectraNet) and PLS.
Protein NN Protein PLS Oil NN Oil PLS Moisture NN Moisture PLS
RMSE 0.75 1.10 0.50 0.72 0.31 0.73
R² 0.79 0.64 0.80 0.66 0.98 0.93
Figure 3: Protein contents in samples. Orange PLSR and
Blue SpectraNet.
Figure 4: Oil contents in samples. Orange PLSR and Blue
SpectraNet.
This can explain why R
2
is not able to explain that
much variance in the data
As we can see in Figure 3, SpectraNet is more
capable of explaining the non-linearities in the soy-
bean protein data than PLS, and has lower error than
PLS. The Figure 4 shows that the oil in PLS has a few
more outliers than SpectraNet this can be seen in the
comparison in Table 1 where oil has a difference in
RMSE of about 0.22 and an R
2
difference of 0.14.
In Figure 5 moisture can be observed that once
again PLS has quite a few more outliers, specially
on the higher end, where samples with high mois-
ture content are far more difficult to obtain, samples
need to be manually moisturized using a controlled
method. This means that errors in this area are more
common for algorithms like PLS that have difficulties
understanding non-linearity.
Figure 5: Moisture contents in samples. Orange PLSR and
Blue SpectraNet.
These results show the capacity that SpectraNet
has while working with spectral data, with that in
mind, SpectraNet could be used in other research
settings, for different grains, fruits as shown in other
related works where only PLS was used or results
were not good.
For a better visualization of each content using the
Neural Network, Figure 6 is the scatter plot for pro-
tein, Figure 7 is the scatter plot for oil and Figure 8
is the scatter plot for moisture.
Figure 6: Scatter plot of the neural network for protein.
Our analyses showed that SpectraNet is capa-
ble of dealing with the highly complex and non-linear
data present in the spectral data, especially given the
imposed conditions like the rotating sample, making
it better suited for the prediction of said contents in a
less controlled environment.
ICEIS 2024 - 26th International Conference on Enterprise Information Systems
506
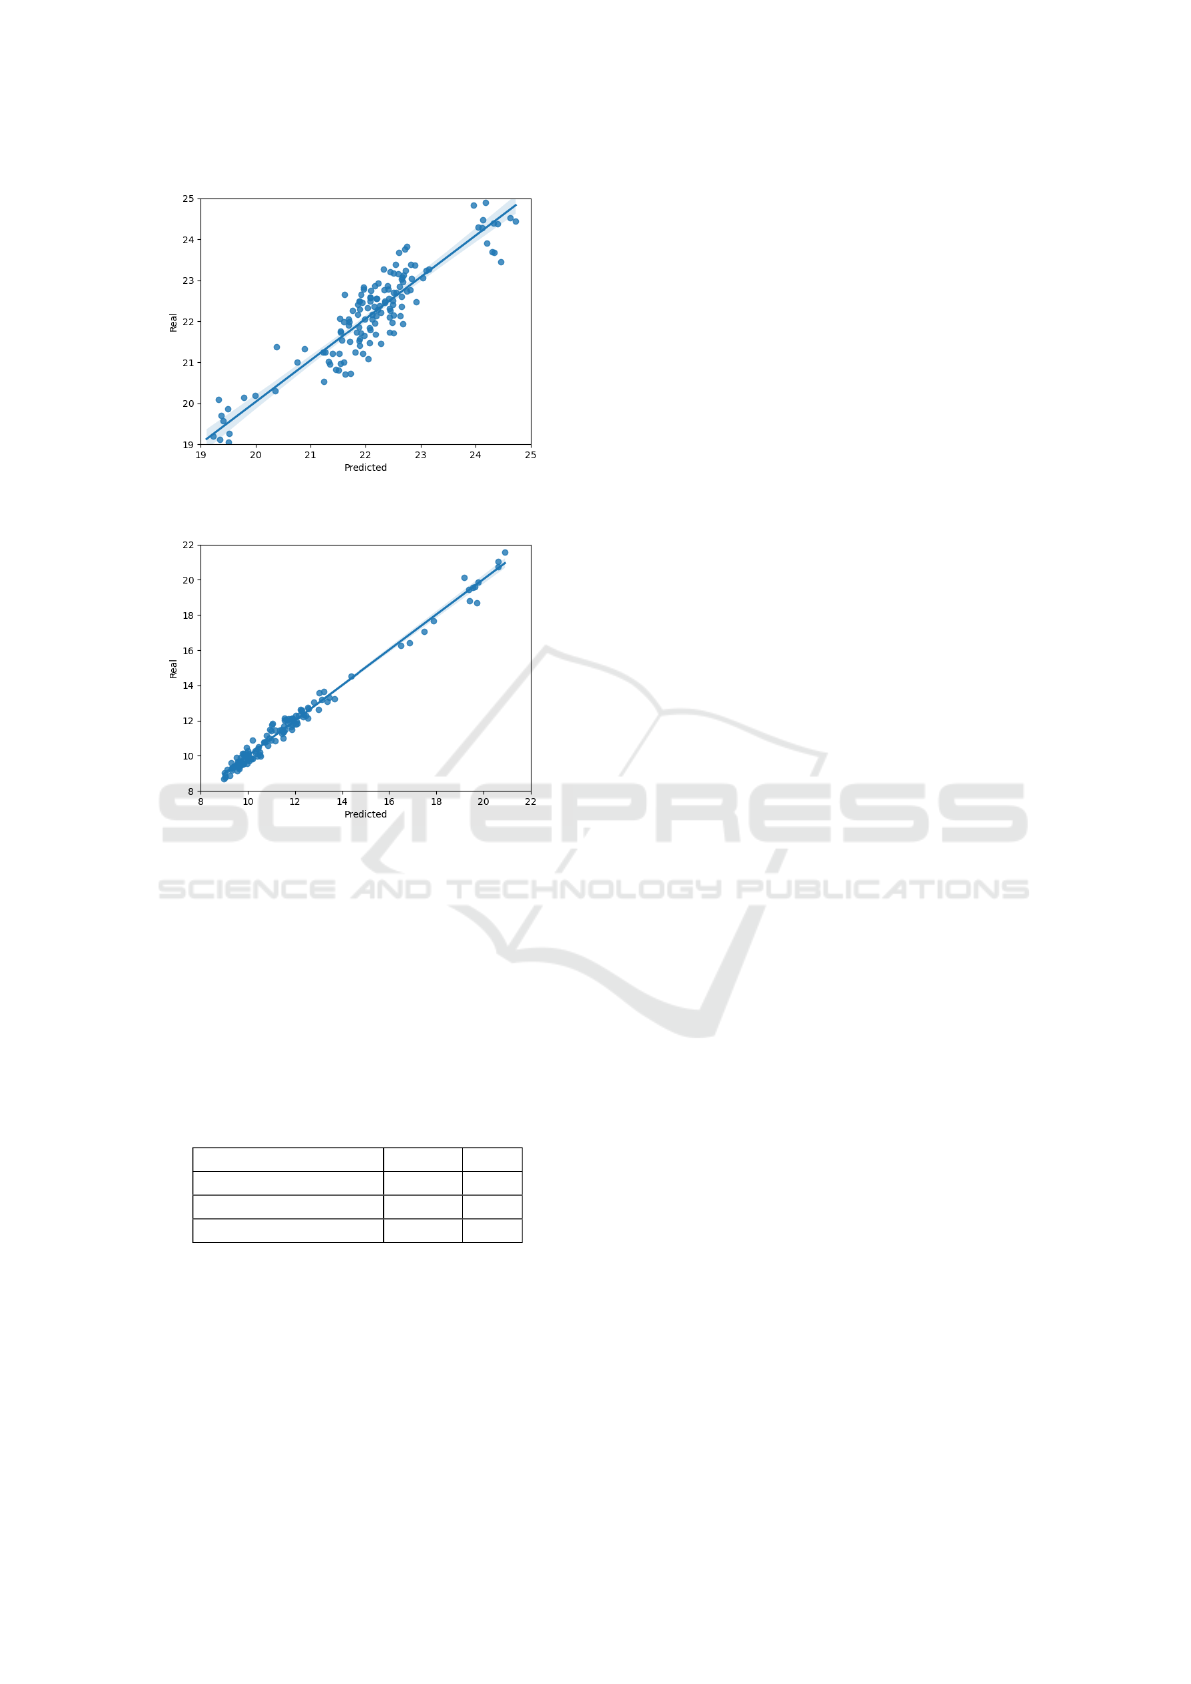
Figure 7: Scatter plot of the neural network for oil.
Figure 8: Scatter plot of the neural network for moisture.
5 RELATED WORK
The work presented in (Aulia et al., 2022) shows
the use of Near-infrared (NIR) Hyperspectral Imaging
(HSI) for predicting the contents of protein in three
varieties of soybean, using only the PLSR algorithm
and obtaining values of R
2
as high as 0.92 and RMSE
of 1.08 during prediction.
Table 2: Comparison between the results of related works.
RMSE R²
Protein PLS (Ours) 1.10 0.64
Protein NN (Ours) 0.75 0.79
Protein PLS (Theirs) 1.08 0.92
It is worth noting that our PLS error is basically
the same that the one shown in (Aulia et al., 2022),
SpectraNet, on the other hand, is far more capable
of dealing with the data and has a lower RMSE, the
R
2
measure is lower in our cases simply because their
work has a higher range, making R
2
higher.
(Cui and Fearn, 2018) introduces the broad appli-
cation of how to apply convolutional neural networks
to NIR data, their work introduced many intuitions
used in this work such as the use of 1d convolution
neural networks. However, in this article, we show
that the same encoding convolutional layer can be
used to predict different contents.
In (Bjerrum et al., 2017) the authors proposed
a novel data augmentation technique that can im-
prove calibration models, it includes randomly mak-
ing shifts and scaling on the training dataset, not re-
lying on huge datasets to train these neural networks.
The same technique was applied in the dataset of this
work. (Abdi et al., 2012) aims to predict soil re-
lated properties, such as concentration of many ele-
ments such as phosphorus, zinc and potassium, using
data acquired from NIRS with the PLS algorithm, as
shown in the study, a few elements are more reactive
to the infrared, and as such have higher correlations
and better results.
(Basile et al., 2022) uses NN for prediction of
grape texture, 270 samples of grape were used in this
study, and compared PLS and the NN for predicting
the total soluble solids using PLS achieved an R
2
of
0.69 and RMSE of 1.02, as while the NN achieved re-
sults of R
2
0.93 and RMSE of 0.5, once again show-
ing how neural networks are able to better understand
Spectral data.
The work in (Zhu et al., 2019) shows the use of a
2D DCNN capable of classification of three different
varieties of soybean, using a train dataset of up to 810
samples, the NN is able to predict the variety with an
astonishing 99.44% accuracy during validation, and
99.77% accuracy using spectral data gathered from
the soybeans.
Despite the recent advancements in Neural Net-
works applied to NIRS, a better generalization is
needed, this was evidenced in this section where a
couple of works were made for predicting specific
contents of soybean. One of the works tries to ad-
dress this problem but leaves out other factors such as
moisture and oil, which are as important as protein.
This work focus on addressing those issues aforemen-
tioned.
6 CONCLUSION
In conclusion, understanding the contents of protein,
moisture, and oil in soybeans holds paramount im-
portance to agriculture, bringing quality and control
right out of the farm. Soybeans, being a versatile and
widely consumed crop, play a key role in both hu-
man and animal nutrition, making accurate and ef-
ficient assessment of their quality essential. In this
work, we addressed the importance of portability, fast
SpectraNet: A Neural Network for Soybean Contents Prediction
507

and accurate analysis with the application of Neural
Networks.
The main contribution of this paper is the creation
of SpectraNet, an architecture that can learn from
spectroscopy data, providing results with overall in-
creased accuracy, when compared to the existing pro-
posals. Furthermore, our approach simplifies the tra-
ditional process of sending the samples to a labora-
tory, as it could take up to weeks to get the results
ready. By applying our proposal, the time to get the
information is reduced to approximately 3 minutes,
while a laboratory analysis would take about one to
two weeks. Hence, we can optimize agricultural prac-
tices, improve food processing techniques, and con-
tribute to the development of sustainable and resilient
food systems.
It is worth noting that this method of using neural
networks for prediction of protein, moisture, and oil
in soybean using spectroscopy still faces a challenge
that is the calibration transfer problem (Workman,
2018), which makes it challenging to use the same
Neural Network for prediction on different spec-
troscopy sensors using the data acquired from just one
sensor. In future works this problem could be better
investigated, meaning that multiple sensors could be
used from the training of only one NN, different from
the actual scenario where the architecture presented in
this work needs to be trained for every single sensor,
or fine-tuned.
ACKNOWLEDGEMENTS
We thank Zeit Artificial Intelligence Solutions Ltd.
for making this work possible, bringing the problem
to us and financially supporting this work.
REFERENCES
Abdi, D., Tremblay, G. F., Ziadi, N., B
´
elanger, G., and
Parent, L.-
´
E. (2012). Predicting soil phosphorus-
related properties using near-infrared reflectance spec-
troscopy. Soil Science Society of America Journal,
76(6):2318–2326.
Almeida, J. S. (2002). Predictive non-linear modeling of
complex data by artificial neural networks. Current
opinion in biotechnology, 13(1):72–76.
Aulia, R., Kim, Y., Amanah, H. Z., Andi, A. M. A., Kim,
H., Kim, H., Lee, W.-H., Kim, K.-H., Baek, J.-H., and
Cho, B.-K. (2022). Non-destructive prediction of pro-
tein contents of soybean seeds using near-infrared hy-
perspectral imaging. Infrared Physics & Technology,
127:104365.
Basile, T., Marsico, A. D., and Perniola, R. (2022). Use
of artificial neural networks and nir spectroscopy
for non-destructive grape texture prediction. Foods,
11(3):281.
Batten, G. D. (1998). An appreciation of the contribu-
tion of nir to agriculture. J. Near Infrared Spectrosc.,
6(1):105–114.
Bjerrum, E. J., Glahder, M., and Skov, T. (2017). Data
augmentation of spectral data for convolutional neu-
ral network (CNN) based deep chemometrics. CoRR,
abs/1710.01927.
Cui, C. and Fearn, T. (2018). Modern practical convo-
lutional neural networks for multivariate regression:
Applications to nir calibration. Chemometrics and In-
telligent Laboratory Systems, 182:9–20.
Ghosh, K., Stuke, A., Todorovi
´
c, M., Jørgensen, P. B.,
Schmidt, M. N., Vehtari, A., and Rinke, P. (2019).
Deep learning spectroscopy: Neural networks for
molecular excitation spectra. Advanced science,
6(9):1801367.
Goodfellow, I., Bengio, Y., and Courville, A. (2016). Deep
Learning. MIT Press. http://www.deeplearningbook.
org.
Guo, Q., Wu, W., and Massart, D. (1999). The robust
normal variate transform for pattern recognition with
near-infrared data. Analytica chimica acta, 382(1-
2):87–103.
Hell, J., Pr
¨
uckler, M., Danner, L., Henniges, U., Apprich,
S., Rosenau, T., Kneifel, W., and B
¨
ohmdorfer, S.
(2016). A comparison between near-infrared (nir)
and mid-infrared (atr-ftir) spectroscopy for the mul-
tivariate determination of compositional properties in
wheat bran samples. Food Control, 60:365–369.
Kiranyaz, S., Avci, O., Abdeljaber, O., Ince, T., Gabbouj,
M., and Inman, D. J. (2021). 1d convolutional neu-
ral networks and applications: A survey. Mechanical
systems and signal processing, 151:107398.
Kiranyaz, S., Ince, T., Abdeljaber, O., Avci, O., and Gab-
bouj, M. (2019). 1-d convolutional neural networks
for signal processing applications. In ICASSP 2019-
2019 IEEE International Conference on Acoustics,
Speech and Signal Processing (ICASSP), pages 8360–
8364. IEEE.
Ortega, I. L., Valenzuela, M. A., Lagos, J. M., and An-
drades, P. P. (2021). Chemical characterization of
volcanic soils using near infrared spectroscopy (nirs).
Chilean journal of agricultural & animal sciences,
37(1):32–42.
Preece, K., Hooshyar, N., and Zuidam, N. (2017). Whole
soybean protein extraction processes: A review. In-
novative Food Science & Emerging Technologies,
43:163–172.
Schroff, F., Kalenichenko, D., and Philbin, J. (2015).
Facenet: A unified embedding for face recognition
and clustering. In Proceedings of the IEEE conference
on computer vision and pattern recognition, pages
815–823.
Torrey, L. and Shavlik, J. (2010). Transfer learning. In
Handbook of research on machine learning appli-
cations and trends: algorithms, methods, and tech-
niques, pages 242–264. IGI global.
ICEIS 2024 - 26th International Conference on Enterprise Information Systems
508

Willis, S. (2003). The use of soybean meal and full fat
soybean meal by the animal feed industry. In 12th
Australian soybean conference. Soy Australia, Bund-
aberg.
Wilson, L. A. (1995). Chapter 22 - soy foods. In Erickson,
D. R., editor, Practical Handbook of Soybean Pro-
cessing and Utilization, pages 428–459. AOCS Press.
Workman, J. J. (2018). A review of calibration transfer
practices and instrument differences in spectroscopy.
Applied spectroscopy, 72(3):340–365.
Xu, X., Xie, L., and Ying, Y. (2019). Factors influencing
near infrared spectroscopy analysis of agro-products:
a review. Frontiers of Agricultural Science and Engi-
neering, 6(2):105–115.
Young, V., Scrimshaw, N., Torun, B., and Viteri, F.
(1979). Soybean protein in human nutrition: an
overview. Journal of the American Oil Chemists’ So-
ciety, 56(3Part1):110–120.
Zhang, W., Kasun, L. C., Wang, Q. J., Zheng, Y., and Lin,
Z. (2022). A review of machine learning for near-
infrared spectroscopy. Sensors, 22(24).
Zhu, S., Zhou, L., Zhang, C., Bao, Y., Wu, B., Chu, H.,
Yu, Y., He, Y., and Feng, L. (2019). Identifica-
tion of soybean varieties using hyperspectral imaging
coupled with convolutional neural network. Sensors,
19(19):4065.
SpectraNet: A Neural Network for Soybean Contents Prediction
509
