
What Is the Right Bounding Box of a VRU Cluster in V2X
Communication? How to Form a Good Shape?
Leonardo Barbosa da Silva
1 a
, Silas Correia Lobo
2
, Evelio Mart
´
ın Garc
´
ıa Fern
´
andez
1 b
and Christian Facchi
2 c
1
Department of Electrical Engineering, Universidade Federal do Paran
´
a, Curitiba, Brazil
2
CARISSMA (C-ECOS), Technische Hochschule Ingolstadt, Ingolstadt, Germany
Keywords:
Vulnerable Road Users, VRU Clustering, Cluster Bounding Boxes, V2X Communication, Vulnerable Road
User Awareness Message, VAM, VRU Basic Service.
Abstract:
Among the possible traffic members on a Vehicle-to-Everything network, the term Vulnerable Road User
(VRU) is assigned e.g. to pedestrians and cyclists. The VRU Awareness Message (VAM) is used by VRUs
to inform other users of their presence and ensure they are perceived in a traffic system. Since the number of
VRUs in crowded areas might be very high, the over-the-air traffic might be overloaded. To reduce channel
overload, VAMs offer a clustering feature in which VRUs with similar kinematics and positions can group
themselves so that only one device transmits messages. The VRU Basic Service specification describes the
cluster as a bounding box that must cover all its members using a geometric shape so that other vehicles in the
vicinity can avoid colliding with the contained VRUs. This paper contributes to the standardization effort by
introducing a data structure, the Cluster Map, for the clustering in the VRU Basic Service. Furthermore, this
work is the first to suggest strategies for forming bounding box shapes. Simulation results show that each of
the geometry types is useful in different situations, thus further research on the topic is advised.
1 INTRODUCTION
Among all the transport groups in an urban environ-
ment, the Vulnerable Road Users (VRUs), including
cyclists, motorcyclists, moped riders, and pedestri-
ans, face elevated accident risks. Data from the Euro-
pean Road Safety Observatory (ERSO) indicates that
in 2021, 48.01% of the 19,484 traffic-related fatalities
in the European Union involved VRUs, with pedestri-
ans accounting for 18.83% (Decae, 2023).
Contributing to traffic safety, Vehicle-to-
Everything (V2X) communication uses wireless
messages to expand awareness in a transport system.
V2X technologies encompass Cellular V2X (C-V2X)
using the Long-Term Evolution (LTE) standard from
the 3GPP and WiFi-based V2X relying on the IEEE
802.11p amendment. This study favors WiFi-based
V2X over C-V2X due to the latter’s limitation
in communicating out-of-coverage, such as when
traversing tunnels (Festag, 2015).
a
https://orcid.org/0009-0006-3511-6056
b
https://orcid.org/0000-0003-1707-8595
c
https://orcid.org/0000-0002-7762-9419
Through the definition of the Intelligent Transport
Systems (ITS) concept, the WiFi-based ITS-G5 stan-
dard is introduced by the European Telecommunica-
tions Standards Institute [ETSI] (2010). The ITS-G5
services are categorized by the CAR 2 CAR Commu-
nication Consortium [C2C-CC] based on a deploy-
ment roadmap, with the Day 3+ release containing
VRUs actively broadcasting data (C2C-CC, 2019).
To cover this feature, ETSI published the 103
300 series of reports and specifications that proposes
a VRU Awareness Message (VAM) that advertises a
VRU’s presence to other stations in its range (ETSI,
2021a,b,c). VAMs are the basis for the VRU Basic
Service (VBS), which describes operations, message
generation rules, and transmission trigger conditions.
The generation time depends on channel occupation
through the use of the Decentralized Congestion Con-
trol (DCC) mechanism (ETSI, 2015). Some use cases
of the VBS are collision avoidance and intersection
management (C2C-CC, 2023).
In a region densely populated with VRUs, plenty
of individual VAMs can be exchanged, consuming
spectrum resources and requiring plenty of process-
ing from each V2X device in the local network, lead-
144
Barbosa da Silva, L., Lobo, S., Fernández, E. and Facchi, C.
What Is the Right Bounding Box of a VRU Cluster in V2X Communication? How to Form a Good Shape?.
DOI: 10.5220/0012699100003702
Paper published under CC license (CC BY-NC-ND 4.0)
In Proceedings of the 10th International Conference on Vehicle Technology and Intelligent Transport Systems (VEHITS 2024), pages 144-155
ISBN: 978-989-758-703-0; ISSN: 2184-495X
Proceedings Copyright © 2024 by SCITEPRESS – Science and Technology Publications, Lda.

ing to a higher overhead (ETSI, 2021c). As a solution,
the VBS offers the clustering functionality, grouping
VRUs with similar positions and kinematics and let-
ting a single node called cluster leader be responsible
for transmitting VAMs. To advertise the set of mem-
bers, the leader must include a data field in its VAM
that represents the area occupied by the cluster partic-
ipants. These objects can assume three different geo-
metrical shapes: circle, rectangle, or polygon. How-
ever, ETSI does not offer strategies on how to produce
these constructs, nor does it discuss each option’s im-
pact on the service’s performance.
This paper addresses implementation gaps in clus-
tering on the VBS, presenting the first comprehen-
sive set of techniques for generating bounding box
shapes. A Cluster Map is introduced as a supporting
data object facilitating the formation and maintenance
of cluster shapes. Testing the proposed strategies is a
simulated traffic scenario implemented in the open-
source framework Artery (Riebl et al., 2015). The
comparison of the impact caused by each shape on the
service uses cluster density (VRUs per bounding box
area), average message size, number of active clus-
ters, and total operations as metrics.
This work is structured as follows: Section 2
presents the state of the art regarding VAMs and VRU
clustering. Section 3 describes an implementation
of the VBS and proposes shape formation strategies,
with Section 4 defining metrics to compare the shapes
generated from these methods. Section 5 describes
the tools used to simulate the service, and Section 6
discusses the obtained results. Section 7 concludes
the paper and suggests future steps.
2 VRU BASIC SERVICE
On the VBS, transmission of a VAM occurs when
one of its trigger conditions is satisfied, for exam-
ple, due to elapsed time or a change in either speed,
orientation, or position above a predefined threshold.
The interval between consecutive message generation
ranges from a minimum of 100 ms up to 5 s. A VAM’s
structure consists of the mandatory containers: ITS
Protocol Data Unit (PDU) Header, Basic Container,
and High Frequency Container. These are sent in ev-
ery message and contain, among other elements, each
device’s Station ID, message generation time, VRU
profile, position, and kinematics (ETSI, 2021c).
VAMs might also contain the optional containers:
Low Frequency Container, Cluster Information Con-
tainer (CIC), Cluster Operation Container (COC), and
Motion Prediction Container. The VBS also offers the
optional VRU cluster management function that han-
dles clustering events and parameters. Subsections
2.1, 2.2, and 2.3 provide an overview of VBS stan-
dalone and cluster operations based on (ETSI, 2021c).
2.1 Standalone VRU Operation
The default role of a VRU on the VBS is standalone,
meaning that it will periodically send VAMs disclos-
ing its presence and keep listening for updates from
other devices. The VRUs store knowledge about ob-
jects in their surroundings by receiving and parsing
awareness messages. They maintain this information
in a facility called Local Dynamic Map (LDM), that
can be used to support various ITS applications, such
as collision risk assessment (ETSI, 2014). When the
cluster manager is enabled, standalone VRUs will
keep monitoring their LDM in search of opportunities
to create a cluster or join a compatible one.
2.2 VRU Cluster Creation
During the process of clustering, nodes are compat-
ible if their distance and speed difference fall below
predefined thresholds: maxClusterDistance (default:
5 m) and maxClusterVelocityDifference (default: 5%).
The VRU’s cluster manager inspects the LDM and
considers a group of perceived users as a cluster can-
didate when at least numCreateCluster (default: 3) of
them, including the ego VRU, meet these criteria.
The VRU that notices this situation first changes
its role from standalone to cluster leader and emits
a VAM advertising a clustering opportunity. Cluster
VAMs must always possess a CIC containing clus-
ter identification number (ClusterID), bounding box
shape, number of nodes contained (cardinality), and
type of VRUs present (e.g., pedestrians, cyclists, and
moped riders). For the first cluster VAM, the leader
must generate a random ClusterID and produce a
shape that contains only itself.
2.3 VRU Cluster Updating
When a standalone VRU receives a cluster VAM and
deems itself compatible, it may send a join notifica-
tion for 3 s. This message includes the COC with
the ClusterJoinInfo data field, specifying the target
cluster’s ID and the duration for which the VRU will
continue sending standalone VAMs. After success-
fully joining, the VRU assumes a passive role, ceasing
VAM transmission but monitoring leader messages to
ensure that speed difference and distance are still suit-
able. A VRU can only join clusters with cardinality
below maxClusterSize (default: 20 VRUs).
What Is the Right Bounding Box of a VRU Cluster in V2X Communication? How to Form a Good Shape?
145
A member can decide to leave a cluster due to:
incompatible kinematics with the group, no VAM re-
ceived from the leader within 2 s, or the triggering of
a break-up by the leader. Complementary to the join
message, the leave VAM also includes a COC, but in
this case with the ClusterLeaveInfo data field, con-
taining the target cluster’s ID and stating the reason
for the operation. The VRU must transmit the leave
notification for 1 s.
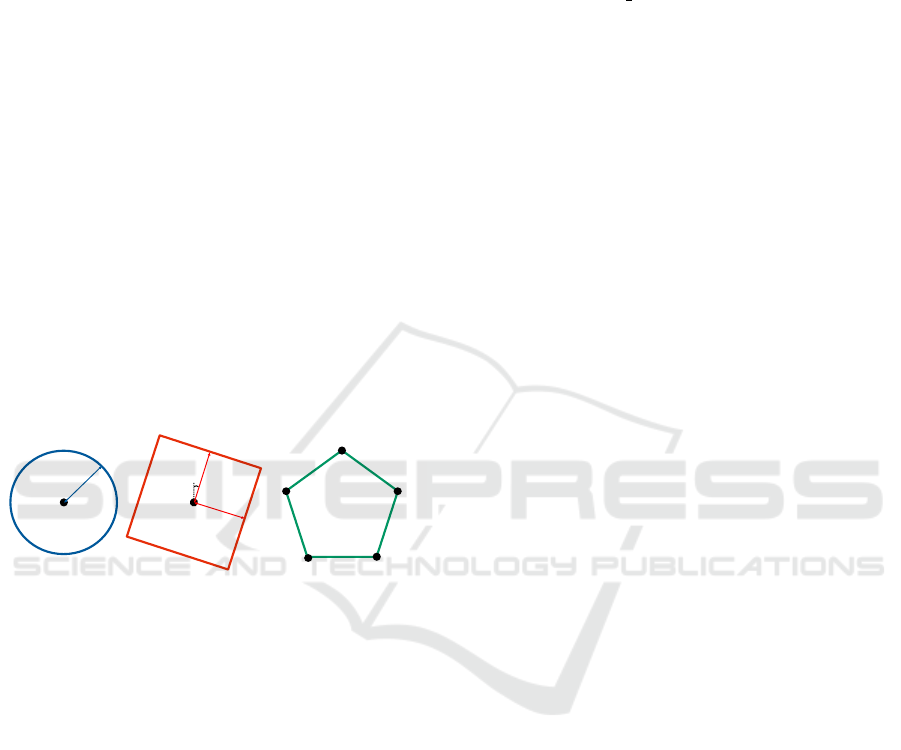
During a cluster’s lifespan, the leader sends VAMs
containing a CIC that describes a geometry encapsu-
lating every member. This shape, named bounding
box, can be one of three possible types: circle, rect-
angle, or polygon, each taking a varying amount of
parameters as shown in Figure 1. The circle is de-
fined by a center point (C.a) and radius (C.b), the rect-
angle is formed by a center point (R.a), half-length
(R.b), half-width (R.c), and orientation (R.d), while
the polygon is described by a sequential list of all the
offset points (P.a.1, ..., P.a.n) that form the vertices of
the shape, with no explicit upper bound. Depending
on how each bounding box is declared in the CIC, the
chosen shape can significantly influence message size
and, consequently, the channel load.
P.a.1
P.a.2
P.a.3 P.a.4
P.a.5
C.a
C.b
R.d
R.a
R.b
R.c
Figure 1: Parameters that are used to describe a Bounding
Box shape in the CIC.
The leader listens for VAMs containing COCs ad-
dressed to its ClusterID, updating the bounding box
according to valid join and leave notifications. And,
if necessary, it triggers a breakup operation by includ-
ing a COC with the clusterBreakupInfo data field in
the VAM. The message contains a reason for the dis-
solution (e.g., insufficient cardinality) and the time at
which the leader will stop sending cluster VAMs.
2.4 Functional Gaps of the VBS
As the current ETSI 103 300 VBS standard by ETSI
(2021c) is still in development, it has functional gaps
hindering complete clustering implementation. This
subsection describes the enhancements proposed by
Lobo et al. (2023) which were incorporated in this
study. In the last paragraph, an original enhancement
is suggested to cover another identified gap.
On heavily occupied channels, consecutive mes-
sage generations from a VRU using the VBS might
take up to 5 s. If the VRU in question is a cluster
leader, this would lead the members to wrongfully
trigger a “leader-lost” leave operation due to a lack
of received leader VAMs in the span of timeCluster-
Continuity (default: 2 s). To prevent this issue, Lobo
et al. propose the reduction of the maximum gener-
ation delta time (T GenVamMax) for cluster leaders
from 5 to 2 s.
Another suggested addition from Lobo et al. is
a “Cluster creation failed” event. Currently, a leader
creating a cluster will wait indefinitely for join VAMs
while the cardinality is below numCreateCluster.
This state, if kept for prolonged durations, is inef-
ficient as it drains the VRU’s power resources and
overloads the channel more than in standalone mode.
The suggested event interrupts cluster creation when
a leader does not receive sufficient valid joins in the
span of timeLeaderWaiting (default: 2 s).
Since the standard does not offer a method to con-
struct the initial bounding box, Lobo et al. suggest
that this geometry shall always be a circle with a
radius of half the distance to the closest compatible
VRU. This shape type needs the least number of data
elements to be described, and the suggested radius en-
sures non-negative areas covering only the leader.
Regarding bounding boxes, Lobo et al. also pro-
pose an optional buffer distance
d
B f
= v
V RU
·t
VAM
, (1)
added to the edge of all shapes, increasing the cov-
ered area. The padding distance (d
B f
) uses the highest
VRU velocity within the cluster members (v
V RU
) and
the VAM assembly time (t
VAM
) as parameters. This
functionality prevents VRUs from being at the exact
edge of the geometry, leading to them being wrongly
determined inside/outside the bounding box due to la-
tency, time delays, or position errors.
Furthermore, this present work identifies and
solves an additional gap. When a leader receives leave
notifications from its cluster members, it recalculates
the bounding box and reduces the cardinality. How-
ever, when a cluster contains less than three VRUs, it
is impossible to form a rectangle or polygon since the
VRUs’ positions would amount to a single line seg-
ment. This study suggests that a cluster should dis-
solve whenever a leader identifies that the cardinal-
ity is below numCreateCluster for the duration time-
LeaderWaiting. This parameter provides some time
for join requests to be received and processed by the
leader while also matching the suggested timeout for
the initial formation of the cluster.
2.5 Related Works - VAMs
Current research on VAMs often focuses on the VRU
in a standalone capacity. For instance, Lobo et al.
VEHITS 2024 - 10th International Conference on Vehicle Technology and Intelligent Transport Systems
146

discuss the enhanced VRU detection time provided
by the VBS and explore the advantages of using this
service along with ETSI’s other solutions, such as the
Collective Perception Message (Lobo et al., 2022).
Through field testing, Lusvarghi et al. suggest that
the rules for triggering VAM generation should dif-
fer depending on the profile of the VRUs (Lusvarghi
et al., 2023). Zoghlami et al. advocate for a context-
aware message transmission scheme based on posi-
tion and kinematics, leading to adaptive VAM gener-
ation (Zoghlami et al., 2022).
Concerning VRU Clustering, Rupp and Wischhof
show that this VBS feature reduces the number of
VAMs sent in traffic scenarios, particularly for higher
cardinalities. However, it also leads to an increase
in position error when compared to individual VAMs.
Finally, they recommend improving cluster effective-
ness by either increasing maxClusterVelocityDiffer-
ence to a minimum of 25% or adjusting it to con-
sider velocity averages rather than instantaneous val-
ues (Rupp and Wischhof, 2023).
Also analyzing clustering performance on the
VBS, Lobo et al. compare simulation results on a
scenario with and without clustering enabled. The ob-
tained data shows that clustering reduces channel oc-
cupation, thus making communication more reliable
by minimizing the message latency and Packet Error
Rate. This behavior is related to the DCC function of
the service operating closer to its threshold when only
individual VAMs are present, leading to the formation
of queues and message drops (Lobo et al., 2023).
2.6 Related Works - Bounding Boxes
To the best of the author’s knowledge, at the moment,
no other research related to the geometrical shaping
of the VRU clusters has been published. This topic is
particularly challenging since the ETSI 103 300 stan-
dard by ETSI (2021c) does not offer strategies to pro-
duce the cluster bounding box shapes. Furthermore,
through the literature review of the state of the art
on wireless network technologies, the production of
these geometries appears to be an unsolved issue to
the VBS since most clustering functionalities do not
need to worry about the shape that their list of mem-
bers produces.
For example, clustering applications for Wireless
Sensor Networks and Radio Frequency Identification
both deal with the grouping of various devices based
on their positions (Shahraki et al., 2020; Gomes et al.,
2022). Both, however, do not take into consideration
kinematics or the shape formed by the set of objects,
treating clusters as amorphous point clouds.
In image processing, bounding boxes are used to
contour the result of a classification algorithm (Lak-
shmanan et al., 2021). They are, however, limited to
forming only axis-aligned rectangles.
The Bounding Volumes (BV) concept presents a
similar goal to the cluster bounding boxes within the
VBS. The formation of BVs uses a variety of compu-
tational geometry strategies to represent one or more
complex geometries through simpler shapes (e.g., cir-
cles, rectangles, and polygons), both in 2D and 3D.
This approach is used in collision detection algo-
rithms to produce objects that are easier to process,
which is ideal for ray-tracing and hitbox detection in
physics simulators, computer animations, and video
games (Ericson, 2004).
Research in Light Detection and Ranging (Li-
DAR) also benefits from BV strategies, using them
to represent a perceived object in a 3D space. In au-
tonomous driving, some applications of LiDARs are
object detection (V and Pankaj, 2021), assessment of
object orientation (Liu et al., 2020), and collision de-
tection (Wang et al., 2019).
3 VBS CLUSTERING
IMPLEMENTATION
To evaluate the viability of clustering on the VBS
and the particular effect of each shape, previous im-
plementations of the standard on Artery were ex-
tended. In (Lobo et al., 2022), the VAM contain-
ers and the message transmission triggers were de-
veloped for standalone VRUs, providing the basis for
the VBS in the framework. Continuing the VBS de-
velopment, (Lobo et al., 2023) implements the cluster
management functionality, enabling VRU clustering
with polygonal shapes. Each device with VBS has
a cluster management instance responsible for stor-
ing the VRU’s role, parsing the Cluster Information
and Operations containers, managing the bounding
box construction, and monitoring the LDM for con-
ditions to trigger cluster events (creation, join, leave,
and breakup).
This work enhances (Lobo et al., 2023) by im-
plementing all three cluster bounding box shapes de-
scribed in ETSI’s standard (ETSI, 2021c), determin-
ing strategies based on computational geometry to
form these structures. The introduction of a new
data structure, the Cluster Map, supports the cur-
rent VBS clustering functionality. This object stores
data from cluster-compatible VRUs, providing a stan-
dalone VRU with means to determine if it should cre-
ate a cluster while also providing the cluster leader
with data regarding its members. Additionally, an
Artery simulation scenario enables the evaluation of
What Is the Right Bounding Box of a VRU Cluster in V2X Communication? How to Form a Good Shape?
147
the effects of clustering using the different shape
types, comparing the benefits and drawbacks of each
on a VBS.
3.1 Cluster Map Concept
This study introduces the Cluster Map (CM) concept
as a tool to support the cluster management func-
tionality of the VBS. A CM uses the data objects of
the LDM to store perceived VRUs that are cluster-
compatible, containing information such as position,
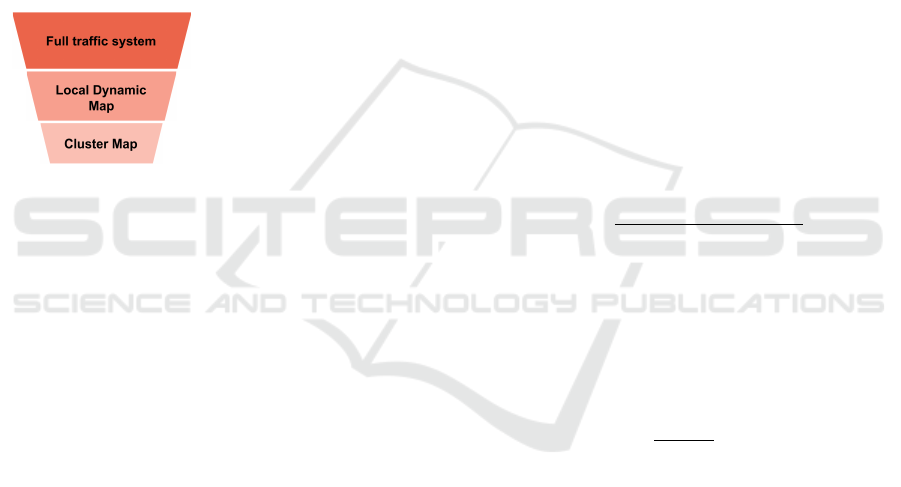
kinematics, and station ID. The purpose of the CM, as
illustrated in Figure 2, is to generate a specialized data
structure that is simpler to iterate as part of the VBS
functional cycle, supporting the creation and manage-
ment of clusters. A CM is instantiated in every VRU
as it assumes a standalone or cluster leader role.
Moving and static objects perceived
by a VRU through V2X services
All vehicles, VRUs and
road infrastructure present in a region
Clustering-compatible VRUs
Figure 2: Funneling of perceived traffic nodes in a region.
Cluster Map acts as a specialized LDM.
Initially, the CM stores a list of cluster-compatible
VRUs perceived in the LDM, with the ego standalone
VRU using this structure to evaluate if it could create
a new cluster and become a leader. In these situa-
tions, the CM is used to determine the expected car-
dinality and calculate the radius of the first iteration
of the bounding box. Cardinality is determined by
summing the number of VRUs on the CM and adding
one to the total to account for the leader. After suc-
cessful cluster creation, the initial CM is purged and
is only updated by the leader through valid join and
leave VAMs from compatible nodes. This change en-
sures proper cluster management by the leader who
must validate the received operations and keep track
of the members’ positions, enabling it to construct an
appropriate bounding box.
3.2 Bounding Box Generation
The development of VRU Clustering on Artery pre-
sented in this work addresses the absence of speci-
fied Bounding Box formation strategies in the stan-
dard (ETSI, 2021c) by determining and implement-
ing its methodologies. The adopted approaches stem
from the literature review of bounding boxes in the
realm of computational geometry, being the first to
offer strategies for clustering on a VBS.
The VBS incorporates the generation of bound-
ing boxes through an instance of the cluster manage-
ment module in each VRU. A device shall only have
access to this functionality if either they are a stan-
dalone VRU attempting to generate a new cluster or
if they are already a leader. In both these cases, a
Cluster Map will be used to produce a point cloud
that indicates the position of a set of VRUs. The CM
is the primary data source for the proposed bounding
box generation strategies. For simplicity, this study
assumes that all devices in a test scenario use the same
default shape type and that no type change is possible
except the one that occurs at the transition between
the cluster formation and the maintenance phases.
3.2.1 Initial Bounding Box
For the initial bounding box, ETSI 103 300 deter-
mines that the first iteration of a cluster must contain
only the leader, with a cardinality of one (minCluster-
Size), and a bounded area covering only the VRU cre-
ating the cluster (ETSI, 2021c). At this moment, the
standalone ego VRU creates an empty initial Cluster
Map (iCM). Next, it iterates the LDM, searching for
all the perceived VRUs (P) and comparing if they are
compatible with the ego (E). The first parameter eval-
uated for this decision is the Euclidean distance
d =
q
(x
E
− x
P
)
2
+ (y
E
− y
P
)
2
, (2)
calculated between the positions of each perceived
VRU (x
P
,y
P
) and the ego VRU (x
E
,y
E
). Since this
study does not consider elevation differences, only 2D
coordinates are used. The nodes E and P are compat-
ible if the distance (d) is less than 5 m. The second
parameter, speed difference (v
di f f
), is given by
v
di f f
=
v
E
− v
P
v
E
· 100% , (3)
the ratio of the absolute values for the speed of both
ego (v
E
) and perceived (v
P
) nodes, with a maximum
suitable difference of 5%. If P has both d and v
di f f
within the acceptable ranges, the VRU’s data object is
appended to the iCM. During this assessment, the ego
VRU must store the overall smallest valid distance
(d
min
) among all the d’s calculated from the iCM, us-
ing it later to generate the initial cluster bounding box.
After evaluating all the VRUs in the LDM, the ego
VRU verifies the size of the resulting iCM. If it con-
tains at least two VRUs, the potential cluster reaches a
cardinality of numCreateCluster, and a cluster is pos-
sible. Next, the ego VRU switches roles and becomes
a leader, starting the cluster-creation process. Algo-
rithm 1 summarizes this decision workflow.
For the first cluster VAM, the initial shape shall
always be a circle since this is the shape that needs
VEHITS 2024 - 10th International Conference on Vehicle Technology and Intelligent Transport Systems
148

Data: Ego VRU’s status and LDM
Result: Cluster Creation Decision
initialization;
while VRU’s role is standalone do
update LDM;
check LDM for compatible VRUs;
generate iCM with compatible VRUs;
if iCM size ≥ 2 then
set VRU’s role as cluster leader;
produce initial cluster bounding box;
generate random cluster ID;
include CIC in VAM;
send initial cluster VAM;
else
send standalone VAM;
end
end
Algorithm 1: Cluster creation decision workflow.
the least amount of data elements, being described
by a node center point (C.a) and a radius (C.b). The
first element is a tuple of x and y offset distances in
centimeters between the cluster leader and the actual
center of the proposed bounding box. Since the initial
geometry must contain only the leader, the bounding
box is centered on its position, resulting in a node cen-
ter point of (0,0). The radius is given in decimeters
and calculated by dividing d
min
by half, placing the
edge of the shape at a balanced distance between the
leader and the closest compatible VRU.
The leader then adds C.a and C.b to the CIC, start-
ing to send cluster VAMs shortly after. The broad-
cast of the initial shape continues until the cluster cre-
ation is concluded by having at least numCreateClus-
ter members or is interrupted due to an elapsed time
above the timeLeaderWaiting threshold.
After generating the initial cluster VAM, the clus-
ter manager discards the iCM, and an empty mainte-
nance Cluster Map (mCM) is created to store the data
objects of the cluster participant VRUs. The main
difference between these CMs is that the iCM con-
tains a list of all the VRUs that are cluster-compatible
within the LDM, acting as a list of potential members,
while the mCM possesses only valid member VRUs
that have actively sent join VAMs to the leader.
When the mCM has sufficient members (num-
CreateCluster) added through join VAMs, the clus-
ter management enters a maintenance mode and
stops sending the initial cluster VAM. At this point,
the leader must send VAMs every generation time
(T GenVam) with a CIC containing a bounding box
and cardinality representing all its participants. The
manager stays in this state until a breakup occurs due
to insufficient cardinality or other reasons mentioned
in (ETSI, 2021c). The cluster maintenance routine
executed by the leader is described in Algorithm 2.
Data: mCM and received VAMs
Result: Updated cluster
initialization;
while VRU Role is leader do
parse received VAMs;
if VAM’s COC contains cluster ID then
if Operation is Join then
add new VRU to mCM;
update bounding box;
else if Operation is Leave then
remove VRU from mCM;
if mCM size < 3 for over 2 s then
trigger breakup Operation;
include COC to VAM;
set VRU’s role as standalone;
else
update bounding box;
end
end
end
include CIC to VAM;
send cluster VAM;
end
Algorithm 2: Cluster maintenance by the leader.
The update bounding box segments of Algorithm
2 vary depending on the chosen shape type. Subsec-
tions 3.2.2, 3.2.3, and 3.2.4 describe the strategies em-
ployed to generate each geometry type. All of these
approaches initiate from the mCM, which serves as
the initial reference point, supplying the positions of
all cluster members. These methods aim to generate
the essential bounding box data elements for the CIC,
as detailed in subsection 2.3.
The use of the Axis Aligned Bounding Box
(AABB) supports the formation of the circle and rect-
angular shapes. This strategy, of time complexity
O(n), uses the cartesian coordinates of the VRUs in
the mCM to determine the lowest-leftmost and the
highest-rightmost VRUs, calling these points min and
max, respectively. These two points describe the min-
imum possible non-rotated rectangular envelope that
covers all the mCM nodes (Ericson, 2004).
3.2.2 Circular Bounding Box
A circular geometry on the VBS needs two data ele-
ments: the node center point C.a and the radius C.b.
The most straightforward strategy to determine the
shape’s center would be to take the average of the
What Is the Right Bounding Box of a VRU Cluster in V2X Communication? How to Form a Good Shape?
149

point cloud coordinates. However, this approach may
result in a radius twice as large as necessary when the
points are not uniformly distributed. Thus, another
method to determine the center of a point cloud is to
first create an AABB around it and consider the center
of the resulting geometry as the cloud center (Ericson,
2004). For the circle radius, it is only necessary to de-
termine the distance d
max
between the furthest VRU
of the mCM and the AABB center. The creation of
this box follows Algorithm 3. The time complexity of
this algorithm is also O(n).
Data: mCM
Result: Circle CIC data elements
initialization;
calculate AABB from mCM;
obtain min and max from AABB;
get center C from min and max;
// Get largest distance to center
for each VRU object in mCM do
get current VRU position P;
get distance d
cp
between C and P;
if d
cp
> d
max
then
d
max
← d
cp
;
end
end
obtain leader position P
leader
;
C.a ← offset between P
leader
and C;
C.b ← d
max
;
return C.a and C.b;
Algorithm 3: Circular Bounding Box formation.
3.2.3 Rectangular Bounding Box
A rectangular bounding box is described by a node
center point R.a, half-length R.b, half-width R.c, and
orientation R.d. The strategy adopted to build an
orientation-dependent rectangle is to iterate the point
cloud from the mCM at different rotations and gener-
ate an AABB each time, calculating the resulting area
on each step and selecting the smallest (AAABB
min
).
To obtain the half-length and half-width, the (min,
max) pair from AAABB
min
are used by comparing
the x and y coordinates separately. The process fol-
lows Algorithm 4 and has time complexity O(n).
3.2.4 Polygon Bounding Box
The VBS defines a Polygon in the CIC through a list
of offsets from one vertice to the next. In this im-
plementation, the VRUs positions from the mCM are
all candidates to form the geometry’s vertices, result-
ing in a max number of 20 (maxClusterSize) offsets.
However, implementing a strategy to select which
points to use is fundamental, as a simple ordered list
with all the candidates could lead to holes and spikes
in the bounding box.
Data: mCM
Result: Rectangle CIC data elements
initialization;
create a point cloud from mCM;
// Get smallest rotated cloud area
for θ within (0, 2π) do
rotate cloud θ counterclockwise;
calculate AABB from rotated cloud;
calculate area A from AABB;
if A < A
min
then
A
min
← A;
AABB
min
← current AABB;
θ
min
← current θ;
end
increment 0.1 to θ;
end
get min and max from AABB
min
;
R.a ← center from min and max;
R.b ← (max.x − min.x) * 0.5;
R.c ← (max.y − min.y) * 0.5;
R.d ← θ
min
;
return R.a, R.b, R.c, and R.d;
Algorithm 4: Rectangular Bounding Box formation.
To avoid holes and spikes in a polygon, it must be
convex, meaning that all the interior angles must be
under 180 degrees. To ensure convex polygon gen-
eration, a Convex Hull algorithm that implements the
Graham Scan is used (Shamos, 1978). This approach
uses the point cloud from the mCM, first searching
for V RU
low
, the single lowest vertical position or the
leftmost if multiple points share the y-lowest position.
It then produces a list by sorting the cloud based on
the polar coordinates related to this reference point.
Next, it iterates the resulting list starting at V RU
low
,
selecting triplets of consecutive points, with the cen-
tral point as a vertex candidate.
At every loop iteration, it evaluates through a cross
product if the two segments formed between the can-
didate and the neighbor points generate a left (coun-
terclockwise) turn, meaning it has an interior angle
under 180 degrees (Shamos, 1978). If true, the al-
gorithm moves one position down the list and checks
the next triplet. If not, the candidate generates a right
turn or is collinear to its neighbors and should thus
be removed from the list. Next, the selection is back-
tracked in one position, using a previously approved
vertex and checking if, with the new right neighbor
point, it still produces a left turn (Shamos, 1978).
VEHITS 2024 - 10th International Conference on Vehicle Technology and Intelligent Transport Systems
150
The scan, summarized in Algorithm 5, ends when the
list of potential vertices is exhausted, containing only
left turns and with the last segment reaching the first
point. The lowest point selection is of time complex-
ity O(n), while the scan is O(n logn).
Data: mCM
Result: Polygon CIC data elements
initialization;
get point list from mCM;
iterate list and get V RU
low
;
// Produce the convex hull
sort list by polar coordinates to V RU
low
;
list starts and ends at V RU
low
;
while right of vertex not VRU
low
do
get vertex candidate C;
get left L and right R adjacent points;
CL ← (x
L
− x
C
, y
L
− y
C
);
CR ← (x
R
− x
C
, y
R
− y
C
);
P ← CL ×CR;
if P > 0 then
keep candidate in the list;
get next candidate;
else
remove candidate from the list;
move to previous vertex;
end
end
get the list of n ∈ N vertices;
calculate the offset of consecutive vertices;
each offset is assigned to a P.a.n;
return all P.a.n offsets;
Algorithm 5: Polygonal Bounding Box formation.
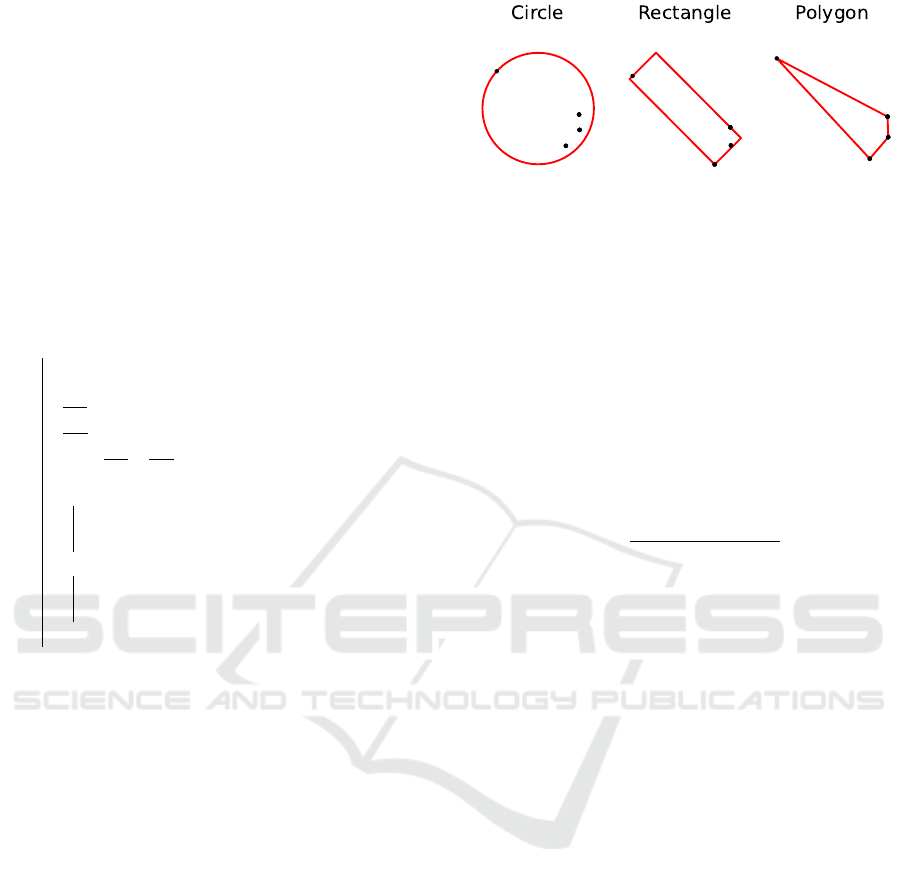
An example of the resulting bounding boxes ob-
tained from the same set of points by using the strate-
gies from Algorithms 3, 4, and 5 is shown in Fig-
ure 3. In an initial assessment, one can observe that
the three methods can construct shapes that optimally
cover all the points while occupying the smallest pos-
sible area. However, it is noticeable that a circular
shape yields a larger bounding box for the same point
cloud, whereas the rectangle and polygon produce a
more well-fitted perimeter.
4 METRICS DEFINITION
It is necessary to determine parameters to compare the
effects of the different bounding boxes on the VBS.
The main goal is to verify the pros and cons of each
geometry type, enabling the study to draw conclu-
sions on which shape is better suited for each use case.
Figure 3: Different bounding boxes generated with the same
set of points.
In the VBS, since VAMs do not contain the pre-
cise position of every member, a bounding box must
be treated as a solid object by external nodes to avoid
collisions. Thus, it is crucial to refrain from generat-
ing a much larger shape than what is needed to cover
all participants, as boxes might block traffic on seg-
ments of sidewalks or streets. Another potential issue
of excessive size is the overlap of nearby cluster ge-
ometries, which could confuse a VRU about which
cluster to join and a vehicle about how to avoid the
clusters properly. The cluster density
D =
cluster cardinality
bounding box area
(4)
is used to evaluate how well a geometry type covers
its participants without occupying excess space.
As in subsection 2.3, each geometry type implies
a different amount of data elements added to the CIC
of a VAM. A circular bounding box in the VBS takes
two parameters, offering the smallest increase to the
CIC. Polygons, on the other hand, lead to the largest
potential increment in VAM size since they need be-
tween three and twenty offsets to form, depending on
cluster cardinality and the number of vertices selected
by the Convex Hull. As an intermediate option, the
rectangle requires four variables, needing more data
than circles but less than most polygons.
Thus, a method to compare the geometry types
is by evaluating the average VAM size in a simu-
lation scenario. This metric is relevant because, in
a crowded environment, it is particularly relevant to
reduce as much as feasible the message size so that
the sent VAMs contribute less to channel congestion.
Moreover, evaluating the average number of clusters
and the number of operations triggered is relevant to
observe their influence in the message size and detect
different behaviors caused by each shape type.
5 SIMULATION STACK
To test the presented shaping strategies and compare
the geometries using the metrics defined in Section 4,
What Is the Right Bounding Box of a VRU Cluster in V2X Communication? How to Form a Good Shape?
151

a simulation stack based on traffic and network sim-
ulators was used. The following subsections offer a
brief overview of the tools and setup parameters.
5.1 Traffic Scenario
Simulation of Urban MObility (SUMO) (Lopez et al.,
2018) handles the traffic simulation, being responsi-
ble for generating the trips of pedestrians and vehicles
on a given map. Aiming to create a traffic scenario re-
sembling a real-world application, a crowded pedes-
trian crossing from Ingolstadt (Germany) provided by
InTAS (Lobo et al., 2020) was used. It occupies an
area of roughly 5.082 m
2
and comprises a pair of two-
way streets, one with 5 lanes, and one with 6. A set of
1,487 pedestrians and 35 vehicles are inserted at ran-
dom instants and coordinates in the simulation. The
steady increase in active actors in the simulated area
produces various clustering opportunities and opera-
tion triggers, also causing a rise in channel occupa-
tion over time. The simulation spans 15 s, processed
in steps of 0.10 s each. At the simulation end, 1,478
pedestrians and 32 vehicles were in the crossing. One
known issue of this tool is that pedestrians do not have
an associated physical size, meaning they are a single
point in the simulation and might overlap.
5.2 Network Simulator
OMNeT++
1
is a discrete-event network simulator,
with sequential simulation steps. This fact makes
it possible to synchronize OMNeT++ and SUMO
events, establishing a bidirectional flow of data and
commands between the two tools, using TraCI
2
. Sup-
port for the Access Layers (PHY and MAC) of the
ITS-G5 V2X protocol are provided by INET
3
.
During the initial testing of the scenario, DCC
acted to alleviate channel overload caused by a high
volume of simultaneous transmissions from multiple
nodes at the 10-second mark of the simulation. This
timeframe was selected as the warm-up period to en-
sure a comparative analysis of shaping techniques in
a busy channel environment. The triggering of events
on OMNeT++ does not occur at the exact instant in
every run, having an innate probabilistic behavior.
Results originate from the average of simulations us-
ing six different seeds.
1
https://omnetpp.org
2
https://sumo.dlr.de/docs/TraCI.html
3
https://inet.omnetpp.org
5.3 V2X Framework
Regarding the ITS-G5 stack, the messaging protocol
Vanetza
4
manages the GeoNetworking and DCC fea-
tures. The V2X simulator Artery (Riebl et al., 2015)
handles the Application layer, with the services de-
ployed and managed in each node through middle-
ware modules. This VBS implementation builds upon
the work from Lobo et al. (2023), who first introduced
VRU clustering to Artery. This work’s main contribu-
tion is an extension of the framework, introducing the
Cluster Map structure, through which the proposed
bounding box generation techniques are possible.
In every simulation, all present VRUs have the
clustering function enabled and will actively look for
opportunities to interact with existing clusters or cre-
ate new ones. As an introduction to the study of the
impact of geometry types on the service, this work
considers only one shape type per simulation run. So,
for example, there is no scenario in which rectangular
and polygonal bounding boxes coexist. Table 1 con-
tains the parameters of the simulation stack.
Table 1: Simulation parameters.
Parameter Value
Simulated time 15.00 s
Simulation step 0.100 s
Warm-up time 10.00 s
Seeds 0, 23, 42, 1337, 0815, 4711
Traffic model InTAS
Number of actors 1,487 pedestrians, 35 cars
Min. cluster size 3 VRUs
Max. Cluster Size 20 VRUs
Cluster Distance 5 m
Speed Difference 5%
6 RESULTS AND DISCUSSION
The VBS containing clustering functionalities and the
proposed shaping strategies was deployed on the de-
veloped InTAS-based traffic scenario. Simulations
using the stack from Section 5 were executed for the
three distinct bounding box types with six random
seeds. This setup resulted in eighteen simulations,
with the following results being the average values
obtained from each iteration. The parameters mea-
sured are the cluster density and the message size, as
proposed in Section 4.
It can be observed in Figure 4 that circular bound-
ing boxes offer the lowest cluster density values. This
behavior suggests that this shape type needs to occupy
4
https://www.vanetza.org
VEHITS 2024 - 10th International Conference on Vehicle Technology and Intelligent Transport Systems
152
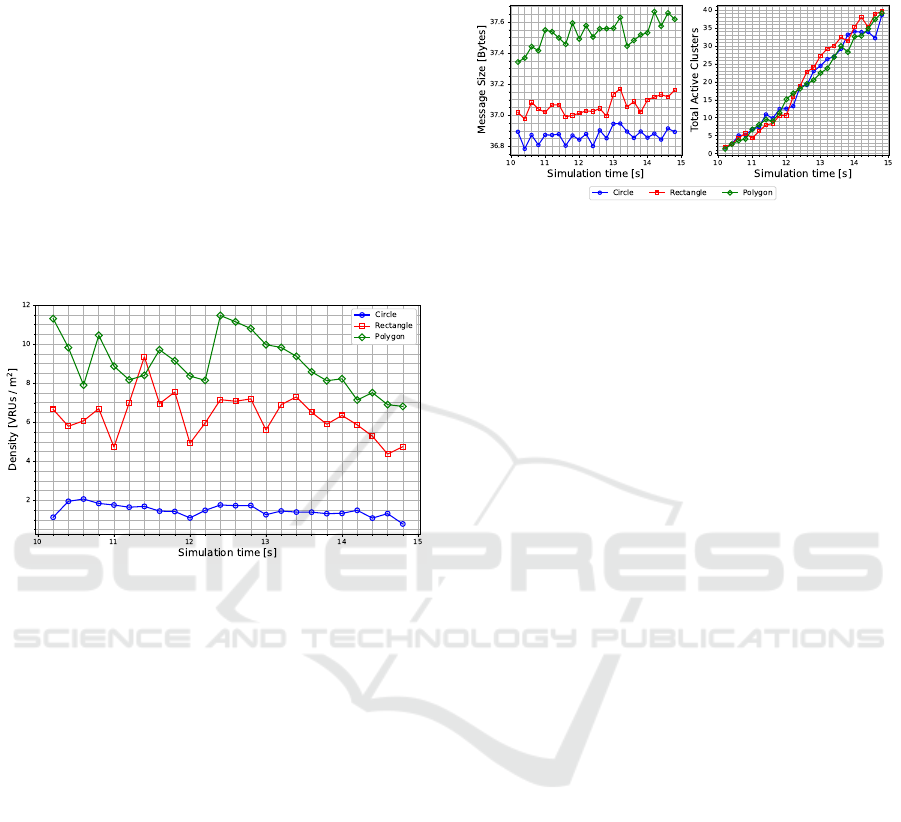
larger areas to cover the participating nodes of a clus-
ter. The polygon presents the highest density overall,
reaching more than five times the amount of VRUs
per squared meter as the circle at 12.4 s. The rectan-
gle is the second best, surpassing the polygon briefly
at 11.2 s. These results indicate that both the rectan-
gle and the polygon have better fitness to the original
point cloud when compared to the circle since there
is less area occupied without necessity. These high-
density values are also associated with the limitations
of pedestrian simulations in SUMO since it is unreal-
istic for twelve VRUs to occupy the same squared me-
ter. However, the results should still be interpreted as
an upper bound of the service, illustrating the higher
clustering potential of rectangles and polygons.
Figure 4: Cluster density for each shape.
Moreover, the rectangles and polygons also
present more spikes in the curves, as shown in Figure
4. A possible cause is that the shapes are more sus-
ceptible to sudden cardinality changes as the VRUs
join and leave clusters due to the bounding box be-
ing tighter-fitted around the point cloud. After 12.4
s, there is a noticeable decline in the densities for
the three shape types, which can be associated with
the VRUs drifting apart due to them taking different
routes, resulting in a more sparse point cloud.
Regarding the average message size, Figure 5
shows that the circular bounding boxes offer the
smallest values with an average of about 36.85 bytes,
confirming the assumption that this type yields the
smallest increment to the CIC. Polygons result in
the largest VAM sizes among the geometries and the
highest difference between minimum and maximum
reached values, respectively, 37.35 and 37.67 bytes.
This gap could be associated with polygons being the
only shape type that changes the amount of data el-
ements included in the message depending on each
cluster. As the average cluster cardinality grows due
to more VRUs entering the crossing, the number of
data elements needed also increases. Once again,
rectangles are an intermediate option, with an aver-
age message size larger than circles but smaller than
polygons, standing approximately at 37.05 bytes.
Figure 5: Average message size (left) and average number
of active clusters (right) for each shape.
When observing the number of active clusters af-
ter the DCC starts operating, Figure 5 indicates that
as time passes, the number of clusters present in the
crossing increases similarly for all shape types. This
increase helps explain the rising trend in average mes-
sage size, with varying results based on the increment
that each geometry type adds to the CIC.
Evaluation of these parameters highlights an inter-
esting aspect of the clustering of VRUs on the VBS.
The circular bounding boxes offer the smallest mes-
sage increment and, therefore, are suited for applica-
tions in which channel efficiency is desired, with the
drawback that the generated shape has low density.
These characteristics mean that when using circular
bounding boxes, it is hard to determine the position
of the VRUs within the cluster.
Polygons exhibit larger average message sizes,
which escalate along with cardinality. However, they
offer increased cluster density, indicating a better-
fitted resulting geometry. This accuracy improves
safety as it is easier for other road users to avoid col-
liding with the member VRUs described by a poly-
gon. Thus, this shape type is advantageous in less
crowded scenarios where message sizes and channel
occupation are less critical.
Rectangles offer a compromise between circles
and polygons, with the second-best density and mes-
sage size. New metrics can prove fundamental for this
line of study, as further research into the impact of
rectangles on the VBS is necessary to determine use
cases in which this shape type can be beneficial. Some
parameters to evaluate in the future are the position er-
ror among the members, average cluster lifetime, and
rate of VRUs clustered versus non-clustered.
When the average number of cluster creation, join,
leave and breakup events are taken into account, it
can be noted that the shape choice also affects the
clustering dynamics. For instance, Table 2 demon-
strates comparable creation and breakup rates across
all shapes, consistent with the number of active clus-
What Is the Right Bounding Box of a VRU Cluster in V2X Communication? How to Form a Good Shape?
153

ters in Figure 5. Rectangles exhibit more join and
leave occurrences, followed by polygons. This be-
havior fits the assumptions related to the spikes from
Figure 4, that the tight-fitting nature of these shapes
leads to more VRUs entering and leaving a cluster
coverage despite the use of the padding distance d
B f
(Equation 1). Rectangles appear to be especially sus-
ceptible to this issue, probably due to the constraints
that this shape type presents when covering a point
cloud due to its limited number of vertices.
Table 2: Average amount of cluster events per shape type.
Event Circle Rectangle Polygon
Creation 100.333 100.333 102.167
Join 10,325.333 10,477.167 10,373.833
Leave 10,080.833 10,296.833 10,181.667
Breakup 60.167 58.167 60.000
One possible future work is the simulation of the
same scenario with different numbers of actors, test-
ing if, for less crowded use cases, the cluster cre-
ation and operations behave the same. Evaluating
ETSI 103 300’s default values for cluster compati-
bility and message generation times is recommended
since the different VRU types should present very dif-
ferent kinematic behavior.
Moreover, simulating different traffic scenarios
could confirm if different bounding box types are
more suited for particular use cases, leading to the
definition of parameters to decide which shape to cre-
ate. Another topic to be explored is the overlap of
bounding boxes, as long and frequent occurrences
could indicate a shape is inadequate for a use case
since it could pose a safety or operational issue due
to the region of uncertainty generated by two clusters
occupying the same area.
Even if the average message sizes are distinct,
their maximum difference is an arguably small value
of about one byte. At the same time, many cluster
events occurred on the 5 s of data recorded. There-
fore, more metrics, such as the Channel Busy Ra-
tio (CBR) from the DCC (ETSI, 2015), should also
be used to verify if the geometry choice is signifi-
cant to the channel performance. These parameters
could even lead to a dynamic change of the clustering
parameters and shape type based on the state of the
channel occupation and the current traffic situation.
7 CONCLUSION
This work has extended the VRU Basic Service from
the ITS-G5 standard by introducing the data structure
Cluster Map to assist in clustering. Also, as a con-
tribution, bounding box formation strategies for all
the shape types determined by ETSI TS 103 300 were
suggested, using the Cluster Map and computational
geometry strategies. Summarizing these methods are
Algorithms 3, 4 and 5. Furthermore, this work sug-
gests a new condition to start a cluster breakup trig-
gered by the leader when it detects insufficient cardi-
nality for a determined elapsed time. This condition
assists the VBS by proposing a timeout for an unsuc-
cessful cluster creation event.
This work proposes and uses the cluster density
and average message size parameters to evaluate how
each shape behaves in a crowded traffic use case. The
first parameter measures how well a bounding box
uses its coverage space to contain all member VRUs,
which means that a higher density indicates that a
cluster does not occupy much unnecessary space to
protect its participants. Average message size is a
measurement to determine which shapes contribute
the most to channel occupation through their incre-
ment to the CIC.
Those functionalities, shaping methodologies, and
metrics were then implemented computationally in
V2X simulations using the Artery framework, with
the support of the InTAS traffic model simulated
through SUMO. The test scenario contains several
pedestrians in a single crossing, resulting in many op-
portunities to form clusters and interact with other
VRUs and vehicles. Eighteen simulations, six for
each bounding box shape type, were executed.
Simulation results show that circular bounding
boxes are indicated when a use case prioritizes
smaller messages over spatial efficiency or shape rep-
resentation accuracy. This performance is adequate
for busy wireless channel scenarios, so reducing con-
gestion is the priority. Polygons are fit for the op-
posite situation, where the VBS can afford to send
larger messages with the benefit of representing the
points contained in the cluster with a tighter, more
detailed bounding box. Rectangles offer moderate
cluster density and message size. Thus, identify-
ing use cases where rectangular bounding boxes are
best suited poses a considerable opportunity for fu-
ture work. Knowing more about the situations in
which each geometry type excels could lead to im-
provements to the VBS as it could, in the future, con-
tain specific purposes for each shape type.
Additionally, introducing metrics related to chan-
nel performance is a research path that could lead
to new insights into the management of the cluster-
ing operations. For instance, an intriguing investiga-
tion would involve assessing the viability of a spe-
cific shape type when the channel occupation exceeds
a designated CBR threshold.
VEHITS 2024 - 10th International Conference on Vehicle Technology and Intelligent Transport Systems
154

ACKNOWLEDGEMENTS
The authors would like to acknowledge and thank the
Bayerisches Staatsministerium f
¨
ur Wirtschaft, Lan-
desentwicklung und Energie for partially funding this
work through the ”RealFutuRe” project (DIK-2105-
0051//DIK0281/02).
REFERENCES
CAR 2 CAR Communication Consortium (2019). Guidance
for day 2 and beyond roadmap. Retrieved from: http:
//tinyurl.com/c2ccc-Roadmap.
CAR 2 CAR Communication Consortium (2023). Use
Cases. Retrieved from:: http://tinyurl.com/c2ccc-
UseCases.
Decae, R. (2023). Annual statistical report on road safety in
the EU 2022. Technical report, European Road Safety
Observatory, Brussels. Retrieved from: http://tinyurl.
com/ERSO-AnnualReport2022.
Ericson, C. (2004). Real-Time Collision Detection. CRC
Press, Inc., USA.
European Telecommunications Standards Institute (2010).
ETSI EN 302 665, Intelligent Transport Systems
(ITS); Communications Architecture, V1.1.1.
European Telecommunications Standards Institute (2014).
ETSI EN 302 895, Intelligent Transport Systems
(ITS); Vehicular Communications; Basic Set of Ap-
plications; Local Dynamic Map (LDM), V1.1.1.
European Telecommunications Standards Institute (2015).
ETSI TS 103 175, Intelligent Transport Systems
(ITS); Cross Layer DCC Management Entity for op-
eration in the ITS G5A and ITS G5B medium, V1.1.1.
European Telecommunications Standards Institute (2021a).
ETSI TR 103 300-1, Intelligent Transport Systems
(ITS); Vulnerable Road Users (VRU) awareness; Part
1: Use Cases definition; Release 2, V2.2.1.
European Telecommunications Standards Institute (2021b).
ETSI TS 103 300-2, Intelligent Transport Systems
(ITS); Vulnerable Road Users (VRU) awareness; Part
2: Functional Architecture and Requirements defini-
tion; Release 2, V2.2.1.
European Telecommunications Standards Institute (2021c).
ETSI TS 103 300-3, Intelligent Transport Systems
(ITS); Vulnerable Road Users (VRU) awareness; Part
3: Specification of VRU awareness basic service; Re-
lease 2, V2.1.2.
Festag, A. (2015). Standards for vehicular communication-
from IEEE 802.11p to 5G. e & i Elektrotechnik und
Informationstechnik, 132(7):409–416.
Gomes, E. L., Fonseca, M., Lazzaretti, A. E., Munaretto,
A., and Guerber, C. (2022). Clustering and Hierarchi-
cal Classification for High-Precision RFID Indoor Lo-
cation Systems. IEEE Sensors Journal, 22(6):5141–
5149.
Lakshmanan, V., G
¨
orner, M., and Gillard, R. (2021). Practi-
cal Machine Learning for Computer Vision. O’Reilly
Media, Inc, 1 edition.
Liu, Y., Liu, B., and Zhang, H. (2020). Estimation of 2D
Bounding Box Orientation with Convex-Hull Points
- A Quantitative Evaluation on Accuracy and Effi-
ciency. In 2020 IEEE Intelligent Vehicles Symposium
(IV), pages 945–950. IEEE.
Lobo, S., Barbosa da Silva, L., and Facchi, C. (2023). To
Cluster or not to Cluster: A VRU Clustering Based
on V2X Communication. 2023 IEEE Conference on
Intelligent Transportation Systems (ITSC 2023).
Lobo, S., Festag, A., and Facchi, C. (2022). Enhanc-
ing the Safety of Vulnerable Road Users: Messaging
Protocols for V2X Communication. In 2022 IEEE
96th Vehicular Technology Conference (VTC2022-
Fall), pages 1–7.
Lobo, S., Neumeier, S., Fern
´
andez, E., and Facchi, C.
(2020). InTAS - The Ingolstadt Traffic Scenario for
SUMO. SUMO Conference Proceedings, pages 73–
92.
Lopez, P. A., Wiessner, E., Behrisch, M., Bieker-Walz, L.,
Erdmann, J., Flotterod, Y.-P., Hilbrich, R., Lucken, L.,
Rummel, J., and Wagner, P. (2018). Microscopic Traf-
fic Simulation using SUMO. In 2018 21st Interna-
tional Conference on Intelligent Transportation Sys-
tems (ITSC), pages 2575–2582. IEEE.
Lusvarghi, L., Grazia, C. A., Klapez, M., Casoni, M., and
Merani, M. L. (2023). Awareness Messages by Vul-
nerable Road Users and Vehicles: Field Tests via
LTE-V2X. IEEE Transactions on Intelligent Vehicles,
8(10):4418–4433.
Riebl, R., G
¨
unther, H.-J., Facchi, C., and Wolf, L. (2015).
Artery: Extending Veins for VANET applications. In
2015 International Conference on Models and Tech-
nologies for Intelligent Transportation Systems (MT-
ITS), pages 450–456.
Rupp, M. and Wischhof, L. (2023). Evaluation of the
Effectiveness of Vulnerable Road User Clustering in
C-V2X Systems. In 2023 IEEE International Con-
ference on Omni-layer Intelligent Systems (COINS),
pages 1–5. IEEE.
Shahraki, A., Taherkordi, A., Haugen, Ø., and Eliassen,
F. (2020). Clustering objectives in wireless sensor
networks: A survey and research direction analysis.
Computer Networks, 180:107376.
Shamos, M. I. (1978). Computational Geometry. PhD the-
sis, Yale University.
V, P. M. and Pankaj, D. S. (2021). 3DYOLO: Real-time
3D Object Detection in 3D Point Clouds for Au-
tonomous Driving. In 2021 IEEE International In-
dia Geoscience and Remote Sensing Symposium (In-
GARSS), pages 41–44. IEEE.
Wang, Z., Yu, B., Chen, J., Liu, C., Zhan, K., Sui, X.,
Xue, Y., and Li, J. (2019). Research on Lidar Point
Cloud Segmentation and Collision Detection Algo-
rithm. In 2019 6th International Conference on In-
formation Science and Control Engineering (ICISCE),
pages 475–479. IEEE.
Zoghlami, C., Kacimi, R., and Dhaou, R. (2022). Dynam-
ics of Cooperative and Vulnerable Awareness Mes-
sages in V2X Safety Applications. In 2022 Interna-
tional Wireless Communications and Mobile Comput-
ing (IWCMC), pages 853–858. IEEE.
What Is the Right Bounding Box of a VRU Cluster in V2X Communication? How to Form a Good Shape?
155
