
Assessment of Census and Remote Sensing Data to Monitor Irrigated
Agriculture in Mexico
Jean-Francois Mas
1 a
and Azucena P
´
erez-Vega
2 b
1
Centro de Investigaciones en Geograf
´
ıa Ambiental, Universidad Nacional Aut
´
onoma de M
´
exico, Morelia, Mexico
2
Departamento de Geom
´
atica e Hidra
´
ulica, Universidad de Guanajuato, Guanajuato, Mexico
Keywords:
Irrigated Agriculture, Evapotranspiration, Water, Remote Sensing.
Abstract:
Irrigated agriculture faces imminent threats, such as escalating water scarcity and climate change impacts. Wa-
ter scarcity is particularly crucial in countries such as Mexico, where approximately 41% of the land comprises
arid and semi-arid zones. The study assesses the quality and consistency of monitoring irrigated agriculture
in a municipality of the State of Guanajuato in central Mexico using agricultural census information and ad-
vanced remote sensing data from Landsat 8, MODIS, and ECOSTRESS. Preliminary analyses showcase the
dominance of wheat and barley crops in P
´
enjamo, with MODIS time series effectively capturing crop growth
dynamics. The study highlights the potential of remote sensing in estimating irrigated crop dynamics propor-
tions and the associated water consumption at different scales.
1 INTRODUCTION
Irrigated agriculture is crucial to food and economic
security in many countries worldwide. However, this
practice has faced many significant challenges in re-
cent decades that threaten its long-term sustainability.
Two of the most pressing problems facing this sector
are increasing water scarcity and the effects of climate
change. The combination of these factors presents a
worrying picture that demands a deeper and more de-
tailed understanding of the dynamics of irrigated agri-
culture.
The National Commission of Arid Zones
(CONAZA) reports that Mexico has around 41% arid
and semi-arid zones. Water scarcity has emerged
as a fundamental obstacle to irrigated agriculture in
this context. As water demand increases for both
agricultural and urban use, available water resources
are reaching critical levels. This imbalance between
water supply and demand raises crucial questions
about the long-term viability of irrigated agriculture,
which has historically relied heavily on water sources
now threatened by overexploitation and climate
variability (Madramootoo and Fyles, 2010). Climate
change adds complexity to this problem, affecting
precipitation patterns and increasing the frequency
a
https://orcid.org/0000-0002-6138-9879
b
https://orcid.org/0000-0002-9683-4207
and intensity of extreme weather events (Hanjra and
Qureshi, 2010).
In Mexico, the two agricultural cycles, au-
tumn/winter and spring/summer, play a crucial role
in the country’s food production. During the au-
tumn/winter, irrigated agriculture is relevant since
rains are scarce and irrigation systems primarily de-
pend on guaranteeing the necessary water supply for
crops. In contrast, the spring/summer cycle coincides
with the rainy season, which reduces the need for irri-
gation in certain regions (see Figure 1). Understand-
ing the dynamics of irrigated agriculture and asso-
ciated water consumption is crucial for efficient wa-
ter resource management and climate change adapta-
tion strategies. Addressing these challenges requires
a multidisciplinary approach that integrates scientific,
technological and policy knowledge to ensure the sus-
tainability of irrigated agriculture in a changing en-
vironment. In this work, we will limit ourselves to
evaluating some official census and remote sensing
inputs to monitor irrigated agriculture in a municipal-
ity in central Mexico. The aim is to evaluate the qual-
ity and consistency of the information obtained from
these various sources.
Mas, J. and Pérez-Vega, A.
Assessment of Census and Remote Sensing Data to Monitor Irrigated Agriculture in Mexico.
DOI: 10.5220/0012701500003696
Paper published under CC license (CC BY-NC-ND 4.0)
In Proceedings of the 10th International Conference on Geographical Information Systems Theory, Applications and Management (GISTAM 2024), pages 181-186
ISBN: 978-989-758-694-1; ISSN: 2184-500X
Proceedings Copyright © 2024 by SCITEPRESS – Science and Technology Publications, Lda.
181
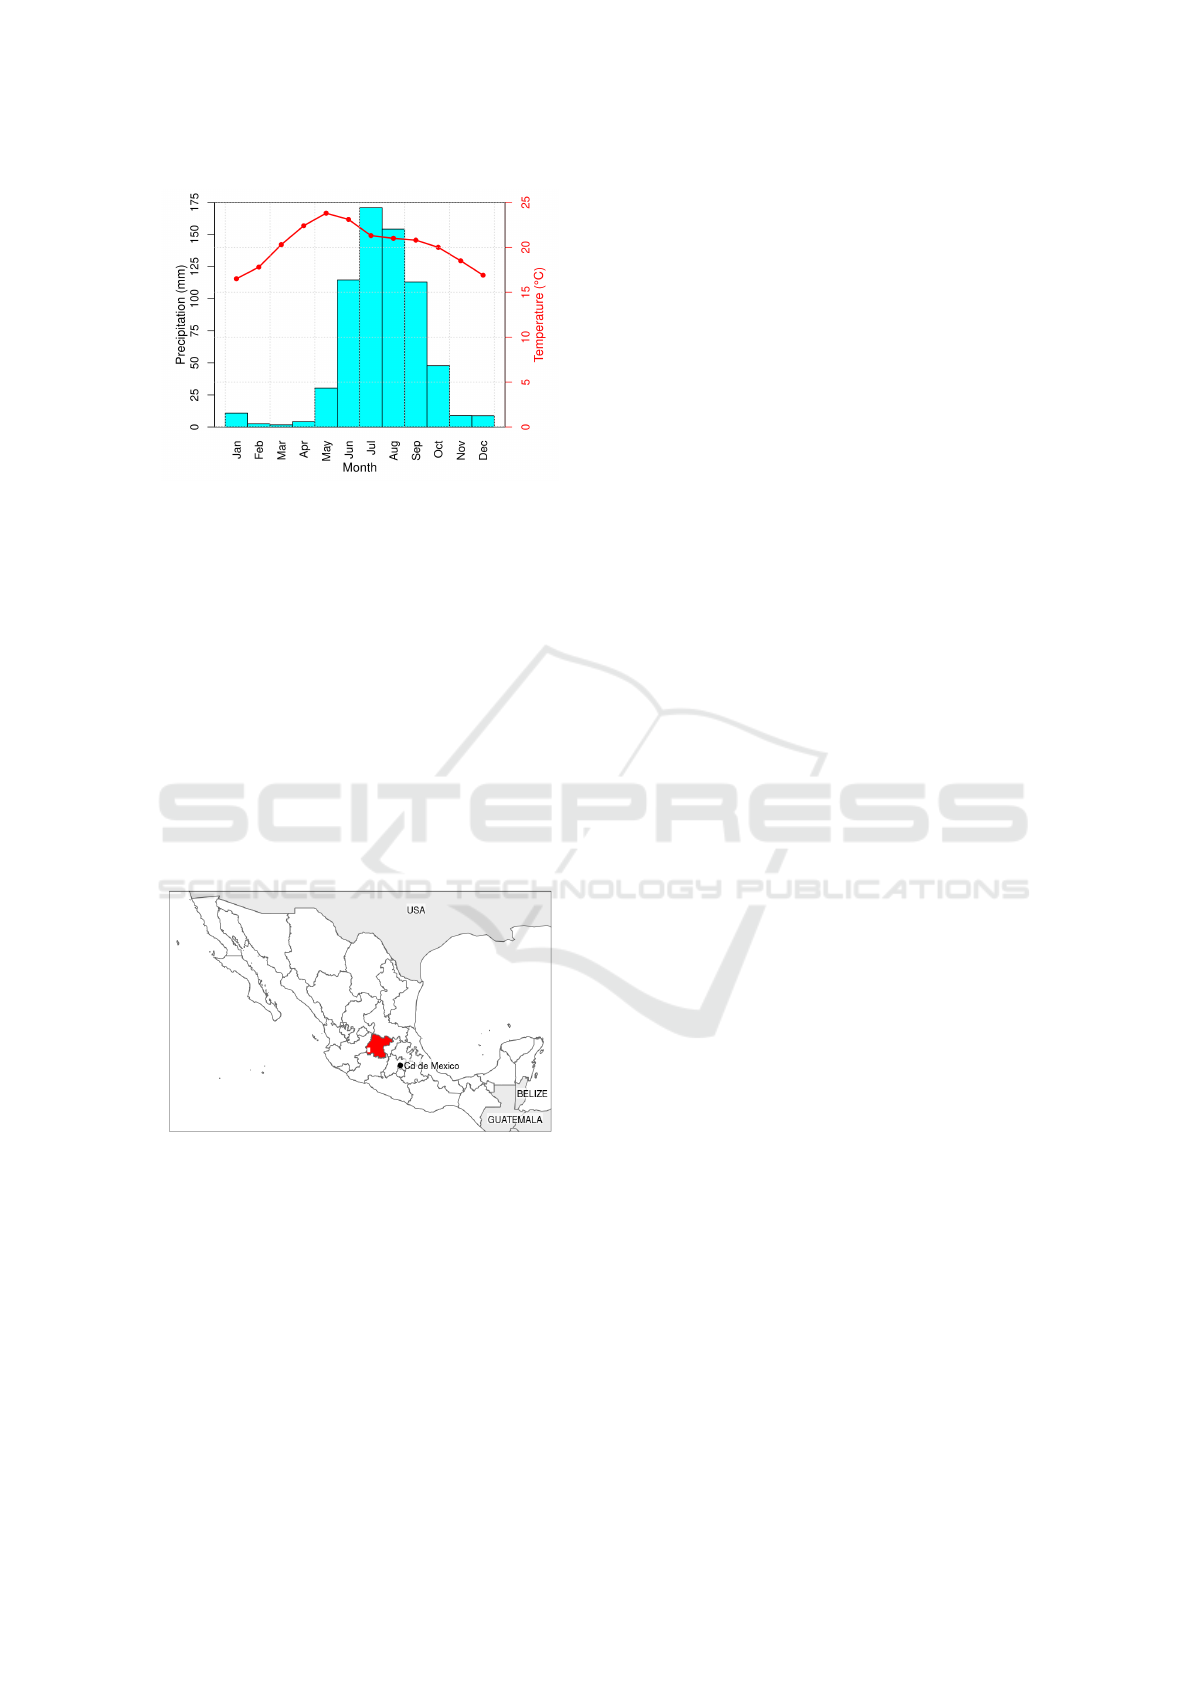
Figure 1: Ombro-thermal diagram of P
´
enjamo,
Guanajuato. (Data obtained from CONAGUA
https://smn.conagua.gob.mx).
2 STUDY AREA
The State of Guanajuato is located in central Mexico
(Figure 2). The historical evolution of Guanajuato’s
agricultural land can be traced back to pre-Hispanic
times, but a significant increase in croplands occurred
during the colonial period (P
´
erez-Vega, 2011). Nowa-
days, Guanajuato is among the Mexican states with
the highest percentage of transformed covers (around
60%), including irrigated agriculture (21.5%), rain-
fed agriculture (25.7%) and pasture (9.7%) (Palacios
et al., 2000).
Figure 2: State of Guanajuato in Mexico (red polygon). The
study area (P
´
enjamo) corresponds to the white square.
Regarding water resources management, ground-
water supplies 70% of human needs; however, all
aquifers in the state register levels of overexploitation.
Most of the water is destined for agricultural activity.
Water availability in the state is below scarcity, with
845 m
3
/inhabitant/year, while the national average is
3,705 m
3
/inhabitant/year (IEE, 2008).
3 MATERIAL
3.1 Agricultural Census and Climate
Data
Data from the Agri-Food and Fisheries Information
Service (SIAP) provide valuable information on agri-
cultural activities in Mexico (http://infosiap.siap.gob.
mx/gobmx/datosAbiertos.php). These open-access
data are presented in tables and offer details on the
cultivated, harvested and damaged areas by crop cy-
cle and production mode (rain-fed / irrigation) and
are grouped according to spatial units such as states,
municipalities and irrigation districts (from 2003).
The information provided by the SIAP offers a de-
tailed vision of agriculture in Mexico during the
last decades, facilitating agricultural sector decision-
making (P
´
erez-Vega and Mas, 2023).
We also used data from the National Water Com-
mission (CONAGUA) meteorological stations.
3.2 Cartography
We used the land use and vegetation map, scale
1:250,000 from INEGI, the official cartography and
statistics agency of Mexico, to delimit the irrigation
areas and a map of the municipalities (INEGI) to spa-
tialize the agricultural census data.
3.3 Remote Sensing Data
We used Landsat 8 multispectral imagery. These im-
ages have nine spectral bands (spatial resolution of
30 meters), including a panchromatic band with 15 m
resolution. The temporal resolution of 16 days and the
existence of a historical collection with images with
this spatial resolution since the 1980s facilitates the
monitoring of changes in land cover and the detection
of environmental phenomena over time.
The MOD13A1 product, version 6.1, derived from
data collected by the MODIS (Moderate Resolution
Imaging Spectroradiometer) sensor, focuses on global
vegetation monitoring. It offers a spatial resolution of
500 meters, allowing evaluation of large-scale vegeta-
tion patterns with a frequency of 16 days since 2000.
Among its notable features is the ability to calculate
the Normalized Difference Vegetation Index (NDVI),
a crucial metric for assessing the health and density
of vegetation in different regions of the planet.
Another derivative product of the MODIS sensor
is the MOD16A2 (version 6), explicitly designed to
estimate water balance on a global scale. This prod-
uct provides detailed information on evapotranspira-
tion (ET) and water availability at the Earth’s surface.
GISTAM 2024 - 10th International Conference on Geographical Information Systems Theory, Applications and Management
182

With a spatial resolution of 500 meters and for periods
of 8 days, the MOD16A2 allows a detailed analysis of
water consumption patterns at a regional level, thus
contributing to the sustainable management of water
resources.
The ECOSTRESS sensor (Ecosystem Spaceborne
Thermal Radiometer Experiment on Space Station)
has been developed to measure the temperature
of the Earth’s surface with high precision. The
ECO3ETPTJPL product provides detailed data on In-
stantaneous Latent Heat Flux (W/m
2
), which is di-
rectly related to evapotranspiration, at a spatial resolu-
tion of approximately 70 meters. This high resolution
allows the study of specific phenomena at the local
and regional level, providing valuable information to
understand hydrological processes and the response
of ecosystems to changes in water availability.
We used the Application for Extracting and Ex-
ploring Analysis Ready Samples (AppEEARS, avail-
able at https://appeears.earthdatacloud.nasa.gov/) tool
to obtain ECOSTRESS evapotranspiration values.
Climatic data were obtained and processed with the
Climex program (
´
Angel Marqu
´
es-Mateu et al., 2023).
We performed all other statistical analysis, mapping
and graphing operations with the R program (R Core
Team, 2021).
4 METHODS
4.1 Preliminary Analysis of Census
Data
The SIAP data were analyzed to determine which mu-
nicipalities have important irrigation areas (more than
10,000 ha) dominated by a single crop (more than
80%, during 2003-2023) and whether a change in
dominant crop occurs. In this preliminary study, we
sought a more straightforward case to avoid dealing
with an area with different crops with different spec-
tral responses and planting and harvesting schedules.
4.2 Analysis of Agricultural Dynamics
and Estimation of the Sown Area
We prepared time series with MODIS (ET and NDVI,
2002-2023) and ECOSTRESS (Latent Heat Flux,
2018-2020) data. We selected 30 random points in ir-
rigation areas and drew graphs showing the temporal
variations of these variables, allowing us to observe
the areas sown or not in the two cycles.
In the next step, we evaluated to what extent re-
mote sensing data at different spatial resolutions allow
evaluation of the sown area during the winter/autumn
cycle. We computed the correlation coefficient be-
tween the sown area reported by the SIAP and in-
dices obtained from the images as the sum of the
NDVI and ET values in the irrigation areas during
the autumn/winter cycle. An unmixing exercise of
the MODIS images was also carried out to estimate
the sown area obtained from the Landsat image for
the same date.
To estimate the evapotranspiration of croplands,
we used the Blaney-Criddle method (Blaney and
Criddle, 1950) because it is accurate enough and only
requires temperature data (Equation 1).
ET
c
= K
c
∑
p(0.457T
mean
+ 8.128) (1)
Where: Et
c
is the crop evapotranspiration (mm),
T
mean
is the mean daily temperature, p is the mean
daily percentage of annual daytime hours, and K
c
is
the crop coefficient.
We obtained the temperature from data from cli-
matological stations for 1981-2010. We chose sta-
tions that best represented the climatic conditions of
irrigated areas. We used crop coefficients from local
and international sources (Allen et al., 1998;
´
Angeles
Hern
´
andez et al., 2017; INIFAP, 2001). We compared
these ET values with those obtained from the analysis
of MODIS and ECOSTRESS images.
5 RESULTS
One municipality that met the search criteria was
P
´
enjamo in the State of Guanajuato. The dominant ir-
rigated crop (more than 80% during 2002-2014) was
wheat, and from 2016, wheat and barley. The to-
tal irrigation area sown during 2003-2022 varied be-
tween 12,000 and 34,500 ha (autumn-winter cycle)
and 18,000 and 37,000 ha (spring-summer cycle).
As shown in Figures 3 and 4, MODIS time series
(NDVI and ET) allow crop growth to be clearly ob-
served in both cycles.
The ECOSTRESS data obtained for the same
points were very noisy. We observed very high la-
tent flux values, which the uncertainty layer did not
allow to eliminate (Figure 5).
The NDVI was calculated based on a Landsat 8
image from March 2, 2020, when the contrast be-
tween cultivated and non-cultivated areas appeared
strongest. We determined visually that the value of
0.3 separated the areas with crops. The binary crop
map obtained by thresholding indicates a cultivated
area of 13,650 ha, while the SIAP reports a very close
value (13,905 ha). The Landsat binary crop map was
overlaid with the MODIS NDVI image of the same
Assessment of Census and Remote Sensing Data to Monitor Irrigated Agriculture in Mexico
183
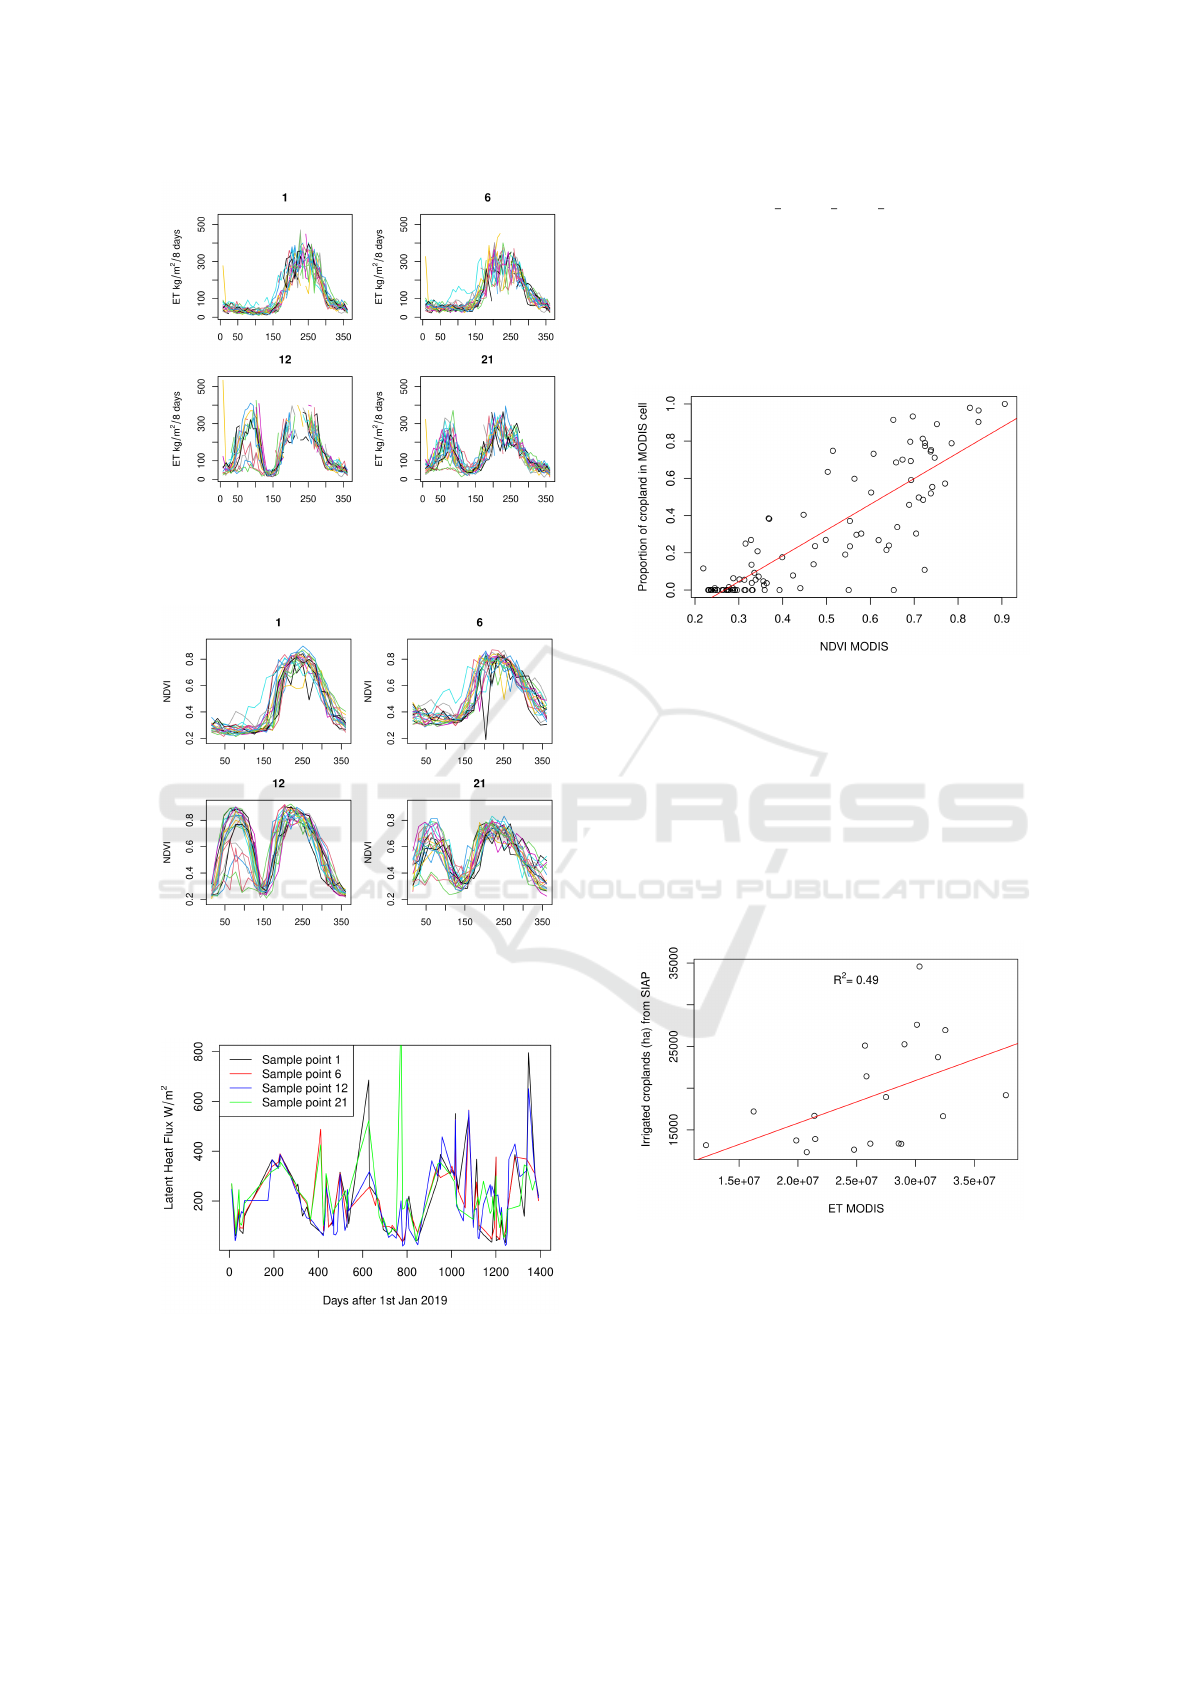
Figure 3: Variation of evapotranspiration (obtained from
MODIS) over a year on some sampling points of the irriga-
tion area of P
´
anjamo, Guanajuato. Each color represents a
year on the period 2003-2022, time is shown as julian days.
Figure 4: Variation of mean NDVI (obtained from MODIS)
over a year on some sampling points of the irrigation area
of P
´
anjamo, Guanajuato. Each color represents a year on
the period 2003-2022, time is shown as julian days.
Figure 5: Variation of latent heat flux (obtained from
ECOSTRESS) over 2019-2022 on the same sampling points
of the irrigation area of P
´
anjamo, Guanajuato. Time is
shown as julian days from 1st Jan. 2019.
period (MOD13A1 NDVI 2020 081), thus allowing
the proportion of crops in each 500 m MODIS cell
to be calculated. The correlation coefficient between
NDVI and crop proportion was 0.85, which suggests
that NDVI is a good indicator of crop proportion (Fig
6). We fitted a linear model to explain the crop ratio
with the NDVI value. The model presented a good fit
(Adjusted R-squared = 0.82).
Figure 6: Relationship between the proportion of irrigated
crop in coarse MODIS pixels and NDVI values.
We sought to estimate the relationship between the
NDVI and ET values from MODIS on the one hand
and the total area sown according to the SIAP during
2003-2022. To do this, we calculated the sum of each
year’s NDVI and ET values of the irrigation district
cells. We evaluated the relationship between these
values and the sown areas reported by the SIAP. Sim-
ilarly, the unmixing model reported in the previous
paragraph for each year (Figures 7, 8 and 9).
Figure 7: Relationship between the yearly swon irrigated
area (autumn/winter cycle) during 2003-2022 from SIAP
and the sum of MODIS ET values.
The best relationship was obtained using the evap-
otranspiration (R
2
=0.49). However, it is not a strong
relationship and does not allow us to estimate the
snow-irrigated area accurately. These limitations have
reported in the literature (Wu et al., 2022).
GISTAM 2024 - 10th International Conference on Geographical Information Systems Theory, Applications and Management
184
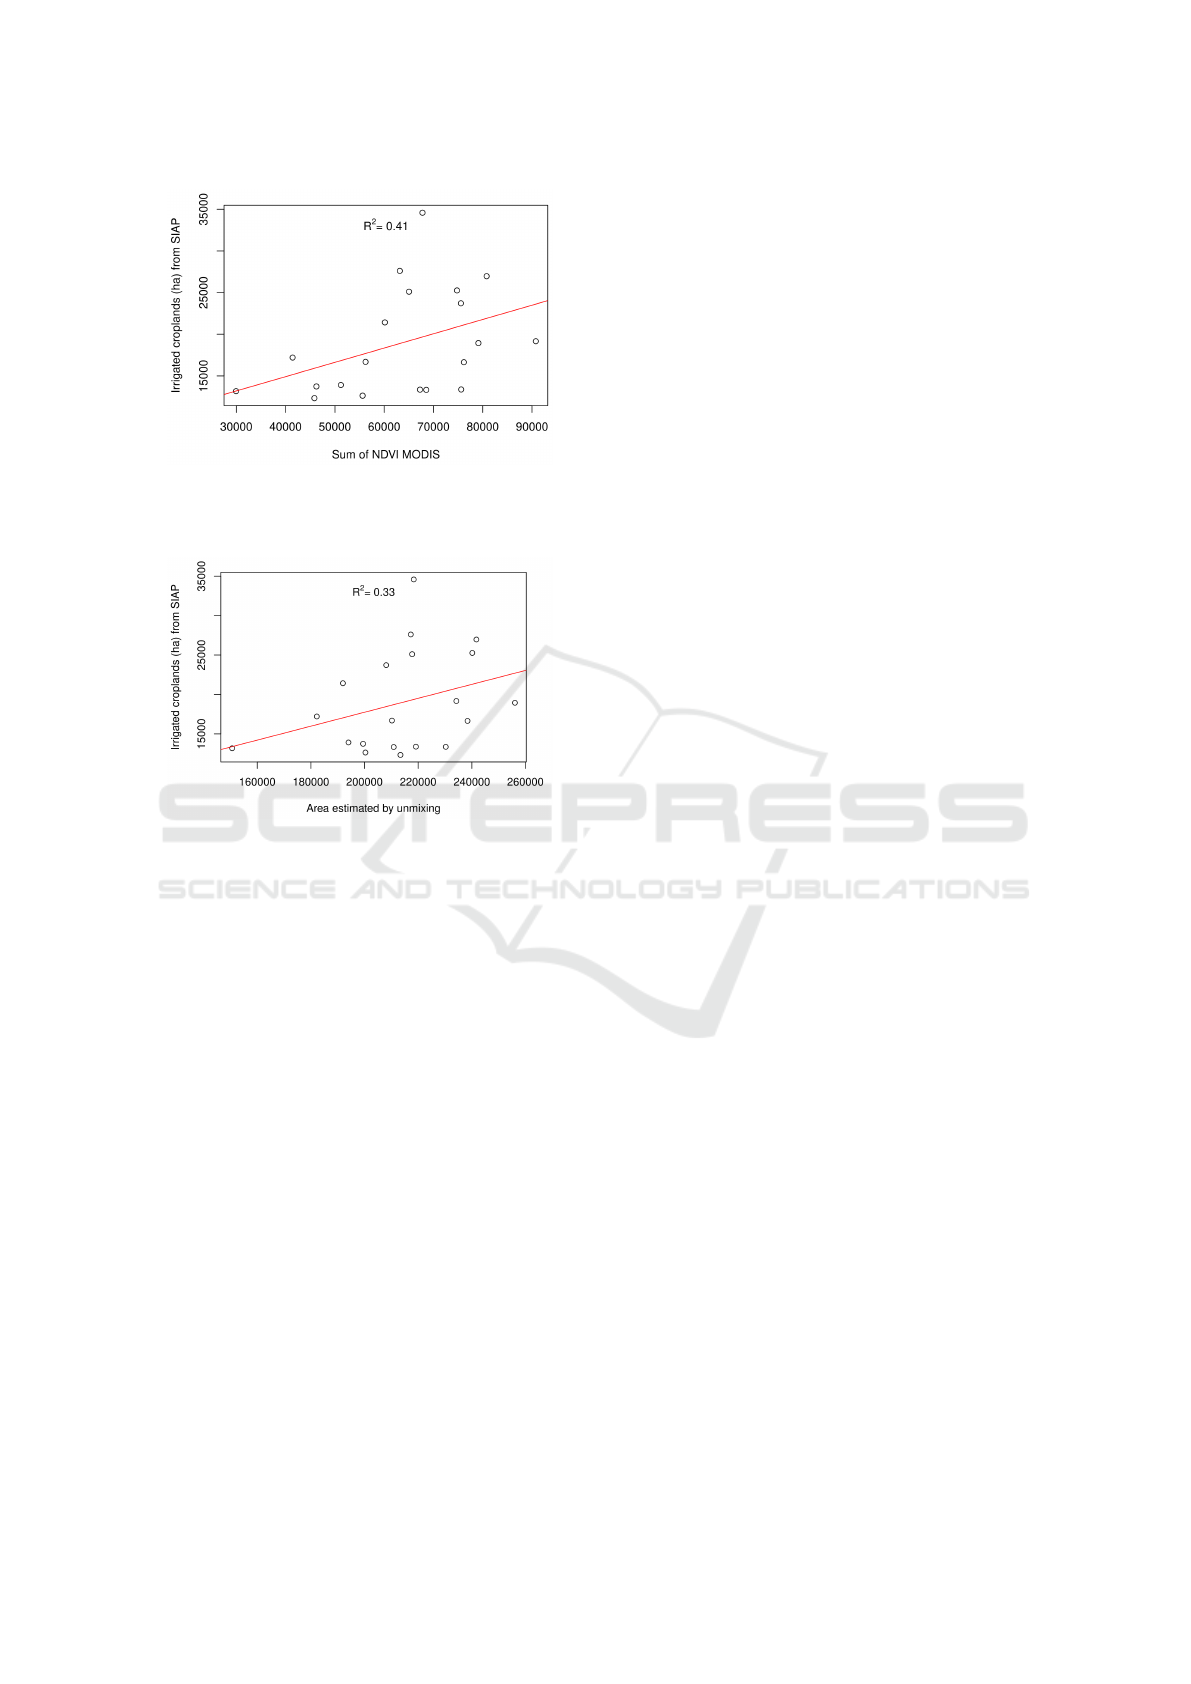
Figure 8: Relationship between the yearly swon irrigated
area (autumn/winter cycle) during 2003-2022 from SIAP
and the sum of MODIS NDVI values.
Figure 9: Relationship between the yearly swon irrigated
area (autumn/winter cycle) during 2003-2022 from SIAP
and the values obtained by unmixing MODIS NDVI values.
6 DISCUSSION AND
CONCLUSION
This study focuses on evaluating the quality and con-
sistency of information related to irrigated agriculture
in the State of Guanajuato, Mexico, with a particu-
lar emphasis on the municipality of P
´
enjamo, located
in the central part of Mexico. The methods include
analysing agricultural census data, cartography, and
remote sensing data from various sensors, such as
Landsat 8, MODIS, and ECOSTRESS. The research
specifically focused on P
´
enjamo due to its relevance
in irrigated agriculture and the challenges posed by
water scarcity in the region.
The results demonstrated the effectiveness of
MODIS time series in clearly depicting crop growth
in both cycles. However, ECOSTRESS data exhibited
high noise levels, impacting the clarity of latent flux
values. In the future, we will also use Sentinel-2 data,
which presents high spatial and temporal resolution.
Because different modalities of data can complement
each other by combining their strengths and reducing
their limitations, Multimodal remote sensing (MRS)
methods are beneficial for crop monitoring and are
gaining popularity (Karmakar et al., 2024).
The findings of this preliminary study provide
valuable insights into the dynamics of irrigated agri-
culture. The effectiveness of MODIS time series in
monitoring crop growth during different agricultural
cycles highlights the utility of coarse remote sensing
data in assessing irrigated agriculture over large ex-
tensions (e.g. the entire Mexican territory).
These findings contribute to the broader discus-
sion on applying multidisciplinary approaches, com-
bining agricultural census data, cartography, and re-
mote sensing, to address the sustainability of irrigated
agriculture in regions facing water scarcity and cli-
mate variability. The research underscores the impor-
tance of integrating different data sources and tech-
nologies to understand irrigated agriculture dynam-
ics comprehensively. As water scarcity intensifies
globally, the methods and insights presented in this
study can inform policymakers in developing effec-
tive strategies for sustainable water resource manage-
ment and climate change adaptation in irrigated agri-
culture.
ACKNOWLEDGEMENTS
This study was carried out within the scope of
the PAPIIT-UNAM project (IN112823) entitled:
Azolvamiento y eutroficaci
´
on en presas periurbanas
de zonas templadas de M
´
exico: contribuciones para
su evaluaci
´
on y prospecci
´
on and An
´
alisis de la Cali-
dad, Cantidad, Gesti
´
on y Pol
´
ıticas P
´
ublicas ante es-
cenarios de Cambio Clim
´
atico en la Presa Sol
´
ıs, Gua-
najuato, Direcci
´
on de Apoyo a la Investigaci
´
on y el
Posgrado, Universidad de Guanajuato).
REFERENCES
Allen, R., Pereira, L., Raes, D., and Smith, M. (1998).
Crop evapotranspiration – guidelines for computing
crop water requirements. FAO Irrigation and drainage
papers 56, FAO, Roma, Italy.
Blaney, H. and Criddle, W. (1950). Determining water re-
quirements in irrigated areas from climatological and
irrigation data. Soil Conservation Service Technical
Papers 96, US Department of Agriculture, Washing-
ton, D.C.
Hanjra, M. A. and Qureshi, M. E. (2010). Global water
crisis and future food security in an era of climate
change. Food Policy, 35(5):365–377.
IEE (2008). Informe ambiental del Estado de Guanajuato.
Technical report, Instituto de Ecolog
´
ıa del Estado.
Assessment of Census and Remote Sensing Data to Monitor Irrigated Agriculture in Mexico
185

INIFAP (2001). Requerimientos h
´
ıdricos de especies an-
uales y perennes en las zonas media y altiplano de san
luis potos
´
ı. Folleto t
´
ecnico 12, Instituto Nacional de
Investigaciones Forestales, Agr
´
ıcolas y Pecuarias.
Karmakar, P., Teng, S. W., Murshed, M., Pang, S., Li, Y.,
and Lin, H. (2024). Crop monitoring by multimodal
remote sensing: A review. Remote Sensing Applica-
tions: Society and Environment, 33:101093.
Madramootoo, C. A. and Fyles, H. (2010). Irrigation in the
context of today’s global food crisis. Irrigation and
Drainage, 59(1):40–52.
P
´
erez-Vega, A. and Mas, J.-F. (2023). An
´
alisis espacio-
temporal de la agricultura en M
´
exico: datos relevantes
del SIAP 1980-2020. In XXV Congreso SELPER, La
Paz BCS, 26-27/10/2023.
R Core Team (2021). R: A Language and Environment for
Statistical Computing. R Foundation for Statistical
Computing, Vienna, Austria.
Wu, B., Zhang, M., Zeng, H., Tian, F., Potgieter, A. B., Qin,
X., Yan, N., Chang, S., Zhao, Y., Dong, Q., Boken, V.,
Plotnikov, D., Guo, H., Wu, F., Zhao, H., Deronde, B.,
Tits, L., and Loupian, E. (2022). Challenges and op-
portunities in remote sensing-based crop monitoring:
a review. National Science Review, 10(4):nwac290.
´
Angel Marqu
´
es-Mateu, P
´
erez-Vega, A., and Molada-Tebar,
A. (2023). Climex. https://pypi.org/project/climex/.
´
Angeles Hern
´
andez, J., Trejo Segura, V., Unland Weiss, H.,
Olvera Salgado, D., and Carrillo Castillo, M. (2017).
La eficiencia de aplicaci
´
on y productividad del agua
en los cultivos de trigo y cebada en el distrito de riego
011 “alto r
´
ıo lerma”, guanajuato. In III Congreso Na-
cional de Riego y Drenaje COMEII 2017.
GISTAM 2024 - 10th International Conference on Geographical Information Systems Theory, Applications and Management
186
