
UAV-Based Analysis of Armour Rock
Granulometry and Hydraulic Stability
Alisson Villca
1a
, Muhammad Ali Sammuneh
1b
, Poupardin Adrien
1
, Jena Jeong
1
,
Rani El Meouche
1c
and Georges Chapalain
2
1
Institut de Recherche (IR), ESTP Paris, 94230 Cachan, France
2
Cerema Risques Eau Mer, Margny-Les-Compiègne, 60280, France
Keywords: Granulometry, UAV, Photogrammetry, Image Processing, Stability, Monitoring.
Abstract: Dikes worldwide play a crucial role in mitigating flooding risks. Often, armour rocks are placed within the
wave impact zone to protect the dike from wave loading. To ensure a dike is in optimal condition the
assessment of the hydraulic stability of armour rocks is necessary. This study presents a Granulometric
analysis technique, which is based on UAV photogrammetry and optical digital granulometry to evaluate
the spatial distribution and possible variations in time of armour rocks granulometry and hydraulic stability.
This is a new non-invasive technique with which spatial, temporal changes can be studied. Our study area is
located in Camargue, south of France. This low-laying region, exposed to multiple storms, is among the
most endangered zones by sea level rise. We concluded that monitoring of the dike is possible using this
technology the optical granulometric analysis could be performed on UAV images. We conducted
granulometry distribution calculations for armour rocks, even when they were covered with moss. Our
findings show the spatial variation of granulometry along the dike. In specific areas of interest where
hydraulic stability was assessed, based on the granulometry results, we have found areas with low hydraulic
stability that need to be investigated more thoroughly.
a
https://orcid.org/0009-0005-8274-9940
b
https://orcid.org/0009-0008-4977-7386
c
https://orcid.org/0000-0001-5063-6638
1 INTRODUCTION
The grading curve analysis along with characteristic
sizes of non-cohesive materials is a traditional and
important method that can provide important
parameters for hydraulic modelling. To obtain such
information laboratory and in situ tests exist.
Laboratory sieving involves time-consuming and
effort-intensive activities just the same in situ
techniques, which uses a grid system to measure
single pebbles (Wolman, 1954) or uses instead a
sampling line (Fehr, 1987), can be just as time
consuming.
To overcome these limitations tools for
automatic optical granulometry were developed.
These non-intrusive, low cost methods can obtain
grain size distributions for non-cohesive materials
(Graham et al., s. d.) (Detert & Weitbrecht, 2012)
(Buscombe, s. d.). For the granulometric, analysis of
riverbed depositions a matlab-based tool was
developed, BASEGRAIN, that can recognize,
classify and analyse grain images (Detert &
Weitbrecht, 2012).
Basegrain analysis results can still be meaningful
despite being used with photos taken in suboptimal
conditions. (Detert & Weitbrecht, s. d.)
The potential of the combination of Unmanned
Aerial Systems (UAS) technology and optical
granulometry was studied in previous works. A peak
discharge estimation in the town of Mandra, Greece
(Andreadakis et al., 2020). The median particle size
derived from the granulometric curves were used to
estimate run-off. They compared the results of run-
off estimations calculated with data from UAV and
GNSS surveys which showed minimal difference.
(Lagogiannis & Dimitriou, 2021) combined UAV-
sensed data with empirical hydraulic equations to
produce accurate discharge estimations in 10 out of
17 sites. The estimation of the manning coefficient
was based on percentile of particles (d
90
, d
84
and d
50
)
62
Villca, A., Sammuneh, M., Adrien, P., Jeong, J., El Meouche, R. and Chapalain, G.
UAV-Based Analysis of Armour Rock Granulometr y and Hydraulic Stability.
DOI: 10.5220/0012703700003696
Paper published under CC license (CC BY-NC-ND 4.0)
In Proceedings of the 10th Inter national Conference on Geographical Information Systems Theory, Applications and Management (GISTAM 2024), pages 62-70
ISBN: 978-989-758-694-1; ISSN: 2184-500X
Proceedings Copyright © 2024 by SCITEPRESS – Science and Technology Publications, Lda.
derived from optical granulometric curves. Optical
granulometry was applied to riverbeds in Japan, the
accuracy of the optical method was compared to
field measurements showing great coincidence
except for the finer grains where the resolution of
the image plays a key role (Kadota et al., s. d.).
The aim of this study is to combine these two
technologies: UAV photogrammetry and digital
optical granulometry to carry out the monitoring of
an earthen dike’s armour rocks and establish the
procedure for the treatment of UAV imagery to
execute the granulometry analysis and ultimately
evaluate the hydraulic stability of the armour rock
layers. In section 2 we will see the study-site.
Section 3 is divided into three main sections UAV
photogrammetry, optical granulometry and hydraulic
stability analysis. In section 4 the results are
discussed and finally in section 5 conclusions are
drawn.
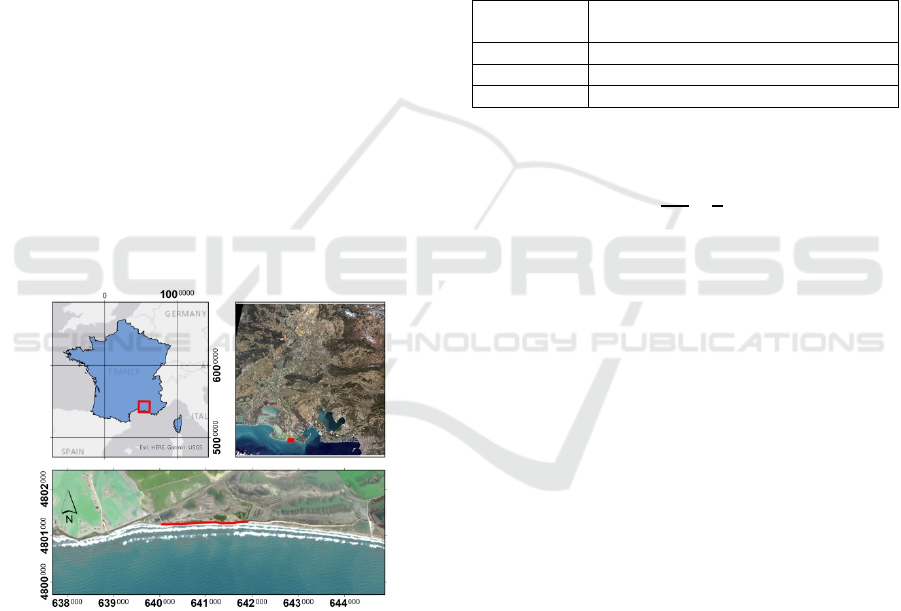
2 CASE STUDY
Located in the south of France, Camargue is a low-
lying region, exposed to multiple storms, see figure
1. It is among the most endangered zones by rise in
sea level (Pörtner & Roberts, s. d.).
Figure 1: Location of study area in south of France. In the
top-left view France is highlighted. The red area
represents sentinel 2 tile 31TFJ projected on the UTM –
zone 31N (Universal Transverse Mercator). The top-right
view shows the tiled sentinel-2 image (date: 28 February
2023) and the red box highlights the zoomed area of the
bottom view. The dike “Quenin” length is shown in red.
The two-kilometer long earthen dike is located to
the west of the Pharaman lighthouse. During storm
surges it has to protect the salt marshes from
inundation.
3 MATERIALS AND METHODS
3.1 UAV Photogrammetry
3.1.1 Drone Specifications
In this study a DJI Phantom 4 Advanced was
deployed with a 1-inch 20-megapixel CMOS sensor.
The maximum flight time being 30 minutes limited
the survey area, thus the total area was divided into
three survey zones. The mission took place on 12
April. Table 1 summarizes the principal
characteristic of the sensor.
Table 1: Sensor specifications.
Sensor 1” CMOS, Pixels: 20M, Size:
12.83mmx8.55mm
Lens FOV 84° 8.8 mm/24 m
m
Ima
g
e size 3:2 As
p
ect Ratio: 5472 × 3648
Filet
yp
eJPEG
Ground sampling distance (GSD) can be
approximated by the following formula:
GSD =
×
(1
)
Where 𝑆
and 𝐼𝑀
is the sensor and image
width respectively. The aircraft height is 𝐻 and 𝑓 is
the camera focal length. In our case, GSD is
approximately 31.1mm for a 120m flight height. The
selected GSD should allow detection of the armour
rocks with mean D
50
values from 250 to 850mm.
Following a rule of thumb so that every grain is
represented by a minimum number of pixels b>10px
(Detert & Weitbrecht, 2012) we note that the for the
lower D
50
value the number of pixels is lower than
10px, but for the larger diameter the condition is
met.
3.1.2 Flight Planification
During the data acquisition phase, Figure 2 two
drone surveys were done for the April mission. The
first survey took nadir images at 70% overlap along
the dike (149). The second mission took nadir
images with 30% overlap in an area 900m from the
coast to estimate shallow bathymetry (238).
It is necessary to verify in situ if the required
overlap is achieved. The wind may affect the drone
speed and reduce the number of overlapped images
in certain zones. To overcome this inconvenience a
combination of the images from both missions was
used. From the overlap map, it can be seen that an
offset distance from the flight area and study area
UAV-Based Analysis of Armour Rock Granulometry and Hydraulic Stability
63
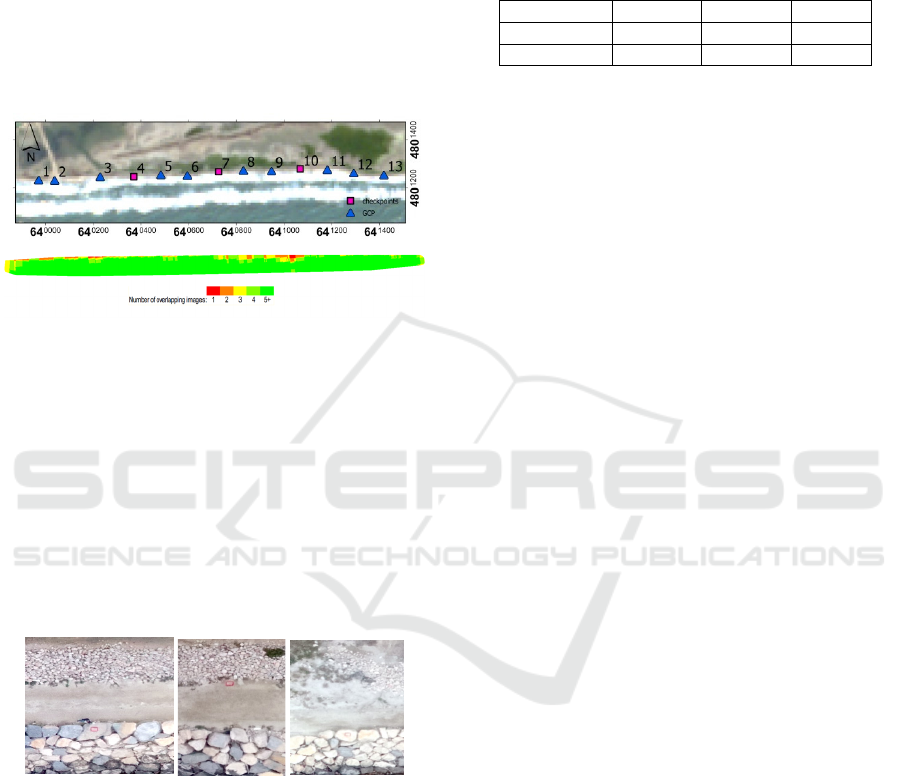
must be foreseen to ensure more than five
overlapped images in the study area.
3.1.3 Ground Control Points
Ground Control Points (GCP’s) and Checkpoints
(CP’s) were marked with a red spray following a
zigzag pattern on the dike crest see figure 3
coordinate measurement were made on the same day
with a GNSS multiband antenna IP 67 and a ZED-
F9P RTK receiver, in total 13 points were measured.
Figure 2: a) GCP’s and CP’s distribution along the dike,
b) Combined missions overlap map.
The centipede GNSS network, an open source
collaborative network of more than 300 homemade
RTK bases across France, was used. It allowed us to
benefit from RTK centimetre positioning for free (Le
Reseau Centipede RTK, s. d.). The smartphone SW
maps application was used to collect, store and
visualize the coordinates (SW Maps - Mobile GIS,
s. d.). The consistency and reliability of this
equipment, software and network has been validated
in previous studies. (Sammuneh et al., 2023)
Figure 3: GCP’s following a zigzag pattern on the crest of
the dike.
3.1.4 Photogrammetric Processing
The data processing is done using Pix4D (version
4.5.6), were all GCP’s and CP’s targets were
manually marked at their centers to ensure accurate
geo-referencing. For accuracy assessment, Root
Mean Square Error (RMSE) is used, see table 2, for
a combination of both surveys with 178 images with
70% and 30% overlap. Previous studies have
evaluated the level of accuracy that can be achieved
with UAV equipment (El Meouche et al., 2016)
(Jiménez-Jiménez & Ojeda-Bustamante, 2021). Just
the same vertical error in our case (Z) is significantly
larger than planar error (X, Y).
Table 2: Results of the photogrammetric block adjustment.
Survey April 2023.
RMSE X(m) Y(m) Z(m)
GCP’s 0.005 0.011 0.017
CP’s 0.070 0.030 0.347
The workflow diagram in figure 4 shows the
different steps from data acquisition, data processing
and data analysis. The pix4D software proposes a
photogrammetric technique based on structure from
motion algorithm based on three stages. First, the
position of the images is extracted from the EXIF
metadata and specific features called key-points are
found on every image in order to find matching
points in overlapped images. This makes it possible
to know the camera position and orientation to carry
out an internal and external camera calibration
during the bundle block adjustment. Then automatic
tie points are detected in the image to compute its
3D position and point cloud densification allows
more tie points to be created. Finally, the products
obtained include the digital surface models, ortho-
image and reflectance maps.
Rematch and optimize was used to compute
more matching points between images and therefore
more automatic tie points through re-optimization of
internal and external camera parameters. The
internal camera parameters from the EXIF metadata
are focal length, two principal point offsets (𝑥,𝑦),
three radial (𝑅
,𝑅
,𝑅
) and two tangential (𝑇
,𝑇
)
distortion coefficients. The external camera
parameters are defined by the position of the camera
projection center (𝑇
,𝑇
,𝑇
) and the rotation matrix
defined by the camera orientation
( 𝑅
(
𝜔
)
,𝑅
(𝜙),𝑅
(𝜅) ). (Professional
Photogrammetry and Drone Mapping Software, s.
d.)
3.2 Digital Optical Granulometry
Digital optical granulometry is a non-invasive
technique based on the analysis of digital images
after a scaling factor is applied. In this study the
Basegrain software is used to carry out the
granulometry analysis (Detert & Weitbrecht, 2012).
Areas of interests were chosen along the dike’s
longitudinal axis every 100m approximately. At the
same time 3 zones of interest were defined along the
transversal axis of the dike, see figure 5. Zone A is
the area in the inner slope with small granular
a
)
b)
GISTAM 2024 - 10th International Conference on Geographical Information Systems Theory, Applications and Management
64
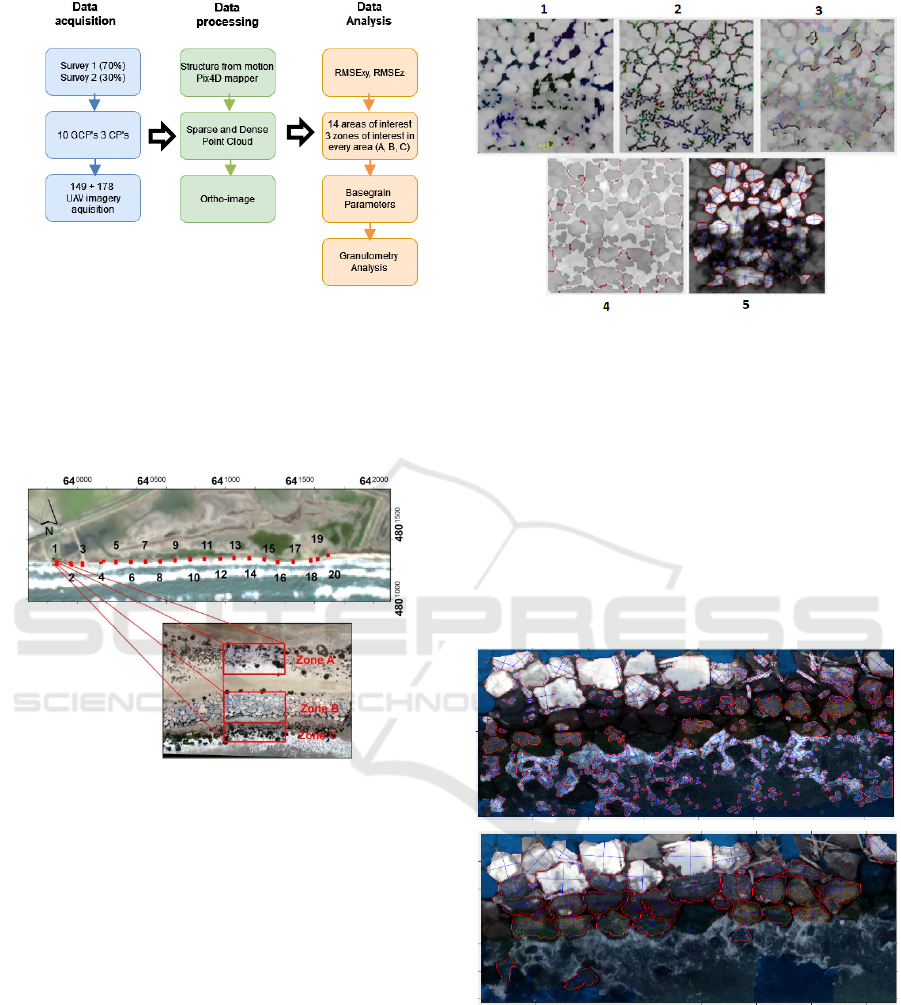
Figure 4: Workflow of photogrammetric and optical
granulometry analysis processing.
material compared to the armour rocks. Zone B is
the outer slope closest to the crest-dike. Finally, the
C zone has armour rocks, covered with moss, in the
wave impact area.
Figure 5: 20 Areas of interest along the dike and three
zones of interest, zone A (inner slope), zone B (outer slope
near the crest), zone C (outer slope near the wave impact
zone). Universal Transverse Mercator, Zone 31N
coordinates.
3.2.1 Basegrain Software
Basegrain has multiple steps to obtain the
granulometric curves, see figure 6, first a procedure
to detect the interstices between grains by double
grayscale threshold (1), to determine further
interstices a morphological bottom hat transform is
applied (2). Then the canny and sobel method is
used to find grain edges (3) then the separation of
single grains is made by watershed transform (4).
Next, grain areas are measured and replaced with
ellipsis of the same normalized second central
moments (5). Finally, the analysis of results follows
the Fehr’s approach. (Detert & Weitbrecht, 2012)
Figure 6: The result of the different Basegrain steps (1 to
5) for zone of interest A9.
3.2.2 Basegrain Parameters
In this study for zones A and B the default
parameters were sufficient to detect a great majority
of the armour rocks, however for zones C some
changes had to be made as these armour rocks were
covered with moss and the automatic detection with
default parameters worked poorly as seen in figure
7. This is because in locations with partly wetted
stones the detection algorithm separates the armour
rocks in various parts.
.
Figure 7: Automatic armour rock size automatic detection
after steps 1 to 5 for zone C9, a) Automatic grain detection
with default parameters, b) with modified parameters.
The modified parameters include for step (1) the
blocSizG (block size gray threshold) and the
facgraythr1 (factor gray threshold 1). The first is
the size of the block in which Otsu’s thresh value is
determined and was modified from 32 to 4. The
second is the multiplier that determines definite
a)
b
)
UAV-Based Analysis of Armour Rock Granulometry and Hydraulic Stability
65
interstices; it was changed from 0.8 to 0.5. For step
(2) the puxCutoff (bottom-hat interstices) was
modified from 1 to 8. At least 5 minutes manual
splitting, merging or removal was necessary for all
images.
Once the granulometry curves have been
obtained the median sieve size D
50
, can be calculated
for every area of interest in zone C. The median
sieve size D
50
and the median nominal diameter D
n50
are proportional, 𝐷
= 0.84𝐷 experimentally
determined for different rock types and grading.
The median mass M
50
and median size sieve D
50
are
related using the conversion factor F
S
= 0.60 (Rock
Manual 2007)
M
50
= 𝜌 ×0.6 𝐷
(2)
3.3 Stability Criteria for Armour Units
After various model tests with two-diameter thick
layer of armour rocks a formula was developed by
(Van der Meer 1998) to assess the stability of rock
protection under wave attack. Because 𝜉
<𝜉
we will use the formulae for plunging waves (5)
𝜉
=
6.2𝑃
.
√
tan ∝
.
(3)
𝜉
=𝑡𝑎𝑛𝛼/(
))
.
.
(4)
=6.2 𝑃
.
.
𝜉
.
(5)
For the breaker parameter 𝜉
, 𝛼 is the dike slope
angle, 𝑇
is the mean period and 𝑔 is the
gravitational constant. Where𝐻
, is the significant
wave height at the toe of the structure, Δ =
𝜌
/ 𝜌
− 1 is the dimensionless relative buoyant
density of the armour rocks. Where 𝜌
and 𝜌
are
the densities of rock and seawater Δ is around 1.58
for granite in seawater.
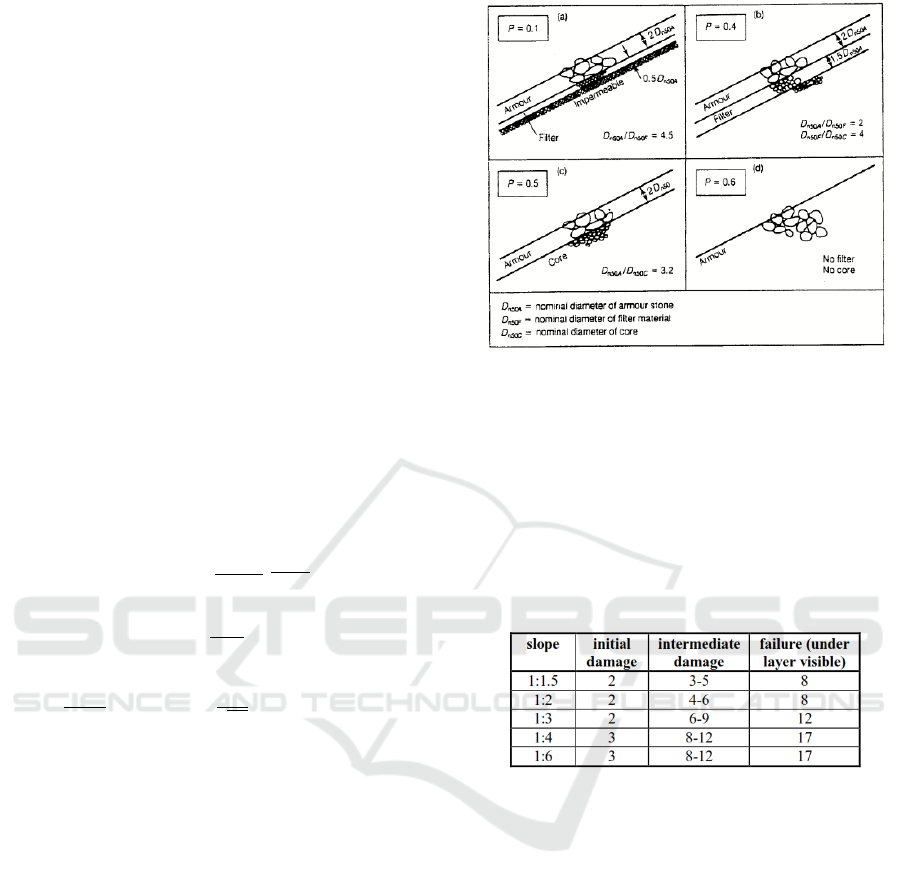
𝑃, is the notional permeability factor, 𝑆
the
damage level, 𝑁
the wave number and 𝜉
called
the breaker parameter. P represents the influence of
the permeability of the structure on the stability of
the armour layer, in this case we will assume P =
0.5. This means the armour rock layer has a
thickness of at least 2𝐷
on top of the core
material (see figure 8). The number of waves 𝑁
depends on the storm duration, in our case 6 hours.
Figure 8: Notional permeability factor for various
structures. (Van Der Meer, 1988).
The damage level 𝑆
depends on the slope angle
(see figure 9) of the structure and takes into account
settlement and displacement a physical description
would be the number of cubic stones with side 𝐷
eroded within a 𝐷
−wide strip of the structure.
(Van Der Meer, 1988). The slope angle in our case
is between 20° and 50°, a slope of 1:1.5 is the
closest value corresponding to a 34° slope angle.
Figure 9: Limits of Sd for a two-diameter thick armour
layer. (Van Der Meer, 1988).
For the local significant wave height at toe of the
structure 𝐻
we will use the results of a previous
study where one dimensional waves were
propagated from deep water taking into account the
actual bathymetry with Tomawac. A set of
simulations were run with varying boundary
significant wave height 𝐻
= 3m, 5m, and 8m,
initial mean water level η = 0.2m, 0.4m, 0.5m, 0.8m,
1.1m, 1.5m and frequencies 𝑓 = 0.187 Hz, 0.147 Hz,
0.117 Hz. (Paul et al., 2020)
GISTAM 2024 - 10th International Conference on Geographical Information Systems Theory, Applications and Management
66
4 RESULTS AND DISCUSSION
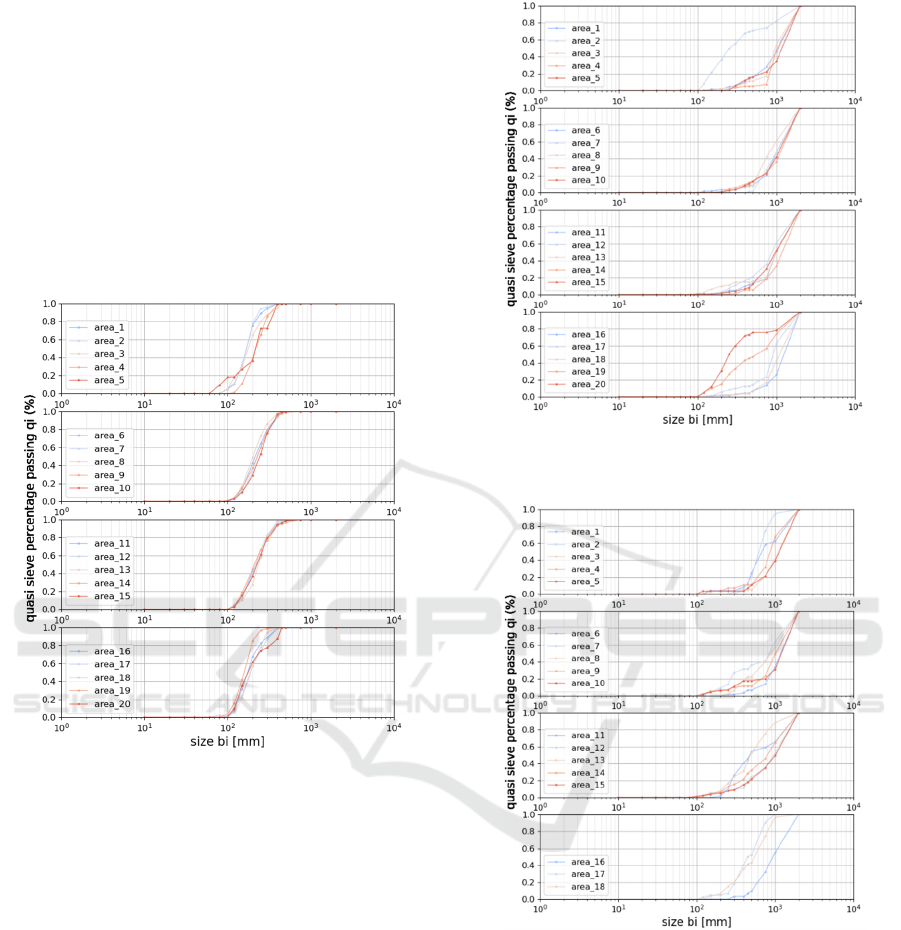
4.1 Granulometry Results
The final graph analysis chosen to represent the
results were the quasi-sieve throughput (qi[-]), based
on the top view b axis by number on a logarithmic
scale. The Basegrain derived grain distribution for
the different zones of interest are shown in figures
10, 11 and 12. For zone A, the inner slope area, the
regularity of the grain size distribution is evident
along the dike.
Figure 10: Granulometric curves for zone A, located in the
inner slope of the dike.
For zone B, the outer slope zone near the crest,
there is a strong dominance of coarser material, at
the end and the beginning however, the finer grains
percentage increases. Finally, for zone C, the outer
slope near the wave impact area, there is dominance
of coarser material along the dike except for some
areas in the middle 1, 2, 4, 7, 8, 11 and 13.
For zone C, granulometry is very heterogeneous
already some areas of interest stand out at the
beginning and end of the dike, areas of interest
number 4, 7, 11 and 13 are notable for its low
median diameter value 𝐷
and percentiles values in
general. The areas of interest stop at 18 because in
this location the wave impact area has no armour
rocks but sand.
Figure 11: Granulometric curves for zone B, located in the
outer slope of the dike near the crest.
Figure 12: Granulometric curves for zone C, located in the
outer slope of the dike near the wave impact area.
In figure 13 the estimated diameters of the coarse
fraction grain percentiles
D
10
, D
15
, D
20
, D
50
, D
65
, D
70
,
D
80
, D
85
, and D
97
and indicate the armour rock size for
a particular percent finer value. For zone A, the
homogeneity of detected granulometry is again
confirmed while for zone B this homogeneity is
present only in the central part of the dike both the
beginning and end show much greater quantities of
fine material.
UAV-Based Analysis of Armour Rock Granulometry and Hydraulic Stability
67
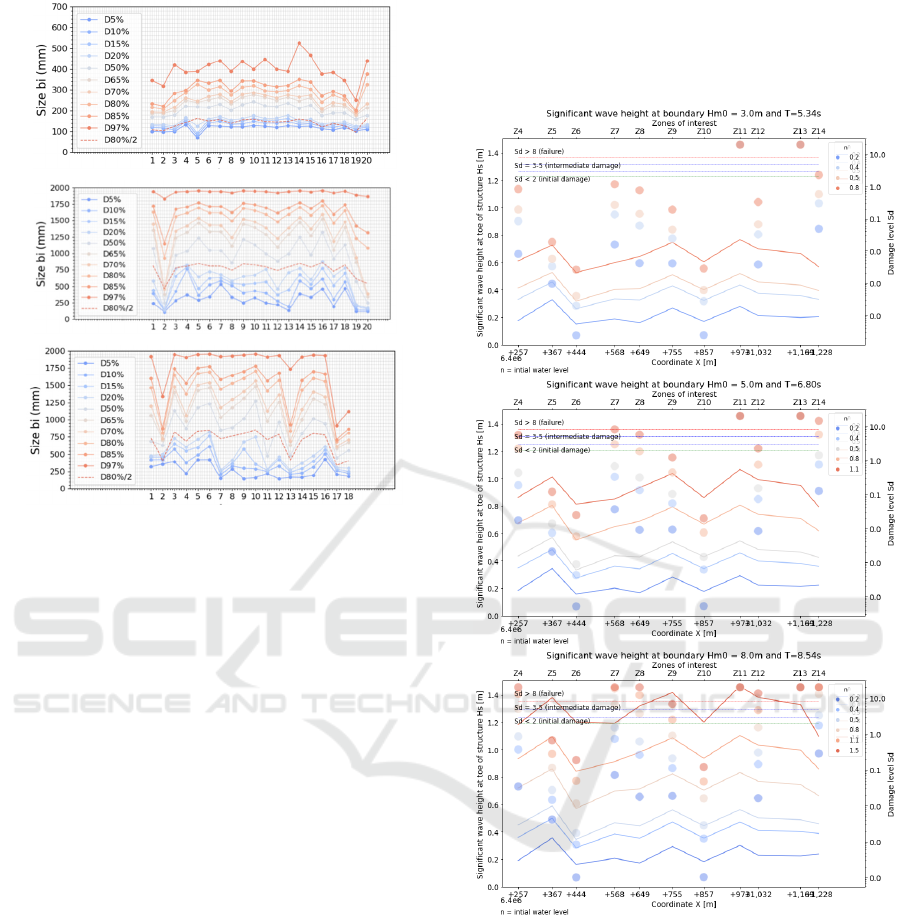
Figure 13: Grain size percentiles values D
10
, D
15
, D
20
, D
50
,
D
65
, D
70
, D
80
, D
85
, and D
97
, estimated using Basegrain for
zones A, B and C versus the areas of interest in the x axis.
A limitation of optical granulometry technique in
our case for zone A is that spatial resolution is not
sufficient to represent every grain main axis b with
at least 10 pixels. For zones B and C this condition
is met. Another limitation is that wetted or moss-
covered rocks will require the tuning of Basegrain
parameters as we did and some manual editing.
However, a huge advantage is that both spatial and
temporal monitoring of granulometry can be done
with relatively low cost and time.
4.2 Hydraulic Stability Results
To study the stability of the armour rock layer in
zone C the significant wave height for the following
areas is available 4, 5, 6, 7, 8, 10, 11, 12, 13 and 14
from a previous study. The hydraulic stability results
are shown in figure 14.
The significant wave heights at the toe of the
dike 𝐻
depend on the boundary wave height 𝐻
initial mean water level 𝜂 and position along the
dike (areas). From figure 14a) where 𝐻
=
3𝑚,𝑇 = 5.34𝑠 damage levels for all areas are below
initial damage limit except for areas 11 and 13 for
all initial still water levels 𝜂 = 0.2−0.8𝑚. Let’s
remember that areas 4, 7, 11 and 13 have low
median diameter values. As boundary wave heights
increases in figure 14b) 𝐻
= 5𝑚,𝑇 = 6.80𝑠
other areas such as 4, 7, 8 and 14 now surpass the
initial damage limit value (𝑆
<2) for initial still
water levels 𝜂 = 0.8 − 1.1𝑚. But only areas 11, 13
and 14 go beyond failure damage level (𝑆
8).
Figure 14: Significant wave height at toe of the dike 𝐻
(left vertical axis), damage levels 𝑆
along the dike (right
vertical axis), for areas of interest 4, 5, 6, 7, 8, 9, 10, 11,
12, 13 and 14 (upper horizontal axis) for varying initial
still water levels 𝜂 (see legend). The coordinate of the area
of study (UTM Zone 31N) are in the lower horizontal axis.
Finally in figure 14c) where significant wave height
at boundary increases to 𝐻
= 8𝑚,𝑇 = 8.54𝑠 the
areas going beyond failure damage level are adding
up 4, 7, 8 and 12 for high initial still water levels
between 𝜂 = 0.8 − 1.1𝑚 . The areas remaining
under initial damage level under all circumstances
are 5, 6 and 10. Notably area 14 reaches
a)
b
)
c)
GISTAM 2024 - 10th International Conference on Geographical Information Systems Theory, Applications and Management
68

intermediate damage levels for low 𝜂 = 0.4 − 0.5𝑚
values. Damage levels exceeding failure levels
reaching 15-20 values mean an S shaped profile is
developing this is the case of areas 11 and 13
for 𝐻
=3−5𝑚. The number of areas increases
to 6 (areas 4, 7, 8, 11, 13 and 14) when 𝐻
=8𝑚.
5 CONCLUSIONS AND WAY
FORWARD
This study presents a non-invasive technique of
granulometric analysis based on UAV-based
photogrammetry and optical digital granulometry in
order to evaluate the stability of its armour rock
layer on the wave impact zone. This technique is
tested on an earthen dike located in the south of
France were monitoring of an earthen dike exposed
to storms is necessary.
Measurements were obtained in April 2023, the
images were processed in pix4D to obtain a
georeferenced ortho-image then the Basegrain tool is
used to analyse armour rock size properties in 20
areas of interest along the dike, for three zones of
interest A (inner slope), B (outer slope near the
crest) and C (outer slope in the wave impact zone).
The adjustment of some software parameters
allowed automated detection of armour rocks
covered with moss.
Once the grain size distribution is obtained the
spatial variation along the dike was evaluated. The
median sieve size by a conversion factor let us
approximate the median nominal diameter to
evaluate the stability of the armour rock layer for
different sea-states.
The short time application and flexibility of the
UAV and optical granulometry, in comparison with
traditional methods, makes this approach an
effective tool for approximation of granulometry and
stability of armour rocks. The ability of multiple
data collection offers the potential of spatial and
temporal monitoring of the dike.
Several assumptions were made to apply the van
der Meer formulas, parameters like, notional
permeability factor, Number of waves, storm
duration, and dike slope. Looking ahead, this study
aims examining the variability of the different
parameters assumed to be constant along the dike.
REFERENCES
Andreadakis, E., Diakakis, M., Vassilakis, E.,
Deligiannakis, G., Antoniadis, A., Andriopoulos, P.,
Spyrou, N. I., & Nikolopoulos, E. I. (2020).
Unmanned Aerial Systems-Aided Post-Flood Peak
Discharge Estimation in Ephemeral Streams.
Buscombe, D. (s. d.). SediNet : A configurable deep
learning model for mixed qualitative and quantitative
optical granulometry.
Detert, M., & Weitbrecht, V. (s. d.). Determining image-
based grain size distribution with suboptimal
conditioned photos.
Detert, M., & Weitbrecht, V. (2012). Automatic object
detection to analyze the geometry of gravel grains – a
free stand-alone tool.
Fehr, R. (1987). Einfache Bestimmung der
Korngrössenverteilung von Geschiebematerial mit
Hilfe der Linienzahlanalyse. Schweizer Ingenieur und
Architekt, 105(38), 1104‑1109. https://doi.org/10.5169
/seals-76710
Graham, D. J., Rice, S. P., & Reid, I. (s. d.). A transferable
method for the automated grain sizing of river gravels.
Jiménez-Jiménez, S. I., & Ojeda-Bustamante, W. (2021).
Digital Terrain Models Generated with Low-Cost
UAV Photogrammetry : Methodology and Accuracy.
Kadota, A., Asayama, C., & Ndwambi, I. D. (s. d.). Image
analysis of grain size distribution around area of sand
deposition.
Lagogiannis, S., & Dimitriou, E. (2021). Discharge
Estimation with the Use of Unmanned Aerial Vehicles
(UAVs) and Hydraulic Methods in Shallow Rivers.
Le Reseau Centipede RTK. (s. d.). Centipede RTK.
Consulté 17 mai 2023, à l’adresse https://
docs.centipede.fr/
El Meouche, R. E., Hijazi, I., Poncet, P., Abunemeh, M.,
& Rezoug, M. (2016). UAV PHOTOGRAMMETRY
IMPLEMENTATION TO ENHANCE LAND
SURVEYING, COMPARISONS AND POSSIBILITIES.
Paul, T., Lutringer, C., Poupardin, A., Bennabi, A., Jeong,
J., & Sergent, P. (2020). Wave overtopping and
overflow hazards : Application on the Camargue sea-
dike.
Pörtner, H.-O., & Roberts, D. C. (s. d.). Climate Change
2022 : Impacts, Adaptation and Vulnerability.
Professional photogrammetry and drone mapping
software. (s. d.). Pix4D. Consulté 17 mai 2023, à
l’adresse https://www.pix4d.com/
Sammuneh, M. A., El Meouche, R., Eslahi, M., &
Farazdaghi, E. (2023). Low-Cost Global Navigation
Satellite System (Low-Cost GNSS) for Mobile
Geographic Information System (GIS). In M. Ben
Ahmed, A. A. Boudhir, D. Santos, R. Dionisio, & N.
Benaya (Éds.), Innovations in Smart Cities
Applications Volume 6 (p. 105‑117). Springer
International Publishing. https://doi.org/10.1007/978-
3-031-26852-6_10
SW Maps—Mobile GIS
. (s. d.). Consulté 1 février 2024, à
l’adresse http://swmaps.softwel.com.np/
UAV-Based Analysis of Armour Rock Granulometry and Hydraulic Stability
69

Van Der Meer, J. W. (1988). Deterministic and
Probabilistic Design of Breakwater Armor Layers.
Journal of Waterway, Port, Coastal, and Ocean
Engineering, 114(1), 66‑80. https://doi.org/10.1061/
(ASCE)0733-950X(1988)114:1(66)
Wolman, M. G. (1954). A method of sampling coarse
river-bed material. Eos, Transactions American
Geophysical Union, 35(6), 951‑956. https://doi.org/
10.1029/TR035i006p00951
GISTAM 2024 - 10th International Conference on Geographical Information Systems Theory, Applications and Management
70
