
Afpatoo: Tool to Automate Function Point Analysis Based on UML Class
and Sequence Diagrams
Agnieszka Malanowska
a
and Jarosław Zabuski
Warsaw University of Technology, Institute of Computer Science, Nowowiejska 15/19, Warsaw, Poland
Keywords:
Function Point Analysis, FPA, UML, Class Diagram, Sequence Diagram, Combined Fragments, Modelio.
Abstract:
Function Point Analysis (FPA) is a well-established and widely used measure of software functional size. For
more than 20 years, there have been several attempts to calculate function points on the basis of the object-
oriented specifications, mainly in the form of UML models, but fully automatic tools dedicated to that process
are still missing. To fill this gap, we propose Afpatoo, a tool which performs IFPUG version of FPA on
the basis of UML class and sequence diagrams with combined fragments. The tool implements two existing
approaches from the literature in a plugin to Modelio, a broadly used open source UML modeling environment.
Usefulness of the Afpatoo was tested and confirmed on the exemplary model for payback payments.
1 INTRODUCTION
Functional size measurement is an important task in
software development. One of the well-established
methods for such calculations is Function Point Anal-
ysis (FPA), proposed originally by (Albrecht, 1979).
It has evolved into various variants, e.g. IFPUG (ISO,
2009), COSMIC (ISO, 2011), NESMA (ISO, 2018).
Among them, the version defined by IFPUG (IFPUG,
2024) is the most widely used.
Although the original FPA was not suited for
object-oriented specifications, there have been sev-
eral attempts to adopt the method to such kind of in-
put, usually in the form of the UML (Unified Mod-
eling Language) (OMG, 2017) diagrams. Unfortu-
nately, despite over 20 years of trials, there is a lack
of completely automatic tools performing FPA on the
basis of the UML diagrams. Such a tool could facil-
itate software measurement process and be beneficial
for the practitioners. Its exemplary use cases include
passing the obtained FPA results as an input to an-
other algorithm. On the other hand, the need for the
FPA for the already existing or historical project may
arise, e.g. during the maintenance of legacy systems.
In such a case, the tool could be used to perform FPA
on the basis of the models obtained using reverse en-
gineering methods. Although some researchers argue
that the FPA cannot be fully automated (Iorio, 2004;
Harput et al., 2005), as it needs a human interpretation
a
https://orcid.org/0000-0001-8876-9647
of the input, we believe that when it comes to the esti-
mation, the easier to perform calculations, the better,
and the FPA specialist may be not always available.
However, our aim is not to replace manual analyses
performed by experts, which are the most accurate,
but to facilitate analyses for those cases, in which it is
difficult to obtain the results from the analyst.
To fill in the gap in the market of fully automated
software for FPA based on UML model, we have im-
plemented the tool named Afpatoo, described in an
unpublished thesis (Zabuski, 2022), which we present
here. It implements the approach proposed by Ue-
mura et al. (Uemura et al., 1999; Uemura et al.,
2001) and the improvements defined by Bluemke
and Malanowska (Bluemke and Malanowska, 2020b;
Malanowska, 2019), as well as introduces some ad-
ditional refinements. Afpatoo is a plugin to Mode-
lio (Modeliosoft, 2022), a popular open source UML
modeling environment. Input data of our tool consist
of class and sequence diagrams which completely de-
scribe the analyzed system, and the output is the num-
ber of Unadjusted Function Points (UFPs), as well
as identified Data Functions (DFs) and Transactional
Functions (TFs).
The rest of the paper is organized as follows. In
Section 2, we recall existing approaches to FPA based
on object-oriented specifications. Then, we explain
implemented algorithms in Section 3. The details
about the architecture of the Afpatoo are described in
Section 4 and its evaluation is provided in Section 5.
Finally, Section 6 concludes our paper.
Malanowska, A. and Zabuski, J.
Afpatoo: Tool to Automate Function Point Analysis Based on UML Class and Sequence Diagrams.
DOI: 10.5220/0012704300003687
Paper published under CC license (CC BY-NC-ND 4.0)
In Proceedings of the 19th International Conference on Evaluation of Novel Approaches to Software Engineering (ENASE 2024), pages 625-632
ISBN: 978-989-758-696-5; ISSN: 2184-4895
Proceedings Copyright © 2024 by SCITEPRESS – Science and Technology Publications, Lda.
625

2 RELATED WORK
There have been several attempts to establish a map-
ping between the object-oriented specifications and
the function points (FPs). Usually, UML diagrams
are transformed to the terms related to IFPUG ver-
sion of FPA. Unfortunately, it seems to be impossible
to find tools which perform such an analysis in a com-
pletely automatic way. Although some tools allowing
for automatization of FPA can be found, e.g. (Func-
tion point Modeler Inc., 2009; ScopeMaster., 2023),
they are not based on the object-oriented specifica-
tion, but on some other type of input, e.g. textual re-
quirements specification in natural language.
One of the earliest approaches to transformation
of object-oriented requirements specification into the
IFPUG FPs was performed by (Fetcke et al., 1997).
The input consists of use case, domain object, and
analysis models from Object-Oriented Software En-
gineering (Jacobson et al., 1992) methodology, a pre-
decessor of the UML. The mapping rules presented
by the authors cannot be fully automated, as at some
points they refer to descriptions from textual docu-
mentation or decisions of an FPA expert. Clear trans-
formation rules are provided only to identify candi-
dates of FPA objects, but final selection of actual ob-
jects is left to the user.
Another early approach was made by (Caldiera
et al., 1998). This work introduces Object Oriented
Function Points (OOFP), which cannot be mapped di-
rectly to traditional FPs. OOFPs are calculated on the
basis of the object model, which can be understood
as class diagrams. OOFP counting methodology has
few parametrizable points, in which one of the possi-
ble strategies can be chosen. The authors, however, do
not assume decisions of an FPA expert, but offer the
possibility of adjusting the calculations to the needs
of particular organization. The approach was also im-
plemented in a parametrizable software.
Although those works cannot be used directly to
transform UML diagrams into FPA results, they and
(Uemura et al., 1999; Uemura et al., 2001) (see Sec-
tion 3.1) have made a significant impact on the fur-
ther proposals. (Iorio, 2004) reviewed transforma-
tion rules proposed in (Fetcke et al., 1997; Uemura
et al., 1999; Caldiera et al., 1998) and created guide-
lines to identify candidates on IFPUG FPA entities on
the basis of use case, class, and sequence diagrams.
He claims it is impossible to automatically map UML
to FPA, as they have different objectives and the dia-
grams can be prepared from various perspectives.
Similarly, (Cantone et al., 2004), based on (Fetcke
et al., 1997; Caldiera et al., 1998; Uemura et al.,
2001), proposed a detailed rules to transform use case,
class, and sequence diagrams to UFPs from IFPUG
FPA. They discuss and combine the rules defined by
different techniques and, in the case of conflict, al-
low the user to choose the preferred one. Some new
rules are also defined. The approach is parametrizable
and has been implemented in a semi-automatic tool,
which requires presence of an FPA expert.
(van den Berg et al., 2005) discuss the problem
of specification of Functional User Requirements ex-
pressed in the UML to measure the functional size
of the software. The authors compare NESMA and
COSMIC approaches. Use case diagrams and scenar-
ios, class, and activity diagrams are considered. How-
ever, the paper does not define any mapping between
those diagrams and FPs, the measurement process is
performed manually, and is not clear.
(Harput et al., 2005) propose a semi-automatic
conversion from UML requirements specification into
the IFPUG FPA. UFPs are calculated from use cases
with pre- and postconditions, class diagrams repre-
senting domain or information model, and sequence
diagrams. Moreover, non-functional requirements are
mapped to General System Characteristics used in
FPA, what allows for calculation of Adjusted Func-
tion Points. Although the authors convince that fully
automatic transformation is impossible due to various
possible interpretations of the diagrams, they provide
a semi-automatic tool, which requires an FPA expert.
(Batista et al., 2011) focus on the presentation of
the semi-automatic tool, ReMoFP, which supports the
FPA analyst. The input data are UML requirements
specification in the form of class diagrams and use
case flows modeled on the activity diagrams. Their
approach is based on creation of UML stereotypes
and OCL (Object Constraint Language) (OMG, 2014)
constraints. The aim of the used stereotypes is to fa-
cilitate manual recognition of DFs and TFs.
Finally, (Irawati and Mustofa, 2012) present the
semi-automatic approach and tool for calculation of
IFPUG UFPs and estimation of project effort, dura-
tion, and speed of delivery on the basis of UML de-
sign model. The input consists of use case or class
diagrams, or the diagram describing the relationships
between the classes and use cases. The authors do not
define mapping rules, they only indicate which ele-
ments of each diagram type can serve as a basis for
calculation of the given FPA parameter.
3 ALGORITHMS USED
As can be seen from Section 2, it is impossible to find
any tools which would map object-oriented concepts
into the results of FPA in a completely automatic way.
ENASE 2024 - 19th International Conference on Evaluation of Novel Approaches to Software Engineering
626

Although several proposals exist, they all require the
presence of an expert, who may not be available in all
circumstances. Moreover, although majority of the
aforementioned mappings is suited for UML input,
they seem to be quite outdated. Only (van den Berg
et al., 2005) and (Batista et al., 2011) refer to UML
2.0, the others use its 1.x version.
Our approach differs from those mentioned in
Section 2. We aimed to create fully automatic tool
performing FPA on the basis of the UML model, ad-
justed to the contemporary version of the UML 2.5.1.
Our tool, Afpatoo, takes advantage of one of the
meaningful outdated mappings, but uses also an ap-
proach to update it to the current version of the UML.
Hence, it is based on implementation of two existing
algorithms from the literature: transformation of class
and sequence diagrams into UFPs (Section 3.1) and
its improvements resulting from the introduction of
newer elements in the UML diagrams (Section 3.2).
3.1 FPA Based on UML Diagrams
Uemura et al. (Uemura et al., 1999; Uemura et al.,
2001) proposed a method to conduct first five steps of
the IFPUG FPA. This approach, proposed originally
for UML 1.0, is based on the software design model
consisting of class and sequence diagrams. Unlike all
the solutions recalled in Section 2, it is completely
automatic and has been implemented in a tool at the
time of its introduction over 20 years ago. Therefore,
this algorithm has been chosen for usage in our ap-
proach. In the rest of the paper, the term ’FPA’ refers
to the IFPUG FPA, its details can be found in, e.g.,
(ISO, 2009; Uemura et al., 2001).
(Uemura et al., 1999; Uemura et al., 2001) divide
all objects from the sequence diagrams into two types:
actor and non-actor objects. The former do not belong
to the considered information system, while the latter
are placed inside the system. Another important as-
sumption is that the data exchange is performed in the
form of message with non-empty list of arguments on
the sequence diagrams. DFs are formed from those
non-actor objects for which there are attributes de-
fined on the class diagram and which exchange some
data with other non-actors. If some attributes of the
identified DF are modified by some operation of an-
other object, the given DF is recognized as an Internal
Logical File (ILF). The authors define that an object
has attributes modified in such a way if it is associated
to at least one External Input (EI) TF. On the contrary,
if there is no such modification, the DF is treated as
an External Interface File (EIF). To measure the com-
plexity of the DF, the authors assume that Data El-
ement Type (DET) value is equal to the number of
attributes of the given class and Record Element Type
(RET) is always assigned the value of 1.
TFs are built from the messages (or their se-
quences), started by an actor, which ensure that there
is some data exchange between the objects. Uemura
et al. assumed that all important returns from syn-
chronous calls have to be clearly drawn on the dia-
gram, as this was not obligatory in UML 1.0. They
defined five patterns of messages sequence to recog-
nize the type and complexity of the TFs. Those pat-
terns are explained in detail in (Uemura et al., 1999;
Uemura et al., 2001). In each pattern, some meaning-
ful message is identified and serves as a basis for de-
termination for the type of the TF (EI, External Out-
put - EO, or External Inquiry - EQ, depending on the
pattern). Moreover, the number of the arguments of
the meaningful message is treated as a value of DET
parameter. File Type Referenced (FTR) is the number
of DFs involved in the sequence.
3.2 Usage of Combined Fragments
As the method of Uemura et al. was defined over
20 years ago for UML 1.0, it does not take into ac-
count newer UML elements, such as combined frag-
ments (CFs) and interaction uses, which modify the
meaning of the sequence diagram. Recently, Bluemke
and Malanowska (Bluemke and Malanowska, 2020b;
Malanowska, 2019) proposed a technique to consider
the meaning of CFs in the automatic FPA. It is de-
fined as a pre-processing step before performing the
method of Uemura et al. The general idea is that each
sequence diagram containing CFs should be reduced
to (possibly many) diagrams without the CFs, so that
all interaction scenarios are preserved. Transforma-
tion rules are defined for single CFs and applied it-
eratively and recursively. Later, such simplified dia-
grams can be normally used as an input to the method
of Uemura et al.
(Bluemke and Malanowska, 2020b; Malanowska,
2019) divide all 12 types of UML CFs into three cate-
gories on the basis of the meaning of interaction oper-
ators. The first category contains CFs which are easy
to be reduced, i.e. alt, opt, break, and neg. The dia-
gram with such a CF can be easily replaced with one
or more diagrams, each of which represents differ-
ent scenario and contains everything from the origi-
nal diagram except of the CF and zero or one of the
operands of that CF.
The second category consists of CFs which do not
require any reduction, because they do not provide
any additional information. Ignore, consider, assert,
strict, and critical CFs belong to this group. Here, the
only necessary step is to ignore the existence of the
Afpatoo: Tool to Automate Function Point Analysis Based on UML Class and Sequence Diagrams
627
frame enclosing the CF and to keep its content. The
same approach is used for reduction of the CFs from
the third category (par, seq, and loop), which are cur-
rently unsupported.
4 AFPATOO TOOL
To fill in the gap in the field of automatic tools per-
forming FPA on the basis of the UML model, we have
implemented a tool called Afpatoo (Zabuski, 2022),
which allows for fully automated calculation of UFPs
from the model containing complete class and se-
quence diagrams with CFs. To achieve this, Afpatoo
implements the algorithms described in Section 3 and
proposes several own refinements.
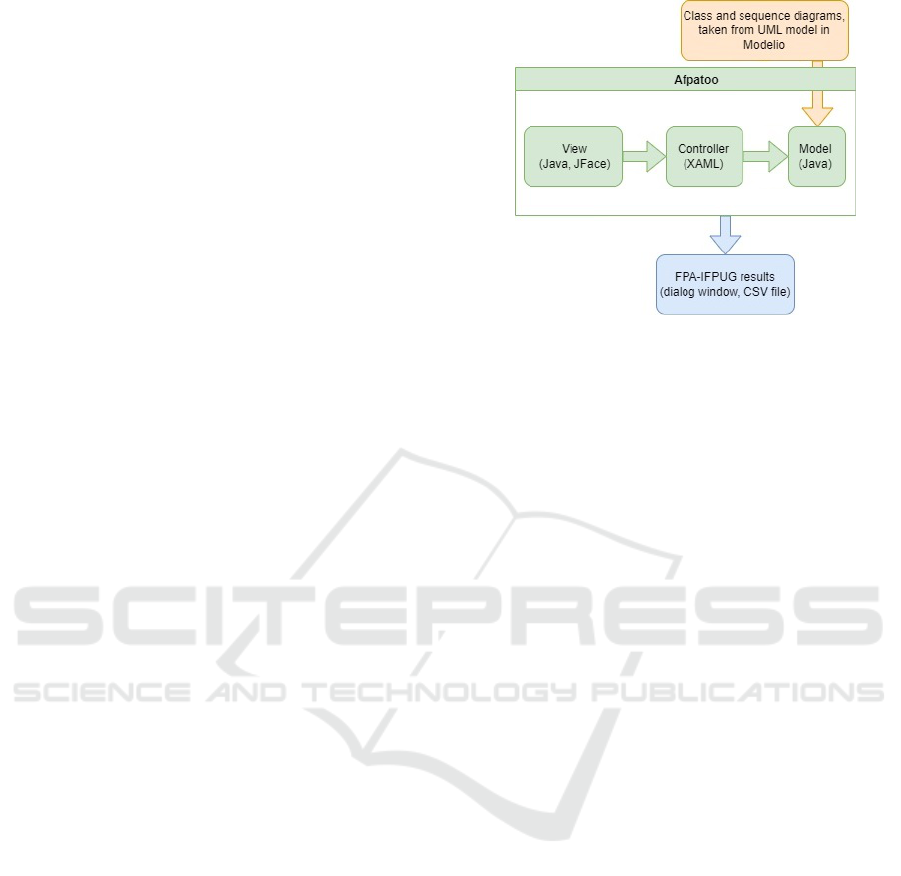
4.1 Architecture
Afpatoo is written in Java, as a plugin to Mode-
lio 5.1.0 (Modeliosoft, 2022) modeling environment,
chosen because of being open source and having quite
a big community of users, who can be potential recip-
ients of the tool.
Our tool is prepared in accordance with the
Model-View-Controller (Eckstein, 2007) design pat-
tern. The Model reads the UML model from Modelio,
converts necessary data from class and sequence dia-
grams to its internal representation and is responsible
for performing the algorithms from Section 3. The
View generates the dialog windows with results of the
automatic FPA in tabular form, warnings, and errors.
Both Model and View consists of Java classes. More-
over, the View uses JFace (Eclipse Foundation, 2020)
to handle GUI. The task of the Controller is to man-
age user data and actions. It is based on the context
menu commands which are used to start the whole
analysis. The Controller is written in XAML (Ex-
tensible Application Markup Language) files, which
are used for generation of context menu options in
Modelio and bind them to proper commands.
As a result, the only input of our plugin is the
UML model prepared in Modelio. The output con-
sists of dialog windows with the results of analysis or
information about errors. Moreover, the results can be
also saved in a CSV file. The overview of the Afpatoo
architecture is presented in Figure 1.
4.2 Input and Output
We had to specify several requirements on the con-
tent of the analyzed diagrams. The whole analyzed
project needs to be stored in one UML package. Af-
Figure 1: General architecture of Afpatoo tool.
patoo operates not only on the elements stored in the
diagrams, but on the whole package.
Regarding elements of the class diagram, we as-
sume that for every actor on the sequence diagram,
there will be corresponding class on the class dia-
gram. Moreover, operations corresponding to the ac-
tions performed by the actor have to be contained in
some class on the class diagrams.
While counting attributes of the class during the
analysis, Afpatoo takes into account not only owned
attributes of the given class, but also navigable as-
sociation ends, attributes of implemented interfaces,
and inherited from direct base classes. As the iden-
tification of all the ancestors of each class could be
time- and resource-consuming due to the limitations
of Modelio API, at this moment, the Afpatoo does not
take into account information about attributes of other
base classes.
Regarding sequence diagrams, the Modelio API
does not offer any way to get information about the
lifelines covered by the CF, which makes it impos-
sible to detect the case in which messages are sent
between the lifelines, some of which are covered by
the CF and some of which are not. To overcome this
problem, we assume that the CF and all messages
contained in it have to be separated from other mes-
sages, so that the row ranges of the diagram covered
by those two types of messages do not overlap.
Similarly to the assumptions of the algorithm de-
scribed in Section 3.1, we expect that all vital re-
turns from synchronous calls are shown on the se-
quence diagrams. Moreover, we assume that only
meaningful replies are drawn. Furthermore, to ensure
proper identification of reply messages by the Afpa-
too, we require that all important returns are described
by <<return>> keyword. This approach allows us to
simply use the algorithm of Uemura et al. without the
need for any other, more complex assumptions.
ENASE 2024 - 19th International Conference on Evaluation of Novel Approaches to Software Engineering
628
To calculate FPs correctly, in every case Afpa-
too needs information about operation invoked by the
given synchronous message and classifier represented
by the given lifeline. Lack of the former informa-
tion would cause that the given message will not be
taken into account in the analyzed sequence of mes-
sages and, therefore, the results of the analysis may be
incomplete. However, this kind of omission does not
prevent Afpatoo from performing the analysis, as we
believe that the tool should be able to work in as many
situations, as possible. In such a case, the UFPs are
calculated, but the user is also warned that the results
of the analysis may be inaccurate.
When there are some lifelines, to which no clas-
sifiers are assigned, the analysis cannot be continued
and the only output of the tool is a dialog window with
explanation of the error. It is caused by the fact that if
we do not know the represented classifier, we have no
information on its type. Particularly, we do not know
whether it is an actor or not.
Nevertheless, in a typical case, when the input di-
agrams contain all the necessary data and fulfill the
requirements specified in this section, the output con-
sist of one modal dialog window with the results of
the analysis. There is also an option to export the re-
sults of the analysis into a CSV file.
It is also worth noting that TFs produced by Af-
patoo may contain duplicates. It is caused by the fact
that the same sequences of messages were present on
several simplified sequence diagrams without CFs de-
scribing various scenarios (see Section 3.2). Although
there may be various points of view on that issue, cur-
rently we decided not to remove information about
such repeated TFs. In fact, the usefulness of them
depends on the purpose for which the FPs are calcu-
lated - if they are used, e.g., as a basis for estimation
of testing effort, like in (Bluemke and Malanowska,
2020a), it may be worth to consider the given TF sev-
eral times, as in each case it will have to be tested with
different test scenario. Moreover, we believe that in
estimation process it is always better to overestimate
the result than to underestimate it.
5 EVALUATION ON EXAMPLE
Afpatoo, as a plugin to Modelio (Modeliosoft, 2022),
is distributed in the JMDAC files. The only required
activity to enable usage of Afpatoo is to add the cor-
responding JMDAC file as a module used in the given
project. Then, the analysis can be started from the
context menu of the UML package containing the
model.
In addition manual and unit tests, we have evalu-
ated usefulness of the Afpatoo on an exemplary sys-
tem for payback payments. Unfortunately, we did not
have access to any industrial UML models or results
of the FPs calculation performed by a human expert,
so we could not evaluate our tool on such kind of data.
5.1 Analyzed System
The exemplary system used for Afpatoo evaluation
represents a simple web application which allows for
buying products and making payments with payback
points. There are two main types of users: customers
and shop staff. The main functionalities of the sys-
tem are searching for products to be bought for the
collected payback points, adding selected products to
the cart, placing an order, and making payments with
the payback points. Moreover, there are options for
the administrator to change user data and status.
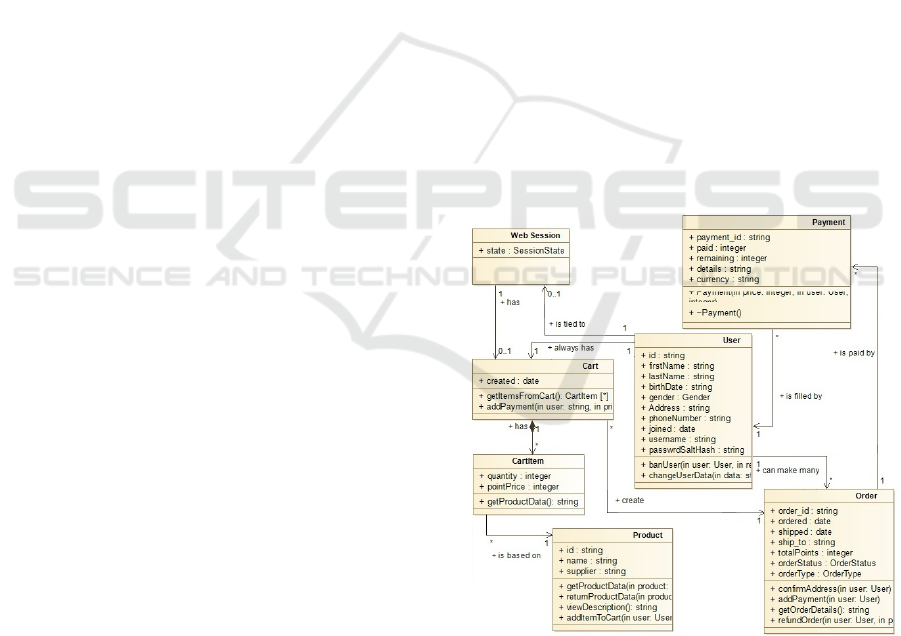
The whole system is described by two class and
three sequence diagrams with various combinations
of CFs. One of the created class diagrams, represent-
ing classes used in ordering products and paying for
them, is shown in Figure 2. An exemplary sequence
diagram, which presents the process of searching for
the product in the shop and adding it to the cart, is
depicted in Figure 3.
Figure 2: Exemplary class diagram.
5.2 Results of Manual FPA
We compared manually calculated results of FPA with
those obtained using Afpatoo. It is worth noting that
both types of analyses were performed on different
bases - manual FPA was performed on the description
Afpatoo: Tool to Automate Function Point Analysis Based on UML Class and Sequence Diagrams
629
Figure 3: Exemplary sequence diagram.
of the functional requirements of the system, while
the automated FPA was conducted on the basis of
UML model of the designed system and the DFs and
TFs were identified using the algorithms from the lit-
erature, not the intuition of the analyst.
Based on the description of functional require-
ments of the exemplary system, 5 DFs and 9 TFs
were identified. As the system manages all the data
on its own and does not exchange data with any exter-
nal system, all recognized DFs were treated as ILFs.
The values of RET (predicted number of records) and
DET (estimated number of fields in the records) pa-
rameters, and the resulting complexities of DFs, are
presented in Table 1.
Table 1: DFs identified in manual FPA.
ID
Name
of DF
Type RET DET
Comp-
lexity
DF1 Users ILF 3 13 Low
DF2 Products ILF 1 3 Low
DF3
Shopping
carts
ILF 3 3 Low
DF4 Orders ILF 3 8 Low
DF5 Payments ILF 1 6 Low
Manual analysis resulted in identification of 6 EIs
and 3 EQs. Details of the recodnized TFs are shown
in Table 2. Similarly as DFs, majority of identified
TFs were recognized as low-complex, including all
detected EQs. However, TF6 was assigned high, and
TF8 - average complexity.
In total, the DFs recognized during manual anal-
ysis are assigned 35 UFPs. TFs present in the exem-
plary system are responsible, in turn, for 31 UFPs.
The whole exemplary system is assigned 66 UFPs.
5.3 Results Obtained Using Afpatoo
Afpatoo identified 7 DFs (2 ILFs and 5 EIFs) and 28
TFs (4 EIs, 24 EOs and 0 EQs) in the model from Sec-
tion 5.1. DFs were assigned 39 UFPs, TFs are respon-
sible for 92 UFPs. Accordingly, calculated functional
size of the whole exemplary system is equal to 131
UFPs. Complexity of all identified DFs and TFs was
evaluated to low. According to (Caldiera et al., 1998;
Cantone et al., 2004), the low complexity of identi-
fied FPA entities is a common observation in different
approaches based on object-oriented specifications.
As mentioned earlier, the results produced by Af-
patoo contain duplicates of identified TFs. After elim-
ination of the repeated operations, there are 11 unique
TFs left, including 2 EIs and 9 EOs. Sum of the UFPs
for them is 42, meaning that in such a case, the total
number of UFPs for the system is equal to 81. The
detailed results after elimination of replicated TFs are
shown in Table 3, which also presents the mapping of
the TFs automatically detected by Afpatoo to the TFs
identified in manual FPA.
5.4 Discussion
The set of identified DFs is quite similar for both
manual analysis and the one performed by the Afpa-
too. Automatic analysis revealed 2 more DFs than the
manual one. Of those two additional DFs, one is re-
lated to CartItem class, which has not been identified
as a separate entity during the manual analysis. The
other corresponds to PaybackPaymentSystem class,
representing the user interface. However, it is worth
noting that the types of the DFs differ between two
methods of calculation. Unlike in the manual anal-
ysis, the automatic FPA treated some of the DFs as
EIFs. The complexity of all DFs is low in both cases.
Regarding TFs, the observations depend on
whether we consider results with or without dupli-
cated operations. In the first case, there is obviously
quite a big difference in the number of obtained TFs.
As mentioned earlier, for some use cases, this ap-
proach may be useful, as it allows to avoid under-
estimations. There are, however, some applications,
which would require precise values of FPs and for
which the duplicates of TFs should be removed before
further calculations. As can be seen in Table 3, once
we consider only unique TFs, the set of identified op-
erations is quite similar to what was discovered dur-
ing manual analysis. There are only two TFs not rec-
ognized before, namely confirmAddressAndPrice
and notifyOnUserDataChangeRequest. The reason
for that is the fact that manual analysis is based on the
initial specification of requirements, while the auto-
matic one is performed on the actual UML model.
Another remarkable differences are the identified
types of TFs. First, manual analysis treated some of
them as EQs, while Afpatoo perceived them as EOs.
ENASE 2024 - 19th International Conference on Evaluation of Novel Approaches to Software Engineering
630

Table 2: TFs identified in manual FPA.
ID Name of TF Type FTR DET Complexity
TF1 Change user data EI 1 8 Low
TF2 Change user status EI 1 1 Low
TF3 Search for products EQ 2 4 Low
TF4 Display product details EQ 1 3 Low
TF5 Add product to cart EI 2 3 Low
TF6 Order products EI 3 12 High
TF7 Cancel order EI 1 8 Low
TF8 Realize payment EI 2 7 Average
TF9 Confirm order realization EQ 1 8 Low
Table 3: TFs identified by Afpatoo after removal of duplicates.
Name of method mapped to TF Type FTR DET Complexity Corresponds to
changeUserEmail EO 2 1 Low TF1
changeUserAccountStatus EO 2 1 Low TF2
searchInventory EO 3 1 Low TF3
viewItemDescriptions EI 1 1 Low TF4
addItemToCart EI 1 1 Low TF5
startCheckoutProcess EO 3 1 Low TF6
confirmAddressAndPrice EO 2 1 Low —
cancelCheckout EO 1 1 Low TF7
realisePayment EO 3 1 Low TF8
getOrderDetails EO 2 1 Low TF9
notifyOnUserDataChangeRequest EO 1 1 Low —
This may be caused by the fact that although the op-
eration does not perform any complicated calculation
(and should not be seen as an EO), the algorithm rules
are unable to detect that difference. Second, some of
TFs were identified as EI in manual analysis, but Af-
patoo treated them as EOs. Again, this difference re-
sults from the used algorithm, as its rules determine
the TF type. The complexities of identified TFs are
quite similar in both cases - however, manual analy-
sis detected two TFs with non-low complexity, on the
contrary to automatic analysis.
As can be seen, although the sets of DFs and
TFs and their complexities determined by Afpatoo are
comparable with those recognized in manual analysis,
there are differences in the types of DFs and TFs, as
well as in the value of their parameters. It may require
further modifications of the original algorithm pro-
posed by (Uemura et al., 1999; Uemura et al., 2001).
Depending on the application of the approach, it may
be also worth considering removal of duplicated TFs.
Some threats to validity of our study can result
from the method and number of conducted experi-
ments. Manual analysis may be biased due to the fact
that it was performed by the authors themselves, as no
FPA experts were available. Moreover, more tests on
bigger and industrial UML models are needed.
6 CONCLUSIONS
Although there have been several attempts to trans-
form UML models into FPs, to the best of our knowl-
edge, there are no tools which support the mapping
in a fully automatic way. Although some researchers
argue that complete automatization of FPA on the ba-
sis of the UML model is impossible due to its vari-
ous interpretations, we believe that even if the results
obtained by a fully automatic tool are not always ac-
curate, they can be used for estimations of the project
size. Such estimations may need to be performed for
various purposes - either to use them in conjunction
with other algorithms or to facilitate maintenance of
legacy systems or create dataset of historical data us-
ing reverse engineering methods.
To fill this gap, we have presented Afpatoo
(Zabuski, 2022), a tool which calculates UFPs on the
basis of class and sequence diagrams. It is based
on two algorithms described in the literature (Ue-
mura et al., 1999; Uemura et al., 2001; Bluemke and
Malanowska, 2020b; Malanowska, 2019) and imple-
mented as a plugin to Modelio (Modeliosoft, 2022).
Selection of the main algorithm is based on the fact
that it is the only identified method allowing for com-
plete automatization of the FPA. Supplementary al-
Afpatoo: Tool to Automate Function Point Analysis Based on UML Class and Sequence Diagrams
631

gorithm used to adjust the main one to the current
UML standard is also chosen. Several modifications
of those original approaches are also presented. Eval-
uation of the tool on the exemplary system shows that
although the results obtained from manual and auto-
matic analysis vary and some amendments may be re-
quired, it allows to detect DFs and TFs and estimate
their complexity correctly.
Although the tool is already promising, there are
several ways to improve it. First, adaptation of the ap-
proach to the rest of newer elements of the sequence
diagrams needs to be defined. Evaluation on the real-
world industrial projects of various sizes, as well as
the comparison of the results with those calculated by
an FPA specialist, would be also a great benefit. Par-
ticularly, verification on the bigger number of com-
mercial projects, including large ones, and decision
about potential modifications of the used algorithms
should be performed in the future.
REFERENCES
Albrecht, A. (1979). Measuring Application Development
Productivity. In Proc. Joint Share, Guide, and IBM
Application Development Symposium, pages 83––92.
Batista, V. A., Peixoto, D. C. C., Borges, E. P., P
´
adua, W.,
Resende, R. F., and P
´
adua, C. I. P. S. (2011). ReMoFP:
A Tool for Counting Function Points from UML Re-
quirement Models. Advances in Soft Eng, 2011. Arti-
cle ID 495232, 7 pages.
Bluemke, I. and Malanowska, A. (2020a). Tool for
Assessment of Testing Effort. In Zamojski, W.,
Mazurkiewicz, J., Sugier, J., Walkowiak, T., and
Kacprzyk, J., editors, Engineering in Dependability
of Computer Systems and Networks, pages 69–79,
Cham. Springer.
Bluemke, I. and Malanowska, A. (2020b). Usage of UML
Combined Fragments in Automatic Function Point
Analysis. In Proc 15th Int Conf ENASE, pages 305–
312. SciTePress.
Caldiera, G., Antoniol, G., Fiutem, R., and Lokan, C.
(1998). Definition and experimental evaluation of
function points for object-oriented systems. In Proc
5th Int Soft Metrics Symposium, pages 167–178.
Cantone, G., Pace, D., and Calavaro, G. (2004). Applying
function point to unified modeling language: conver-
sion model and pilot study. In 10th Int Symposium on
Software Metrics, 2004. Proc, pages 280–291.
Eckstein, R. (2007). Java SE Application Design With
MVC. Access: 1.02.24. https://www.oracle.com/
technical-resources/articles/javase/mvc.html.
Eclipse Foundation (2020). JFace. Access: 1.02.24. https:
//wiki.eclipse.org/JFace.
Fetcke, T., Abran, A., and Nguyen, T.-H. (1997). Mapping
the OO-Jacobson approach into function point analy-
sis. In Proc TOOLS USA 97, pages 192–202.
Function point Modeler Inc. (2009). Func-
tion Point Modeler. Access: 7.03.24.
http://www.functionpointmodeler.com/.
Harput, V., Kaindl, H., and Kramer, S. (2005). Extend-
ing function point analysis to object-oriented require-
ments specifications. In 11th IEEE Int Soft Metrics
Symposium, pages 10 pp.–39.
IFPUG (2024). IFPUG. Access: 1.02.24. https://ifpug.org/.
Iorio, T. (2004). IFPUG Function Point analysis in a UML
framework. In SMEF 2004: Proc.
Irawati, A. R. and Mustofa, K. (2012). Measuring Software
Functionality Using Function Point Method Based On
Design Documentation. Int J of Computer Science Is-
sues, 9(3):124–130.
ISO (2009). ISO/IEC 20926:2009, Software and sys-
tems engineering — Software measurement — IF-
PUG functional size measurement method.
ISO (2011). ISO/IEC 19761:2011, Software engineering —
COSMIC: a functional size measurement method.
ISO (2018). ISO/IEC 24570:2018, Software engineering
— NESMA functional size measurement method —
Definitions and counting guidelines for the application
of function point analysis.
Jacobson, I., Christerson, M., Jonsson, P., and
¨
Overgaard,
G. (1992). Object-Oriented Software Engineering: A
Use Case Driven Approach. Addison-Wesley, USA.
Malanowska, A. (2019). Improving testing effort estimation
method with UML combined fragments and ISO/IEC
25010:2011 software quality model support. MSc the-
sis. Warsaw University of Technology (in Polish).
Modeliosoft (2022). Modelio. Access: 1.02.24. https:
//github.com/ModelioOpenSource/Modelio.
OMG (2014). Object Constraint Language: Version 2.4.
OMG (2017). OMG UML: Version 2.5.1.
ScopeMaster. (2023). Automated Function Points Analysis.
Access: 7.03.24. https://www.scopemaster.com/blog/
automated-function-points/.
Uemura, T., Kusumoto, S., and Inoue, K. (1999). Function
point measurement tool for UML design specification.
In Proc 6th Int Soft Metrics Symposium, pages 62–69.
Uemura, T., Kusumoto, S., and Inoue, K. (2001). Function-
point analysis using design specifications based on the
Unified Modelling Language. J Soft Maintenance and
Evolution: Research and Practice, 13(4):223–243.
van den Berg, K., Dekkers, T., and Oudshoorn, R. (2005).
Functional Size Measurement applied to UML-based
user requirements. In Dekkers, T., editor, Proc
SMEF2005, pages 69–80.
Zabuski, J. M. (2022). Implementation of an automatic
Function Point Analysis method based on class and
sequence diagrams. BSc thesis. Warsaw University of
Technology (in Polish).
ENASE 2024 - 19th International Conference on Evaluation of Novel Approaches to Software Engineering
632
