
Classification and Prediction of Hypoglycemia in Patients with Type 2
Diabetes Mellitus Using Data from the EHR and Patient Context
Luis Claudio Gubert
1,2 a
, Felipe Andr
´
e Zeiser
1 b
, Cristiano Andr
´
e da Costa
1 c
and Rafael Kunst
1 d
1
Software Innovation Laboratory, SOFTWARELAB, Universidade do Vale do Rio dos Sinos, Unisinos, S
˜
ao Leopoldo, Brazil
2
Department of Computer Science, IFRS, Ibirub
´
a, Ibirub
´
a, RS, Brazil
Keywords:
IoT, IoHT, Machine Learning, EHR, Type 2 Diabetes Mellitus.
Abstract:
The increase in obesity, a sedentary lifestyle, and population aging are considered the main factors for the
increase in Type 2 Diabetes Mellitus (T2DM) worldwide. Global estimates indicate that around 400 million
people live with T2DM, reaching 600 million in 2035. This scenario generates a high social and financial
cost for the patient and the healthcare system. In this context, this work evaluates machine learning models to
classify and predict hypoglycemic crises in patients with T2DM. A dataset with data from a clinical center in
southern Brazil is constructed. Patient data involves Electronic Health Records (EHR) and data collected in
the patient context through Internet of Things (IoT). This dataset is used to run classification and prediction
models. Results show that the proposed approach is promising, achieving an AUC of 0.8200 and a sensitivity
of 90.00% for classifying hypoglycemia. In addition, the Clarke Error Grid plot demonstrates an assertiveness
of prediction for high blood glucose in clinical terms. These results demonstrate that the proposed method
achieves comparable or superior results to related works in the literature. The combined use of EHR, IoT, and
Machine Learning can be a promising alternative to improve the monitoring of chronic and long-term diseases,
such as T2DM, contributing to a more accurate and effective diagnosis.
1 INTRODUCTION
Currently, Type 2 Diabetes mellitus (T2DM) stands
out as an important cause of morbidity and mortal-
ity. Global estimates indicate that about 400 mil-
lion people live with T2DM (8.3%) and, if current
trends continue, the number of people with diabetes
is expected to exceed 642 million in 2040 (Guariguata
et al., 2014; Bertoluci et al., 2021). Furthermore, con-
sidering that 50% of people with diabetes do not know
they have the disease (Beagley et al., 2014), it is es-
timated that T2DM could jump from the ninth to the
seventh leading cause of death in the world (Bertoluci
et al., 2021; Ogurtsova et al., 2017). The increase
in the prevalence of obesity, sedentary lifestyle, and
population aging are considered the main factors for
the increase in the incidence of T2DM in the world
(Ogurtsova et al., 2017; Moura et al., 2012). This
scenario generates a high social and financial cost
a
https://orcid.org/0000-0001-7337-5370
b
https://orcid.org/0000-0002-1102-7722
c
https://orcid.org/0000-0003-3859-6199
d
https://orcid.org/0000-0002-6180-4104
for the patient and for the health system in general
(Rosa et al., 2014). The World Health Organization
(WHO), in January 2020, published the document en-
titled Global Strategy for Digital Health 2020-2024,
conceptualizing Digital Health as the field of knowl-
edge and practice associated with developing and us-
ing digital technologies to improve health (WHO,
2020). Digital Health expands the concept of eHealth
to include digital consumers with a broader range of
smart devices and connected equipment. It also cov-
ers other uses of digital health technologies such as
the Internet of Things (IoT), Artificial Intelligence,
Big Data Analytics and robotics. These technologies
can significantly improve health by increasing the
efficiency of medical diagnosis, health-based treat-
ments, evidence, and self-care support, strengthening
health care. In this sense, a model is being designed
to provide patients with knowledge and technologies
to play a more active role in health monitoring. This
health monitoring can be rigorously defined as: “Re-
peated or continuous observations or measurements
of the patient, their physiological function and the
function of life support equipment, in order to guide
management decisions, including when to make ther-
276
Gubert, L., Zeiser, F., André da Costa, C. and Kunst, R.
Classification and Prediction of Hypoglycemia in Patients with Type 2 Diabetes Mellitus Using Data from the EHR and Patient Context.
DOI: 10.5220/0012705100003705
Paper published under CC license (CC BY-NC-ND 4.0)
In Proceedings of the 9th International Conference on Internet of Things, Big Data and Security (IoTBDS 2024), pages 276-283
ISBN: 978-989-758-699-6; ISSN: 2184-4976
Proceedings Copyright © 2024 by SCITEPRESS – Science and Technology Publications, Lda.

apeutic interventions and evaluation of these interven-
tions” (Hudson, 1985). This model adopts the prin-
ciples of proactivity, independence, accessibility and
economy. They are using a wide range of mobile tech-
nologies such as smartphones, tablets and wearable
sensors for continuous monitoring of the patient and
patient’s vital signs (Banos et al., 2014; Gao et al.,
2017; Ramazi et al., 2021). The work of (da Costa
et al., 2018) presents the concept of the Internet of
Health Things (IoHT), which proposes to collect vital
signs in a partially or fully automated way to boost
health services. This collect would be using handheld
devices and smartphones and moving from a conven-
tional hub-based health system to more personalized
systems (Pagiatakis et al., 2020). However, trans-
forming advanced IoHT technology into custom sys-
tems is still a significant challenge in the field. Some
issues include the lack of accurate and cost-effective
medical sensors, non-standard IoHT system architec-
tures, heterogeneity of connected wearable devices,
the multidimensionality of the generated data, and
high demand for interoperability (Baloch et al., 2018;
Qi et al., 2017; Pasquier et al., 2018), which are obsta-
cles to its effectiveness. Furthermore, given that the
goal of ubiquitous computing in health is to seek con-
text awareness (Dey et al., 2001; Tavares et al., 2016),
some challenges stand out, as the idea of using con-
textualized health awareness is to provide intelligence
and focus care on the patient (Mshali et al., 2018;
Montori et al., 2018). Therefore, our main contribu-
tions with this article are: (i) evaluate Machine learn-
ing models based on criteria defined in the literature,
using as a dataset data collected in the patient’s EHR
and data collected in their context through the use
of IoT. (ii) evaluate a computational architecture that
supports clinical decision-making, using well-known
clinical criteria for T2DM, such as the Clarke Error
Grid. Furthermore, the use of technological tools in
personal health mentioned here is referenced by the
WHO’s concept of digital health together with the
classification of Digital Health interventions (WHO,
2018). Thus, the different ways digital technologies
can help health systems are confirmed, aiming to pro-
mote an accessible and binding language for health
systems planning. The remainder of this paper is or-
ganized as follows. Section 2 presents the most signif-
icant related works to define the present study. Next,
section 3 presents the methodology of the work. The
section 4 details the results and discussion. Finally,
Section 5 presents the conclusions of the work.
2 RELATED WORK
Early detection of health problems in chronic dis-
eases, such as T2DM, plays a crucial role in diag-
nosing and treating various comorbidities that arise.
One of the critical aspects of any eHealth solution
is quality management of urgent situations (Rivera
et al., 2019). These situations are currently accessible
across a wide range of embedded sensors. The het-
erogeneity of such sensors and the diversity of user
needs require quality service management and adap-
tation to different critical situations. Considering that
the pathophysiology of T2DM is a continuous pro-
cess, transient critical abnormalities must be detected
early (Brisimi et al., 2019; Dworzynski et al., 2019).
In this sense, sensor networks capable of providing
continuous physiological monitoring data (e.g., glu-
cose, blood pressure, pulse, heart rate) (Ramazi et al.,
2019; Abaker and Saeed, 2021), and lifestyle (diet,
physical activity, among others.) have great potential
to detect these transitions and monitor the progress of
the disease (Faruqui et al., 2019). Internet of Things
technology can significantly contribute in this direc-
tion, allowing the integration of more factors in clin-
ical decision-making related to diabetes management
(Shah and Levy, 2021). Due to the multifactorial na-
ture of DM2, multilevel modeling approaches must be
applied to consider all the different types of factors
strongly associated with the onset and progression
of the disease (Pan et al., 2023). New data analysis
methods can be used to capture correlated and causal
relationships between variables. Examples are clas-
sification and regression-based approaches (e.g., lin-
ear and logistic regression). Such methods can be ap-
plied to identify new biomarkers, which are strongly
related to the onset and evolution of DM2 (Massaro
et al., 2019; Ellahham, 2020; Lee et al., 2023) Ap-
proaches to prediction based on chronic diseases are
dependent on large datasets, and the use of Electronic
Health Records (EHR) from large hospitals or hos-
pital networks is frequent in the literature. For ex-
ample, (Brisimi et al., 2019) seeks to predict hospi-
talizations associated with T2DM within a year from
when the patient’s EHR is examined, treating the
prediction as a classification problem and using data
from the Boston Medical Center (BMC). (Dworzyn-
ski et al., 2019) seeks to predict the future emergence
of comorbidities in patients with T2DM, using data
from 200,000 patients from the public health service
in Denmark, to prove that early intervention can re-
duce the appearance of sub-diseases arising from the
T2DM. The early identification of risk factors asso-
ciated with the development of diabetic foot ulcers
(DFU) using machine learning techniques was carried
Classification and Prediction of Hypoglycemia in Patients with Type 2 Diabetes Mellitus Using Data from the EHR and Patient Context
277

out in the work of (Nanda et al., 2022), to discover the
association of various clinical and biochemists with
DFU and develop a prediction model using different
machine learning algorithms. Clinical and laboratory
data were analyzed using different algorithms, includ-
ing Naive Bayes (NB), K-nearest neighbor (KNN),
and random forest (RF). In (Pan et al., 2023), the ob-
jective is to establish a risk prediction model for dia-
betic retinopathy (DR) in the Chinese population with
T2DM using a few inspection indicators and propose
suggestions for the management of chronic diseases.
For this purpose, a retrospective dataset from 2,385
patients with T2DM was used. The study aimed to
establish a risk prediction model using a few inspec-
tion indicators and propose suggestions for managing
chronic diseases. Related work aims to classify pa-
tients with specific objectives, such as predicting mor-
tality (Brisimi et al., 2019) or more particular health
conditions, such as diabetic foot ulcers (Nanda et al.,
2022) or cognitive impairment (Chen et al., 2021).
Likewise, works in the literature are mainly based
on large-scale datasets originating from the EHR of
large hospitals or hospital networks for training and
testing. Therefore, this work proposes to investigate
the effectiveness of machine learning in predicting the
emergence of cases of hypoglycemia in patients with
DM2, using data originating from the EHR of a clin-
ical center, where the context refers to few resources
and data collection in the context of the patient, using
IoT.
3 MATERIALS AND METHODS
Our methodology can be divided into four steps:
dataset construction (which involves patients’ EHR
data and data collected in the patients’ context), data
preprocessing, training, and testing. Preprocessing
consists of missing data treatment, normalization, and
data balancing. Finally, in the training stage, models
and parameters are defined.
3.1 Dataset
We use two datasets to develop the model. One set
was collected from historical EHR data from patients
treated by a clinical center in Lajeado/RS, and another
was collected in the context of these patients. The first
set comprises information collected from the patient’s
EHR, including vital signs, information about addic-
tions, use of medications to control diabetes, and the
outcome variable (which, in this case, is the detection
of hypoglycemia). The information collected covers
the period from 2016 to 2020. The study was ap-
proved by the ethics committee under certificate nº
4,235,499. In addition, this document follows the
General Data Protection Law (LGPD) recommenda-
tions. The second set of data was collected in the
context of the patients through an application that col-
lected data on vital signs (diastolic blood pressure,
systolic blood pressure, heart rate, body temperature,
weight, body mass index, capillary glucose) and the
value of the patient’s outcome variable. This collected
data serves to update the prediction model. The ap-
plication was installed on the patients’ smartphones,
and they reported vital sign values according to spe-
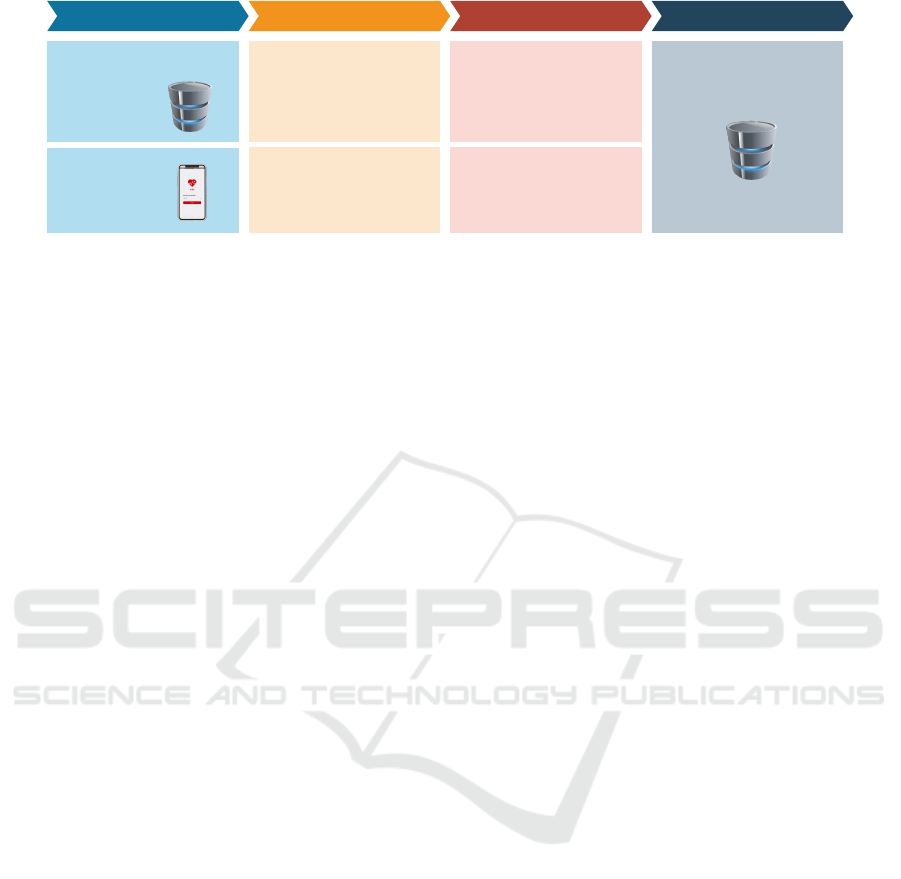
cialist guidance. Figure 1 shows how the final dataset
used in the experiments was constructed. The dataset
was constructed from patients’ EHR data, comprising
structured data on vital signs and data from unstruc-
tured fields involving addictions, medication use, and
outcome variable corrections. The data collected in
the patient’s context was collected through an appli-
cation, collecting data on vital signs and the outcome
variable. After data extraction, these data were cor-
rected and integrated, resulting in the final dataset.
3.2 Pre-Processing
We processed both datasets using the same method-
ology. Due to the origin and nature of the data, there
are missing values and erroneous data, leading to ir-
regular sampling. Therefore, preprocessing steps are
required to clean the data and make it compatible with
the proposed machine learning model. The prepro-
cessing steps considered for this study include han-
dling missing values and normalization (Cenitta et al.,
2022). We apply different filling methodologies to
deal with missing values, which use imputation meth-
ods depending on the missing vital signs and the rea-
son for missing data. The methods were chosen ac-
cording to the work of (Nadimi-Shahraki et al., 2021),
differentiating eventual missing data from a large se-
ries of missing data. For large series of missing data,
mean imputation was used, which can be defined as:
Vt
0
= avg(Vt
1
+ ... +Vt
n
) (1)
where V t
0
is the missing record, and avg(V t
1
+ ... +
Vt
n
) is the average of the records present. We use
imputation when a missing value was present. We
followed the method of (Midroni et al., 2018; Ja-
vidi et al., 2022), using the average of the seven
days immediately following the missing data to cre-
ate a new value for the missing value. For specific
missing data, an approach based on multiple impu-
tation was used (PEDERSEN et al., 2017; CUM-
MINGS, 2013; STERNE et al., 2009), which initially
imputes the missing data in each variable using the
IoTBDS 2024 - 9th International Conference on Internet of Things, Big Data and Security
278
AIDA app
Patient's Context
Electronic Health Record
Clinical Center
Data Source Data Extraction Data Integration Data Base
Patient EHR's data
- Vital signs
- Addictions
- Medication
- Outcome
Vital Signs
Outcome
Integration
- Predictor variables
Integration and Correction
- Outcome variable
Integration
- Vital signs
- Outcome variable
Dataset
Figure 1: Summary of dataset construction.
mean/mode and then imputes each incomplete vari-
able by a separate model, which explores the pre-
viously imputed values of the other variables (BU-
UREN; GROOTHUIS-OUDSHOORN, 2011; BU-
UREN, 2018). In Figure 2, we can see a graph with
large-scale missing data and specific missing data be-
fore imputation (figure A) and after applying the im-
putation techniques (Figure B).
To avoid harming the algorithms’ performance,
the data was normalized in two ways. First, in cate-
gorical variables, we use one-hot-encoding encoding,
using simple integers to deal with textual data, as in
gender information. Data normalization, to change
the values of the data set to a standard scale, without
distorting differences in the value ranges, was per-
formed using min-max scaler (Rakthanmanon et al.,
2013), typically used in health temporal series data
(Faruqui et al., 2019; Javidi et al., 2022).
3.3 Training and Test
Typically, a dataset is used to train a machine learn-
ing model, and an external dataset is used to vali-
date this model, with this external dataset being col-
lected independently of the dataset used in training
(Reddy and Aggarwal, 2015). However, in most prac-
tical cases, data is scarce and difficult to collect. To
solve this problem, we follow a common strategy to
divide the dataset into training and testing sets before
tuning a machine learning model and evaluating the
best model performance (Joseph, 2022). There still
needs to be a consensus on the ideal data split ratio
for training and testing. The most commonly used
divisions are 60:40, 70:30, or 80:20 (Raschka et al.,
2022; Joseph and Vakayil, 2022). In this study, we
used the 80:20 ratio split.
3.4 Evaluation
It is essential to compare different learning algo-
rithms to train and select the best-performing model
(Raschka et al., 2022). A machine learning model
comprises parameters and hyperparameters that affect
the speed and accuracy of the learning process. This
step uses the training data and hyperparameter opti-
mization approaches to tune the models. The training
is divided into multiple sets, and the candidate model
was trained and validated using the cross-validation
procedure (Joseph and Vakayil, 2022). We used a
cross-validation of K-Folds with five folds. We can-
not expect the default hyperparameters of different
learning algorithms provided by software libraries to
be ideal for our specific task. Therefore, we use Ran-
domized search and Grid search techniques for hyper-
parameter optimization, which help us tune the per-
formance of our model (Raschka and Mirjalili, 2019).
We evaluated the model using the area under receiver
operating characteristic (AUC), accuracy, sensitivity,
specificity, and F1 score as performance metrics. Fur-
thermore, to consider the clinical impact of prediction
error and how it may affect a potential medical deci-
sion, we consider the Clarke Grid Error (Clarke et al.,
1987), a criterion related to the mean squared error.
The Clark error grid is a chart with five main zones
of attention (zones A, B, C, D, and E) for interpret-
ing predicted glucose levels. Zone A represents those
values within 20% of the reference value that gener-
ally leads to adequate treatment of patients. Zone B
represents those values outside zone A, but that does
not lead to inappropriate treatment of patients. Pre-
diction values falling into zone C lead to inappropri-
ate treatment without dangerous consequences for the
patient. Predictive values in zone D lead to failure to
detect hypoglycemia or hyperglycemia. Finally, pre-
diction values in zone E lead to inappropriate treat-
ment of hyperglycemia rather than hypoglycemia and
vice versa, depending on the zone’s location. This
way, we can determine an acceptable error for blood
glucose prediction compared to the real observation
(Faruqui et al., 2019).
Classification and Prediction of Hypoglycemia in Patients with Type 2 Diabetes Mellitus Using Data from the EHR and Patient Context
279

(A) (B)
0 100 200 300 400 500 600 700
50
100
150
200
250
300
350
Glucose
Measurements
Glucose
Measurements
Figure 2: Missing data (A) and with imputation techniques used (B).
4 RESULT AND DISCUSSION
This section presents the results of the proposed
method and the comparison with the current liter-
ature for detecting hypoglycemia crises. The best
weights were chosen automatically based on the val-
idation set error. Table 1 presents the performance
obtained for the evaluation metrics in the Lajeado/RS
Clinical Center dataset and the respective comparison
with the current literature. Few studies in the current
literature specifically focus on early detection of hy-
poglycemia in T2DM. Therefore, direct comparison
with related work proves challenging due to dispar-
ities in data sets, objectives, and diverse methodolo-
gies employed. Therefore, the survey of related works
was mainly based on works that detected different co-
morbidities resulting from T2DM. Most of the studies
compared in Table 1 aim to classify patients with spe-
cific objectives, such as predicting mortality (Brisimi
et al., 2019) or more particular health conditions, such
as diabetic foot ulcers (Nanda et al., 2022) or cogni-
tive impairment (Chen et al., 2021). This specificity
contributes to the greater precision observed in these
studies about the evaluation criteria compared to the
results presented in this work. The classification and
prediction of conditions more susceptible to subjec-
tive interpretations, such as hypoglycemia, generally
result in less expressive performance in the evaluation
criteria, as evidenced in the studies by (Saravanaku-
mar and Sabibullah, 2022) and (Lee et al., 2023),
justifying results more aligned with the metrics pre-
sented. Despite the different objectives, the results
presented in Tab. 1 show that even without having a
well-defined outcome variable objective, such as hy-
poglycemia, it is possible to achieve results that are
very close to or better than comparative studies. At
this point, it is essential to highlight the sensitivity
(90.00%), demonstrating that the model can identify
cases satisfactorily. The proposed method obtained
a value of 0.820 for the ROC curve. Compared to
related works in the classification literature, our ap-
proach is in line with the other works, a little below
the results of (Brisimi et al., 2019), (Nanda et al.,
2022), and (Lee et al., 2023), but above the others.
Furthermore, the data used by related works origi-
nates solely from patients’ structured EHRs. In our
method, the source data of the dataset involves EHR
data and data collected in the patient context. There-
fore, our method may have been hampered in terms
of evaluation criteria due to data gaps and respective
imputation methods. On the other hand, we can con-
sider that, as the data are of multiple origins, it may
be more susceptible to use as support for decision-
making in monitoring patients with T2DM. The pre-
dictions were plotted under the Clarke Grid error
graph to visualize the predictions in their respective
error zones. The plot of the data presented in Figure 3
shows that few predictions were in error zones in the
Clarke Grid that denote problems in the treatment. We
can see in the graph that only one point was predicted
in Zone D, which can lead to a failure to detect hypo-
glycemia. Most of the predicted points plotted in Fig-
ure 3 are in zones A and B, which are either within the
reference values for adequate treatment (Zone A) or
are outside the reference zone but do not lead to inad-
equate treatment of the patient (Zone B). The results
of our study demonstrate that utilizing data collected
in the patient context and merging this data with the
EHR can be a practical approach for predicting health
decline and potential hypoglycemic crises. Although
there is space for improvement in classification and
prediction performance metrics, the current results are
promising and open possibilities for studies of our
model in chronic disease monitoring settings, such as
T2DM.
IoTBDS 2024 - 9th International Conference on Internet of Things, Big Data and Security
280
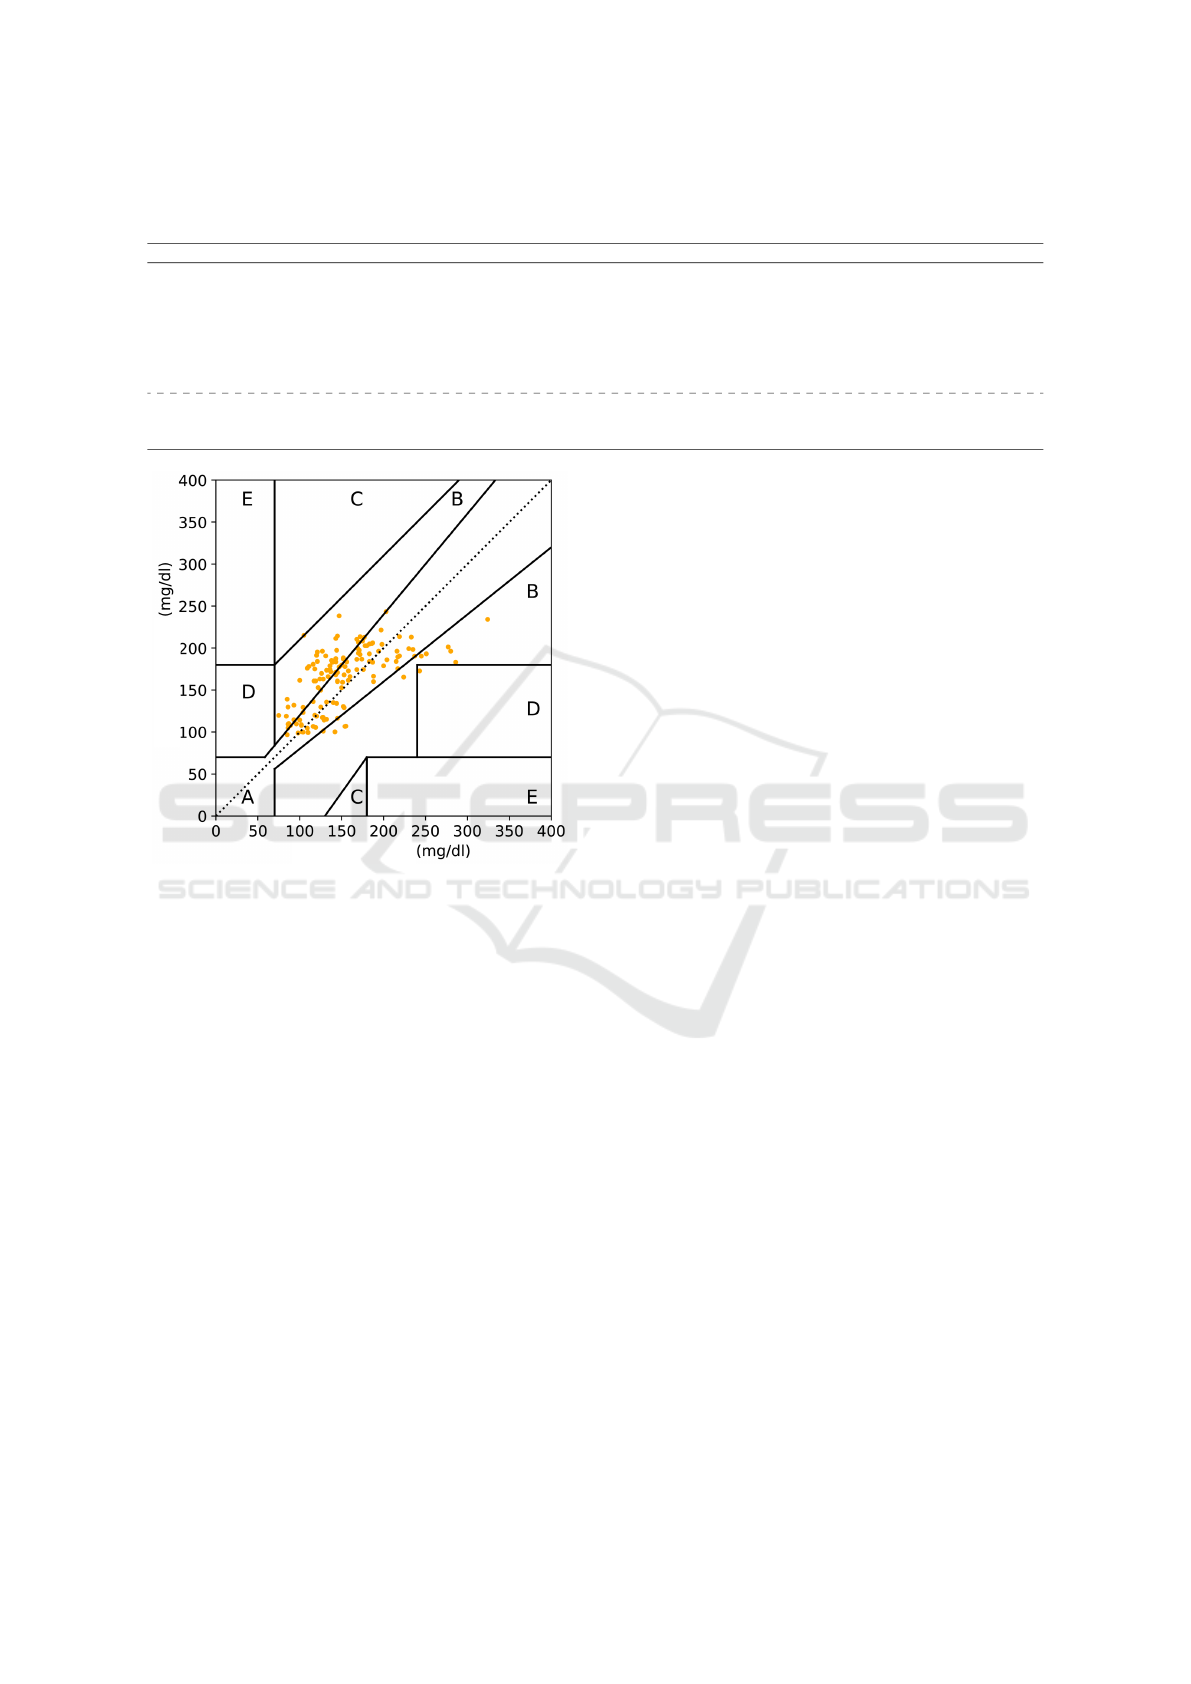
Table 1: Comparison with related works. AUC: area under the receiver operating characteristic. Acc: Accuracy. Sen:
Sensibility. Spe: Specificity. F1: F1-score.
Study Dataset AUC Acc Sen Spe F1
(Brisimi et al., 2019) Private 0.890 - - - -
(Dworzynski et al., 2019) Private 0.800 - - - -
(Chen et al., 2021) Private 0.810 79.00 69.57 88.00 76.19
(Nanda et al., 2022) Private 0.970 - 95.00 93.80 -
(Pan et al., 2023) Private 0.700 79.00 00.03 - 00.06
(Lee et al., 2023) Private 0.830 90.00 69.40 - 65.10
Ours Private 0.8200 74.00 90.00 72.00 46.00
Measured glucose
Predicted glucose
Figure 3: Clarke Grid error for glucose prediction.
5 CONCLUSION
This study explored the use of EHR and patient-
context data to support hypoglycemia classification
and prediction models in patients with T2DM. The re-
sults showed that the proposed approach could some-
times surpass the results of related works that use only
data from EHR. Furthermore, using the Clarke Error
Grid to evaluate results can help relate the evalua-
tion criteria, showing that the model can be applied
in clinical environments. This work has some limi-
tations. The first relates to the union of the dataset
originating from the patient’s EHR with the data col-
lected in the patient’s context and the different data
collection failures. Therefore, studying different im-
putation methods and methods to prevent failures or
methodologies for greater patient adherence to tech-
nology use are perspectives for future work. Another
limiting aspect is the low amount of data collected re-
garding the patient (since this work presents partial
results). In this way, data collection is expected to
continue in the patient’s context, allowing a possible
improvement in the evaluation criteria, especially in
the part that refers to the prediction of hypoglycemic
crises. The benefits of using technology to monitor
chronic patients are significant, allowing faster diag-
noses and emerging as a contribution to medical di-
agnosis, notably in chronic diseases. The proposed
method can help save time and resources, especially
public healthcare. These advantages make the pro-
posed approach a promising tool for monitoring pa-
tients with T2DM in real clinical scenarios.
ACKNOWLEDGEMENTS
The authors would like to thank the Coordination for
the Improvement of Higher Education Personnel -
CAPES (Financial Code 001), the National Council
for Scientific and Technological Development - CNPq
(Grant numbers 309537/2020-7 e 40572/2021-9), and
the Federal Institute of Education, Science and Tech-
nology—IFRS. for your support in this work.
REFERENCES
Abaker, A. A. and Saeed, F. A. (2021). A comparative anal-
ysis of machine learning algorithms to build a predic-
tive model for detecting diabetes complications. In-
formatica (Slovenia), 45(1):117–125.
Baloch, Z., Shaikh, F. K., and Unar, M. A. (2018).
A context-aware data fusion approach for health-
iot. International Journal of Information Technology,
10(3):241–245.
Banos, O., Villalonga, C., Damas, M., Gloesekoetter, P., Po-
mares, H., and Rojas, I. (2014). Physiodroid: Combin-
ing wearable health sensors and mobile devices for a
ubiquitous, continuous, and personal monitoring. The
Scientific World Journal, 2014.
Beagley, J., Guariguata, L., Weil, C., and Motala, A. A.
(2014). Global estimates of undiagnosed diabetes
in adults. Diabetes Research and Clinical Practice,
103(2):150–160.
Bertoluci, M. C., Forti, A. C., Pititto, B. d. A., Valente, F.,
Classification and Prediction of Hypoglycemia in Patients with Type 2 Diabetes Mellitus Using Data from the EHR and Patient Context
281

de S
´
a, J. R., da Silva Junior, J. C., Fagundes, K. M.,
Damaceno, L. F., Zajdenverg, L., Calliari, L. E. P.,
Rodacki, M., Montenegro Junior, R. M., Lamounier,
R. N., and Vencio, S. A. C. (2021). Diretriz da So-
ciedade Brasileira de Diabetes. Sociedade Brasileira
de Diabetes.
Brisimi, T. S., Xu, T., Wang, T., Dai, W., and Paschalidis,
I. C. (2019). Predicting diabetes-related hospitaliza-
tions based on electronic health records. Statistical
Methods in Medical Research, 28(12):3667–3682.
Cenitta, D., Arjunan, R. V., and V, P. K. (2022). Ischemic
heart disease multiple imputation technique using ma-
chine learning algorithm. ”Engineered Science, 19
(September 2022):262–272.
Chen, Y., Zhou, Z., Liang, Y., Tan, X., Li, Y., Qin, C., Feng,
Y., Ma, X., Mo, Z., Xia, J., Zhang, H., Qiu, S., and
Shen, D. (2021). Classification of type 2 diabetes
mellitus with or without cognitive impairment from
healthy controls using high-order functional connec-
tivity. Human Brain Mapping, 42(14):4671–4684.
Clarke, W. L., Cox, D., Gonder-Frederick, L. A., Carter, W.,
and Pohl, S. L. (1987). Evaluating Clinical Accuracy
of Systems for Self-Monitoring of Blood Glucose. Di-
abetes Care, 10(5):622–628.
da Costa, C. A., Pasluosta, C. F., Eskofier, B., da Silva,
D. B., and da Rosa Righi, R. (2018). Internet of Health
Things: Toward intelligent vital signs monitoring in
hospital wards. Artificial Intelligence in Medicine,
89(March 2017):61–69.
Dey, A. K., Abowd, G. D., and Salber, D. (2001). A con-
ceptual framework and a toolkit for supporting the
rapid prototyping of context-aware applications. Hu-
man–Computer Interaction, 16(2-4):97–166.
Dworzynski, P., Aasbrenn, M., Rostgaard, K., Melbye, M.,
Gerds, T. A., Hjalgrim, H., and Pers, T. H. (2019). Na-
tionwide prediction of type 2 diabetes comorbidities.
bioRxiv, page 664722.
Ellahham, S. (2020). Artificial intelligence: the future for
diabetes care. The American journal of medicine,
133(8):895–900.
Faruqui, S. H. A., Du, Y., Meka, R., Alaeddini, A., Li,
C., Shirinkam, S., and Wang, J. (2019). Develop-
ment of a deep learning model for dynamic forecast-
ing of blood glucose level for type 2 diabetes mellitus:
Secondary analysis of a randomized controlled trial.
JMIR mHealth and uHealth, 7(11):1–14.
Gao, J., Yi, P., Chi, Z., and Zhu, T. (2017). A smart medical
system for dynamic closed-loop blood glucose-insulin
control. Smart Health, 1-2(February):18–33.
Guariguata, L., Whiting, D. R., Linnenkamp, U., Bea-
gley, J., and Shaw, J. (2014). Global estimates of
the prevalence of impaired glucose tolerance for 2013
and projections to 2035. In Diabetes, volume 63,
pages A391–A391. AMER DIABETES ASSOC 1701
N BEAUREGARD ST, ALEXANDRIA, VA 22311-
1717 USA.
Hudson, L. (1985). Design of the intensive care unit
from a monitoring point of view. Respiratory care,
30(7):549—559.
Javidi, H., Mariam, A., Khademi, G., Zabor, E. C., Zhao,
R., Radivoyevitch, T., and Rotroff, D. M. (2022).
Identification of robust deep neural network models
of longitudinal clinical measurements. npj Digital
Medicine, 5(1):1–11.
Joseph, V. R. (2022). Optimal ratio for data splitting. Sta-
tistical Analysis and Data Mining, 15(4):531–538.
Joseph, V. R. and Vakayil, A. (2022). SPlit: An Optimal
Method for Data Splitting. Technometrics, 64(2):166–
176.
Lee, J.-Y., Won, D., and Lee, K. (2023). Machine learning-
based identification and related features of depression
in patients with diabetes mellitus based on the korea
national health and nutrition examination survey: A
cross-sectional study. PLOS ONE, 18(7):1–11.
Massaro, A., Maritati, V., Giannone, D., Convertini, D.,
and Galiano, A. (2019). LSTM DSS automatism and
dataset optimization for diabetes prediction. Applied
Sciences (Switzerland), 9(17):3532.
Midroni, C., Leimbigler, P. J., Baruah, G., Kolla, M., White-
head, A. J., and Fossat, Y. (2018). Predicting glycemia
in type 1 diabetes patients: Experiments with XG-
Boost. CEUR Workshop Proceedings, 2148:79–84.
Montori, F., Bedogni, L., Felice, M. D., and Bononi, L.
(2018). Machine-to-machine wireless communication
technologies for the Internet of Things: Taxonomy,
comparison and open issues. Pervasive and Mobile
Computing, 50:56–81.
Moura, E. C., Pacheco-Santos, L. M., Peters, L. R., Ser-
ruya, S. J., and Guimar
˜
aes, R. (2012). Research on
chronic noncommunicable diseases in Brazil: meet-
ing the challenges of epidemiologic transition. Revista
Panamericana de Salud P
´
ublica, 31(3):240–245.
Mshali, H., Lemlouma, T., and Magoni, D. (2018). Adap-
tive monitoring system for e-health smart homes. Per-
vasive and Mobile Computing, 43:1–19.
Nadimi-Shahraki, M. H., Mohammadi, S., Zamani, H.,
Gandomi, M., and Gandomi, A. H. (2021). A hybrid
imputation method for multi-pattern missing data: A
case study on type ii diabetes diagnosis. Electronics
(Switzerland), 10(24):3167.
Nanda, R., Nath, A., Patel, S., and Mohapatra, E. (2022).
Machine learning algorithm to evaluate risk factors
of diabetic foot ulcers and its severity. Medical and
Biological Engineering and Computing, 60(8):2349–
2357.
Ogurtsova, K., da Rocha Fernandes, J. D., Huang, Y., Lin-
nenkamp, U., Guariguata, L., Cho, N. H., Cavan, D.,
Shaw, J. E., and Makaroff, L. E. (2017). IDF Diabetes
Atlas: Global estimates for the prevalence of diabetes
for 2015 and 2040. Diabetes Research and Clinical
Practice, 128:40–50.
Pagiatakis, C., Rivest-H
´
enault, D., Roy, D., Thibault, F.,
and Jiang, D. (2020). Intelligent interaction interface
for medical emergencies: Application to mobile hypo-
glycemia management. Smart Health, 15(November
2019).
Pan, H., Sun, J., Luo, X., Ai, H., Zeng, J., Shi, R., and
Zhang, A. (2023). A risk prediction model for type 2
diabetes mellitus complicated with retinopathy based
IoTBDS 2024 - 9th International Conference on Internet of Things, Big Data and Security
282

on machine learning and its application in health man-
agement. Frontiers in Medicine, 10.
Pasquier, T., Singh, J., Powles, J., Eyers, D., Seltzer, M.,
and Bacon, J. (2018). Data provenance to audit com-
pliance with privacy policy in the Internet of Things.
Personal and Ubiquitous Computing, 22(2):333–344.
Qi, J., Yang, P., Min, G., Amft, O., Dong, F., and Xu, L.
(2017). Advanced internet of things for personalised
healthcare systems: A survey. Pervasive and Mobile
Computing, 41:132 – 149.
Rakthanmanon, T., Campana, B., Mueen, A., Batista, G.,
Westover, B., Zhu, Q., Zakaria, J., and Keogh, E.
(2013). Addressing big data time series: Mining tril-
lions of time series subsequences under dynamic time
warping. ACM Transactions on Knowledge Discovery
from Data, 7(3).
Ramazi, R., Perndorfer, C., Soriano, E., Laurenceau, J.-
P., and Beheshti, R. (2019). Multi-modal Predictive
Models of Diabetes Progression. In Proceedings of
the 10th ACM International Conference on Bioinfor-
matics, Computational Biology and Health Informat-
ics - BCB ’19, volume 8, pages 253–258, New York,
New York, USA. ACM Press.
Ramazi, R., Perndorfer, C., Soriano, E. C., Laurenceau,
J. P., and Beheshti, R. (2021). Predicting progression
patterns of type 2 diabetes using multi-sensor mea-
surements. Smart Health, 21(February):100206.
Raschka, S., Liu, Y. H., Mirjalili, V., and Dzhulgakov, D.
(2022). Machine Learning with Pytorch and Scikit-
Learn: Develop Machine Learning and Deep Learn-
ing Models with Python. Packt Publishing Ltd.
Raschka, S. and Mirjalili, V. (2019). Python machine learn-
ing: Machine learning and deep learning with Python,
scikit-learn, and TensorFlow 2. Packt Publishing Ltd.
Reddy, C. K. and Aggarwal, C. C., editors (2015). Health-
care Data Analytis. Chapman and Hall/CRC, Min-
neapolis, Minnesota, USA.
Rivera, L. F., Jim
´
enez, M., Angara, P., Villegas, N. M.,
Tamura, G., and M
¨
uller, H. A. (2019). Towards con-
tinuous monitoring in personalized healthcare through
digital twins. In Proceedings of the 29th Annual
International Conference on Computer Science and
Software Engineering, CASCON ’19, page 329–335,
USA. IBM Corp.
Rosa, R., Nita, M. E., Rached, R., Donato, B., and Rahal,
E. (2014). Estimated hospitalizations attributable to
Diabetes Mellitus within the public healthcare system
in Brazil from 2008 to 2010: study DIAPS 79. Revista
da Associac¸
˜
ao M
´
edica Brasileira, 60(3):222–230.
Saravanakumar, V. M. and Sabibullah, M. (2022). Well-
ness Prediction in Diabetes Mellitus Risks Via Ma-
chine Learning Classifiers. International Journal of
Computer Science and Network Security, 22(4):203–
208.
Shah, N. A. and Levy, C. J. (2021). Emerging technolo-
gies for the management of type 2 diabetes mellitus.
Journal of Diabetes, 13(9):713–724.
Tavares, J., Barbosa, J., Cardoso, I., Costa, C., Yamin, A.,
and Real, R. (2016). Hefestos: an intelligent system
applied to ubiquitous accessibility. Universal Access
in the Information Society, 15(4):589–607.
WHO (2018). Classification of digital health interventions
v1.0 A shared language to describe the uses of digital
technology for health.
WHO (2020). Global Strategy on Digital Health.
Classification and Prediction of Hypoglycemia in Patients with Type 2 Diabetes Mellitus Using Data from the EHR and Patient Context
283
