
Semantic Segmentation of Crops via Hyperspectral PRISMA
Satellite Images
Manilo Monaco
1a
, Angela Sileo
2
, Diana Orlandi
3
, Maria Libera Battagliere
1b
,
Laura Candela
1
, Mario G.C.A. Cimino
3c
, Gaetano A. Vivaldi
4d
and Vincenzo Giannico
4e
1
Italian Space Agency, Matera/Rome, Italy
2
The Revenue Agency, Matera, Italy
3
Dept. of Information Engineering, University of Pisa, Pisa, Italy
4
Dept. of Soil, Plant and Food Sciences, University of Bari “Aldo Moro”, Bari, Italy
laura.candela@asi.it, mario.cimino@unipi.it, gaetano.vivaldi@uniba.it, vincenzo.giannico@uniba.it
Keywords: Crop-Type Mapping, PRISMA, Satellite Hyperspectral Imagery, Convolutional Neural Network.
Abstract: Data from hyperspectral remote sensing are promising to extract and classify crop characteristics, because it
provides accurate and continuous spectral signatures of crops. This paper focuses on data acquired by
PRISMA, a high-resolution hyperspectral imaging satellite. Due to this large data availability, huge training
datasets can be built to feed modern deep learning algorithms. This paper shows a spectral-temporal data
processing based on random forest to perform feature selection, and on two-dimensional convolutional neural
network to carry out classification of crops, exploiting variations in respective phenological phases during the
annual life cycle. The proposed solution is described via a pilot case study, involving a field farmed with olive
groves and vineyards in Apulia, Italy. Moreover, one-dimensional convolutional neural networks are used to
compare classification accuracies. Early results are promising with respect to the literature.
1 INTRODUCTION
Agriculture represents an ideal application domain
for the use of hyperspectral imaging technology due
to several concurrent factors such as high biological
complexity, wide variety of plant growth conditions,
climatic conditions, soil types, and crops.
Data from hyperspectral remote sensing can be
used to extract and classify crop characteristics.
Typically, since it is unstructured data, convolutional
architectures can handle this application effectively
because they work on both the spatial and spectral
dimensions of the data (Bhosle, 2022).
Thanks to its high spectral resolution and the
resulting sensitivity to subtle spectral variations
between ground objects, hyperspectral data have been
used with excellent results to identify crop types and
varieties in order to obtain spatial distribution maps
a
https://orcid.org/0000-0001-5122-4520
b
https://orcid.org/0000-0002-4272-7238
c
https://orcid.org/0000-0002-1031-1959
d
https://orcid.org/0000-0002-5798-2573
e
https://orcid.org/0000-0002-9907-3730
and to acquire information on the structural,
biochemical and physiological properties of plants.
However, it should be emphasized that hyperspectral
data with medium to high spatial resolution, which
are typically used for accurate crop classification, are
unsuitable for use at regional- or country-level for this
application purpose, precisely because of their high
spectral and spatial dimensionalities and the resulting
excessive computational workload required.
Therefore, in the near future the identification of
both dimensionality reduction strategies and
methodologies that make use of classifiers that can
speed up "near real-time" processing of hyperspectral
data will be of critical importance for solving
classification problems at regional- or country-level
(Zhang, 2019).
Monaco, M., Sileo, A., Orlandi, D., Battagliere, M., Candela, L., Cimino, M., Vivaldi, G. and Giannico, V.
Semantic Segmentation of Crops via Hyperspectral PRISMA Satellite Images.
DOI: 10.5220/0012705700003696
Paper published under CC license (CC BY-NC-ND 4.0)
In Proceedings of the 10th International Conference on Geographical Information Systems Theory, Applications and Management (GISTAM 2024), pages 187-194
ISBN: 978-989-758-694-1; ISSN: 2184-500X
Proceedings Copyright © 2024 by SCITEPRESS – Science and Technology Publications, Lda.
187

1.1 Land Use and Land Cover
The task known as Land Use and Land Cover (LULC)
refers to segment, that is, to classify each pixel of a
remote sensing image, or to identify particular objects
or regions within the image. In literature, this task,
and more specifically crop segmentation, is by far the
most likely to be approached with deep learning
techniques. Land cover mapping is considered the
most important descriptor of terrestrial environmental
dynamics (Herold, 2006).
Automated methods represent the least reliable
system, but simultaneously the easiest to scale. In
summary, the research goal in land use and land cover
and in crop segmentation task is to improve the
quality of automated methods, with the aim of
equating their reliability to that of human experts.
Crops’ phenological phases are specific plant
growth stages influenced by climatic conditions.
Satellite remote sensing provides temporal series on
vegetation development with a short revisiting period.
It provides data source for monitoring vegetation
phenology, considering the full spectral information
from multispectral and hyperspectral imagery.
Analysis of satellite images is linked to the seasonal
variation of cultivated surfaces such as the beginning
of the vegetative season (green-up), the peak of the
growing season, and the end of the growing season,
i.e. the senescence, by using spectral bands or
vegetation indices that best describe these changes.
The use of phenology can be employed as a classifier
to map crops. The accuracy of classification is
affected by both the distribution of vegetation cover
within the pixel and the specificity of the spectral-
temporal signatures of different crops to be identified.
The highest accuracy for recognizing different
phenological phases is achieved by using
combinations of bands that fall within the near-
infrared (NIR), red-edge, and shortwave infrared
(SWIR) domains (Abubakar, 2023; Peng, 2023).
In most studies involving the implementation of
automated systems for mapping land use and land
cover, supervised learning models are typically used,
and there are basically three methods for constructing
training datasets: manual field inspection, visual
inspection of remote sensing images, and application
of automated methods. Manual inspections of the area
to be segmented are the most reliable, but also the
most difficult and expensive method. Using an
automated method is less reliable and cheaper, but it
greatly limits the models' ability to learn the actual
distribution of classes in the images, misleading the
models to focus on the dynamics of the automated
method used for labeling. Therefore, in some papers
the authors use a combination of the previous two
methods, instead in other papers labeling is done
completely through visual inspection of the remote
sensing images, which is still a less reliable method
than manual inspection in the field (Victor, 2022).
1.2 Deep Learning Models
In literature, various deep learning architectures are
widely used in the context of land use and land cover
tasks, as well as in agricultural crop segmentation.
Aside from the great popularity of these types of
tasks, the main reason for success lies in the relative
ease of obtaining data, which enables the construction
of sufficiently large training datasets to feed modern
deep learning algorithms. In fact, studies that focus
on these applications usually work with datasets
containing 2000 to 10000 samples that, although
small by deep learning standards, are significantly
larger than datasets used in other precision
agriculture-related applications. Typically, the best
modern deep learning methods, namely convolutional
neural networks (CNNs), recurrent neural networks
(RNNs), and Transformers (neural networks that rely
on the attention mechanism), provide more accurate
results than traditional machine learning methods,
including decision trees, support vector machines,
random forests, and multi-layer perceptrons (Victor,
2022). An early attempt of using modern deep
learning techniques for land use and land cover was
in 2017, when Kussul et al. proposed a custom
architecture consisting of five convolutional layers
and, using a dataset composed of 100000 pixels
labeled through manual field inspection, found that
convolutional neural networks working on two
dimensional axes (2DCNNs) provided more accurate
results than random forests, multi-layer perceptrons,
and convolutional neural networks working on only
one dimensional axis (1DCNNs).
In most works using two-dimensional (2D)
convolutional neural networks to segment crop types,
the authors have built custom network architectures
both in the arrangement and type of layers and in the
number of units per layer, typically preferring
shallower networks with fewer than 10 hidden layers.
In contrast, only a few authors use more common and
well-known architectures typically used in generic
computer vision tasks, such as VGG, ResNet and
UNet (Victor, 2022; Orlandi, 2023). Spatiotemporal
data processing can be accomplished through two
main classes of algorithms: the first is convolutional
neural networks working on three dimensional axes
(3DCNN) (Ji, 2018; Gallo, 2021), while the second is
the use of a convolutional network working on two
GISTAM 2024 - 10th International Conference on Geographical Information Systems Theory, Applications and Management
188
dimensional axes (2DCNN) and cascading a recurrent
neural network (RNN) with LSTM or GRU cells to
process the outputs of the former (Rußwurm, 2020;
Teimouri, 2019). However, the two previous methods
have not been compared with each other.
In generic computer vision tasks, Transformers
architectures (Dosovitskiy, 2021; Orlandi, 2022),
based on the self-attention mechanism, represent the
state of the art on major industry benchmarks, so one
might expect them to be so on satellite image
classification tasks as well. However, in works
comparing a Transformer network with other modern
deep learning methods, the Transformer network does
not always achieve more accurate results (Rußwurm,
2020; Tang, 2022; Sykas, 2022). In this regard, it is
important to point out that typically Transformers
networks require more training data even than
convolutional neural networks (even the ImageNet
dataset that collects over one million labeled images
turns out to be too small). So it is simply possible that
the datasets used in the studies mentioned above are
not large enough for Transformers networks to begin
to take full advantage of their features and thus
outperform CNNs, and LSTMs or GRUs.
This paper shows a spectral-temporal data
processing method based on random forest, followed
by a two-dimensional convolutional network. A
comparison with a mono-dimensional convolutional
network is also provided.
The paper is structured as follows. Section 2
describes the materials and method: overall data
processing workflow is described by Section 2.1,
whereas detailed data preparation and processing are
covered by Section 2.2. In Section 3, experimental
results are shown. Finally, Section 4 draws
conclusions.
2 MATERIALS AND METHOD
2.1 Overall Data Processing Workflow
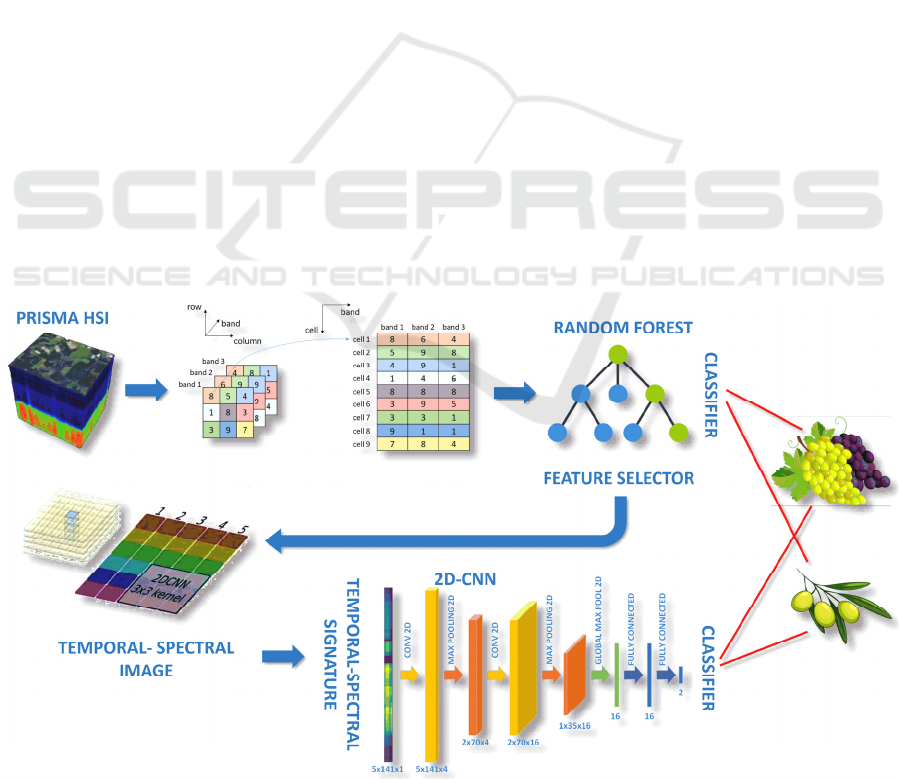
Figure 1 describes the overall data processing
workflow. On the top left, the hyperspectral cube
represents the data acquired by PRISMA satellite,
processed by the ground segment processing chain to
provide an L2D product, already atmospherically
corrected and geocoded. The 3D-hyperspectral
images are then transformed into a bidimensional
matrix, to feed the random forest model. When used
as a classifier, the random forest model provides
directly the target class (olive/grapevine). In addition,
it provides the most important features in order to
dimensionally reduce the 3D-hyperspectral images
throughout the spectral axis. Each pixel of the
reduced images is then projected onto the spectral-
temporal image. Finally, the spectral-temporal image
is considered as an input of the 2D Convolutional
Neural Network, which in turn provides the target
class. The next section illustrates a detailed pipeline
via a pilot example.
Figure 1: Overall data processing workflow.
Semantic Segmentation of Crops via Hyperspectral PRISMA Satellite Images
189
2.2 Detailed Data Processing
The dataset was generated from five hyperspectral
images acquired by means of the payload of the
PRISMA mission satellite (eoPortal, 2024). This
payload consists of an electro-optical instrument,
based on a pushbroom scanning technique, achieved
via a high spectral resolution imaging spectrometer.
The spectrometer works in the range of the
electromagnetic spectrum 0.4-2.5µm, covering both
the visible and near-infrared band (VNIR 0.4-1.0µm)
and the mid-infrared band (SWIR 0.9-2.5µm),
supplemented with a medium-resolution
panchromatic camera working in the spectral range
0.4-0.7µm (Candela, 2016).
The number of spectral channels is 66 for the
VNIR band and 173 for the SWIR band. However, in
this research only 63 channels were considered for the
VNIR band, due to the non-availability of 3 channels,
and 167 channels for the SWIR band, due to the non-
availability of 3 channels and the partial overlap of
the two spectral bands. Table 1 shows some
geometric characteristics of the images used in the
study, at 2D processing level: Acquisition Time
(Time), Average Solar Zenith (ASZ) Angle in 0-90
deg., Average Observing (AO) Angle in 0-90 deg.,
Average Relative Azimuth (ARA) Angle in 0-90
deg., and Size (pixel).
Table 1: Geometric characteristics of the PRISMA products
used.
Time
ASZ
Angle
AO
Angle
ARA
Angle
Size
23/04/2022
09:51:35
22.17° 1.42° 29.75°
1191 ×
1205 px
20/06/2022
09:51:33
15.41° 1.62° 21.21°
1190 ×
1212 px
19/07/2022
09:51:51
17.03° 1.22° 20.49°
1185 ×
1235 px
31/10/2022
09:45:13
40.89° 10.97° 44.23°
1191 ×
1258 px
05/12/2022
09:48:34
45.88° 6.11° 43.63°
1188 ×
1214 px
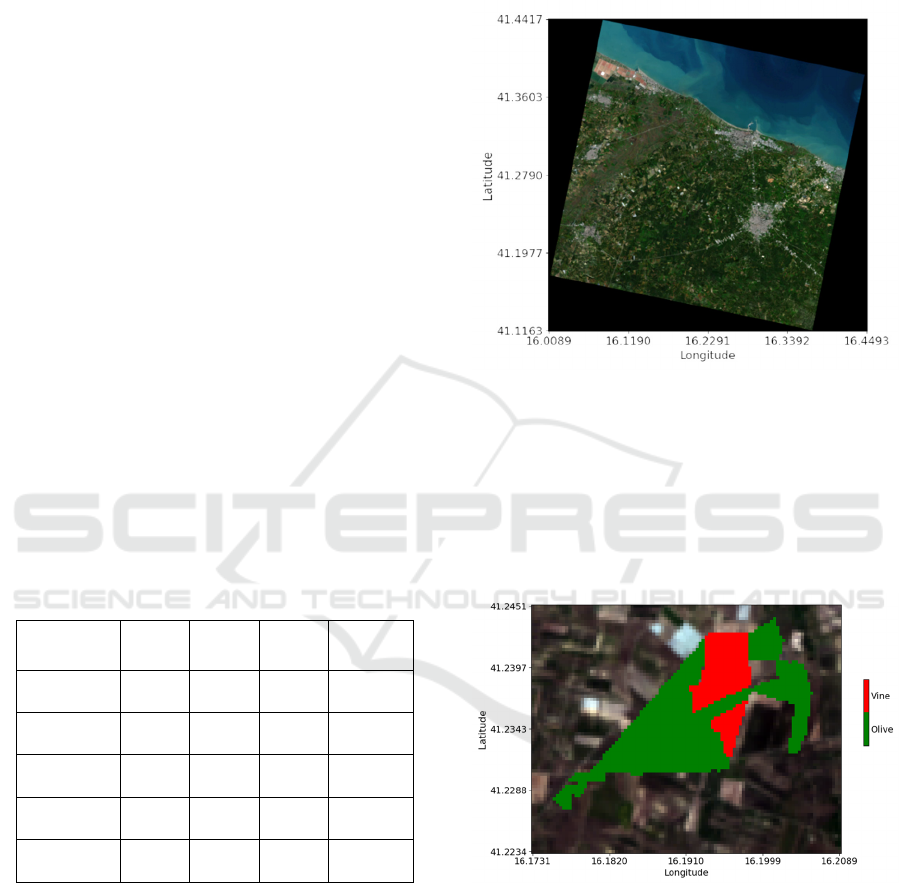
Figure 2 represents a sample PRISMA image
acquired on 05/12/2022, considering the red, green
and blue (RGB) channels at the wavelengths of
664.8941nm, 559.02026nm, and 489.79486nm,
respectively. The image, characterized by a swath
coverage of 30Km and a Ground Sampling Distance
(GSD) of 30m, was orthorectified by the ground
segment processing chain (L2D product).
The study area is located in Apulia, southeast
Italy, and is mainly characterized by agricultural land
planted with olive groves and vineyards. The area of
interest was selected based on the geographic
coordinates of a shapefile containing the ground truth,
i.e., the geometries of the olive and grapevine
growing areas.
Figure 2: A PRISMA image in RGB channels acquired on
05/12/2022.
Figure 3 shows a sample area of interest, where
pixels that include olive and vine crops have been
highlighted with different colors. The area of interest
has a total size of about 162ha, out of which about
123ha is planted with olive groves and about 39ha is
planted with vineyards.
Figure 3: Area of interest for olive and vine crops.
Figure 4 shows the average pixel spectral
signatures of the olive grove (in green) and vineyard
(in red) cultivated areas for the image acquired on
05/12/2022. Specifically, the graph shows the
spectral reflectance values at the surface, compared to
the central wavelengths of the spectral channels
included into the VNIR and SWIR bands.
GISTAM 2024 - 10th International Conference on Geographical Information Systems Theory, Applications and Management
190
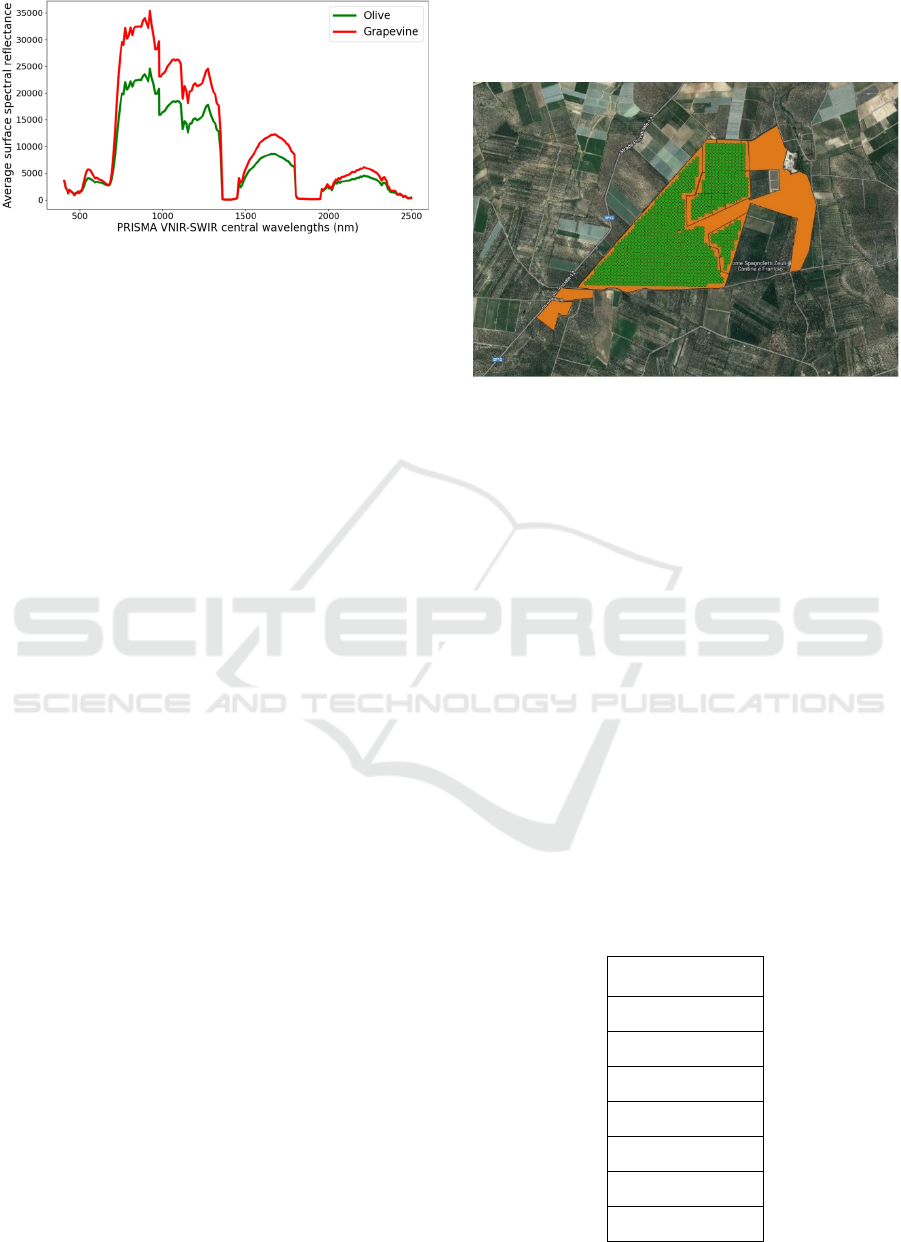
Figure 4: Average spectral signatures related to olive grove
and vineyard areas for image acquired on 05/12/2022.
In this work, a pixel-wise classification approach
was used, i.e. the model input is a single pixel. The
model output is represented by the crop class located
in the corresponding input pixel, i.e., olive or
grapevine. In order to take advantage of information
contained in the temporal dimension, mainly related
to the different variations in the spectral signature of
plants during their respective annual phenological
cycle, the pixels of the collected five images were
stacked according to the nearest neighbor approach,
by taking as reference the pixel positions of the first
image (master) in time order. However, due to the
differences in acquisition geometries, it was observed
that the positions of the stacked pixels could have
distances comparable to the ground sampling
distance, resulting in only partial overlapping of the
pixel areas involved, and correspondingly of the pixel
spectral signatures. Therefore, the reflectance value
of any single pixel was replaced by the average
reflectance value of its Moore neighborhood. As a
result, the overlapping areas of the wider stacked
pixels can fully include original areas of the single
pixels, also making the distribution of reflectance
values more regular.
In order to reduce the chance of having pixels with
spectral reflectances resulting from the contribution
of both plant species or roads between fields, pixels
located near the perimeters of crop field geometries
were removed. In addition, to improve the balance of
the dataset, pixels from two small areas located in the
southwestern part of the cultivated field were
removed, because characterized by a different
planting orientation. Similarly, pixels from a larger
area planted with olive groves including also
uncultivated areas were removed.
Figure 5 highlights the positions of the pixels
considered in the dataset (green dots), compared to
the entire original area of interest (orange geometric
area). The resulting whole dataset consists of 1042
stacks made up of five pixels each. Specifically, 721
samples are related to olive grove areas and 321
samples are related to vineyard areas. In addition,
spectral reflectance values in the 230 channels of the
PRISMA bands are associated with each pixel.
Figure 5: Set of pixels (green dots) considered in the
dataset.
3 EXPERIMENTAL RESULTS
The agricultural land-use classification (olive groves
vs vineyards) methodology designed in this work
consists of two basic steps: the first step selects the
PRISMA spectral channels that are more significant
to discriminate between the crop species, while the
second step aims to carry out the actual classification.
Spectral channels selection was achieved through
the Random Forest algorithm by classification. The
dataset was modelled by merging all the pixels of the
five available images (5210 overall samples) and
considering the spectral dimension for the selection
of relevant features. The fitting of the Random Forest
model was performed by a 5-fold cross-validation.
Table 2 shows the overall accuracy of the model over
the five validation sets, in terms of 95% confidence
interval of the mean value.
Table 2: Cross-validation for Random Forest classification.
Single folds:
0.879078
0.832053
0.815739
0.924184
0.887715
Overall accuracy:
0.87 ± 0.04
Semantic Segmentation of Crops via Hyperspectral PRISMA Satellite Images
191
When providing the ranking of features’
importance, the Random Forest algorithm computes
the importance score for each feature, then it scales
the results so that the sum of all importances is equal
to one. In order to reduce the dimensionality of the
dataset along the spectral axis, a number of spectral
channels were selected such that the sum of relative
importances was equal to 0.95. The resulting dataset
kept 141 spectral channels from the starting 230.
Table 3 contains the top five spectral channels in
order of importance and shows that the spectral band
between 1018nm and 1047nm is critical for
discriminating between olive groves and vineyards,
with a cumulative importance of more than 14% of
the overall importance.
Table 3: Relative importance of the top five spectral
channels.
Rank Band (N.)
Central
Wavelength(nm)
Importance
(%)
1 71 1047.675 4.02
2 69 1029.344 3.87
3 68 1018.5357 3.36
4 70 1037.9878 2.93
5 40 733.9552 2.83
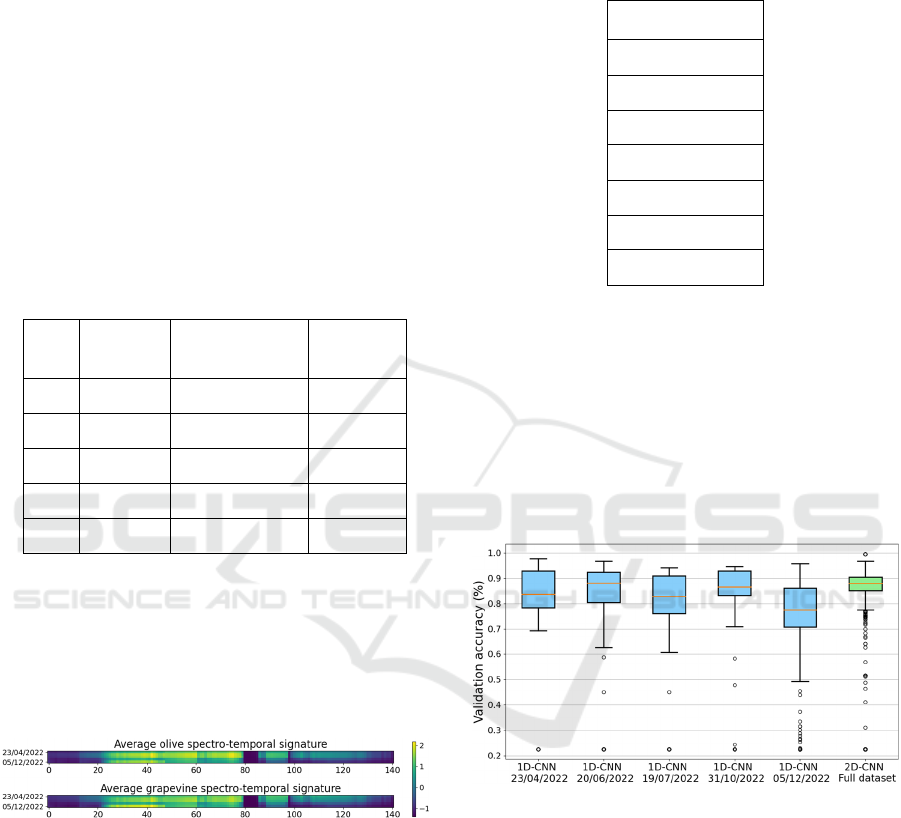
The dataset used for the actual final classification
was modeled in an original way, that is, by
representing the individual samples as single-channel
spectro-temporal images. Figure 6 shows the new
representation of the average spectral signatures of
the two crops, which also highlights the temporal
dimension (height size) of the pixels to be classified.
Figure 6: Spectro-temporal model of pixels average spectral
signatures.
The agricultural land use classification was
performed through a deep learning architecture based
on convolutional neural networks in two dimensions
(2D-CNN), in which convolutions are implemented
along spectral and temporal dimensions instead of
conventional spatial dimensions (Debella-Gilo,
2021). The main hyperparameters of the deep
learning architecture were tuned by means of a 5-fold
grid search cross-validation, however considering a
small set for the hyperparameters’ values. Table 4
shows the overall accuracy of the 2D-CNN-based
classification model on the five validation sets and the
95% confidence interval of the mean value.
Table 4: Cross-validation for 2D-CNN classification.
Single folds:
0.909091
0.961723
0.908654
0.927885
0.913462
Overall accuracy:
0.92 ± 0.02
In order to assess the effectiveness of the 2D-CNN
over the 1D-CNN, Figure 7 shows the variability of
accuracy in the grid search process, for both 2D- and
1D-CNNs, using the same hyperparameters’ grid.
Note that 1D-CNN is applied only on the spectral
dimension. In particular, the figure clearly shows that
the 2D-CNN achieves a more stable and better
accuracy, thanks to temporal information. It is worth
noting that the experiment is carried out with only
five temporal slices.
Figure 7: Variability of accuracy in the grid search process,
for each type of CNN.
4 CONCLUSIONS
In this paper, deep learning has been used with the
PRISMA satellite hyperspectral data, for the purpose
of semantic segmentation of crops. A detailed data
pipeline and a classification approach based on both
spectro-temporal data modeling and two-dimensional
convolutional neural networks are discussed and
compared with an approach based on one-
dimensional convolutional neural network.
GISTAM 2024 - 10th International Conference on Geographical Information Systems Theory, Applications and Management
192

The adopted approach, which provides promising
results, can be considered as a first step to further
investigate the same satellite data sets over a longer
period, with the final aim of monitoring the
phenological variations. Moreover, the integration
with other satellite data can be experimented in order
to improve the overall accuracy.
ACKNOWLEDGEMENTS
Work supported by the Italian Ministry of Education
and Research (MIUR) in the framework of the Project
“TEBAKA – TErritory Basic Knowledge
Acquisition” - PON “Research and Innovation” 2014-
2020.
Project carried out using ORIGINAL PRISMA
Products - © Italian Space Agency (ASI); the
Products have been delivered under an ASI License
to Use.
Work partially supported by: (i) the University of
Pisa, in the framework of the PRA 2022 101 project
“Decision Support Systems for territorial networks
for managing ecosystem services”; (ii) the European
Commission under the NextGenerationEU program,
Partenariato Esteso PNRR PE1 - "FAIR - Future
Artificial Intelligence Research" - Spoke 1 "Human-
centered AI"; (iii) the Italian Ministry of Education
and Research (MIUR) in the framework of the
FoReLab project (Departments of Excellence).
This research is supported by the Ministry of
University and Research (MUR) as part of the PON
2014-2020 “Research and Innovation” resources –
"Green/Innovation Action – DM MUR 1061/2022".
REFERENCES
Abubakar, M.A., Chanzy, A., Flamain, F., Pouget, G., and
Courault, D. Delineation of Orchard, Vineyard, and
Olive Trees Based on Phenology Metrics Derived from
Time Series of Sentinel-2. Remote Sensing. 2023;
15(9):2420, doi: 10.3390/rs15092420.
Bhosle, K., and Musande, V. (2022). “Evaluation of CNN
model by comparing with convolutional autoencoder
and deep neural network for crop classification on
hyperspectral imagery”. Geocarto International, 37(3),
813-827, doi: 10.1080/10106049.2020.1740950.
Candela, L., Formaro, R., Guarini, R., Loizzo, R., Longo F.,
and Varacalli, G. (2016), "The PRISMA mission", 2016
IEEE International Geoscience and Remote Sensing
Symposium (IGARSS), Beijing, China, 2016, pp. 253-
256, doi: 10.1109/IGARSS.2016.7729057.
Debella-Gilo M., Gjertsen A.K. (2021), “Mapping Seasonal
Agricultural Land Use Types Using Deep Learning on
Sentinel-2 Image Time Series”, Remote Sensing,
13(2):289, doi: 10.3390/rs13020289.
Dosovitskiy, A. et al. (2021). An image is worth 16x16
words: Transformers for image recognition at
scale. arXiv preprint arXiv:2010.11929, doi:
10.48550/arXiv.2010.11929.
eoPortal, Satellite Missions catalogue, PRISMA
(Hyperspectral), accessed in March 2024,
https://www.eoportal.org/satellite-missions/prisma-
hyperspectral.
Gallo, I., La Grassa, R., Landro, N., Boschetti, M. (2021).
Sentinel 2 Time Series Analysis with 3D Feature
Pyramid Network and Time Domain Class Activation
Intervals for Crop Mapping. ISPRS International
Journal of Geo-Information, 10(7):483, doi:
10.3390/ijgi10070483.
Herold, M., Latham, J. S., Di Gregorio, A., and Schmullius,
C.C. (2006). Evolving standards in land cover
characterization. Journal of Land Use Science, 1(2-4),
157-168, doi: 10.1080/17474230601079316.
Ji, S., Zhang, C., Xu, A., Shi, Y., and Duan, Y. (2018). 3D
convolutional neural networks for crop classification
with multi-temporal remote sensing images. Remote
Sensing, 10(1):75, doi: 10.3390/rs10010075.
Kussul, N., Lavreniuk, M., Skakun, S., and Shelestov, A.
(2017). "Deep Learning Classification of Land Cover
and Crop Types Using Remote Sensing Data," in IEEE
Geoscience and Remote Sensing Letters, vol. 14, no. 5,
pp. 778-782, doi: 10.1109/LGRS.2017.2681128.
Orlandi, D., Galatolo, F. A., Cimino, M. C., Pagli, C.,
Perilli, N., Pompeu, J. A., & Ruiz, I. (2023). Using deep
learning and radar backscatter for mapping river water
surface. Orbit, 20, 20.
Orlandi, D., Galatolo, F. A., Cimino, M. G., La Rosa, A.,
Pagli, C., & Perilli, N. (2022). Enhancing land
subsidence awareness via InSAR data and Deep
Transformers. In 2022 IEEE Conference on Cognitive
and Computational Aspects of Situation Management
(CogSIMA) (pp. 98-103). IEEE.
Peng, Q., Shen, R., Dong, J., Han, W., Huang, J., Ye, T.,
Zhao, W., and Yuan, W. (2023). A new method for
classifying maize by combining the phenological
information of multiple satellite-based spectral bands.
Frontiers in Environmental Science, 10, 1089007, doi:
10.3389/fenvs.2022.1089007.
Rußwurm, M., and Körner, M. (2020). Self-attention for
raw optical satellite time series classification. ISPRS
journal of photogrammetry and remote sensing, 169,
421-435, doi: 10.1016/j.isprsjprs.2020.06.006.
Sykas, D., Sdraka, M., Zografakis, D., and Papoutsis, I.
(2022). A sentinel-2 multiyear, multicountry
benchmark dataset for crop classification and
segmentation with deep learning. IEEE Journal of
Selected Topics in Applied Earth Observations and
Remote Sensing, 15, 3323-3339, doi:
10.1109/JSTARS.2022.3164771.
Tang, P., Du, P., Xia, J., Zhang, P., and Zhang, W. (2022).
Channel attention-based temporal convolutional
network for satellite image time series classification.
Semantic Segmentation of Crops via Hyperspectral PRISMA Satellite Images
193

IEEE Geoscience and Remote Sensing Letters, 19, 1-5,
doi: 10.1109/LGRS.2021.3095505.
Teimouri, N., Dyrmann, M., and Jørgensen, R. N. (2019).
A Novel Spatio-Temporal FCN-LSTM Network for
Recognizing Various Crop Types Using Multi-
Temporal Radar Images. Remote Sensing, 11(8):990,
doi: 10.3390/rs11080990.
Victor, B., Zhen, H., Aiden, N. (2022). A systematic review
of the use of Deep Learning in Satellite Imagery for
Agriculture. arXiv preprint arXiv:2210.01272, doi:
10.48550/arXiv.2210.01272.
Zhang, Y., Wang, D., and Zhou, Q. (2019). Advances in
crop fine classification based on Hyperspectral Remote
Sensing. In 2019 8th International Conference on Agro-
Geoinformatics (Agro-Geoinformatics) Istanbul,
Turkey, 2019, pp. 1-6, doi: 10.1109/Agro-
Geoinformatics.2019.8820237.
GISTAM 2024 - 10th International Conference on Geographical Information Systems Theory, Applications and Management
194
