
Data Discovery and Indexing for Semi-Structured Scientific Data
Kaushik Jagini
1
, Yifan Zhang
1
, Yichen Guo
2
, Julian Goddy
3
, Dale Stansberry
4
, Joshua Agar
3
and Jeff Heflin
1
1
Computer Science and Engineering, Lehigh University, Bethlehem, PA, U.S.A.
2
Materials Science and Engineering, Lehigh University, Bethlehem, PA, U.S.A.
3
Mechanical Engineering and Mechanics, Drexel University, Philadelphia, PA, U.S.A.
4
National Center for Computational Sciences, Oak Ridge National Laboratory, Oak Ridge, TN, U.S.A.
Keywords:
Scientific Data Discovery, Data-Centric Indexing, Federated Data, User Interface, Semi-Structured Data.
Abstract:
There is a need for powerful, user-friendly tools for scientific data management and discovery. We present an
architecture based on DataFed and Elasticsearch that allows scientists to easily share data they produce and a
novel interface that allows other scientists to easily discover data of interest. This interface supports summary-
level information about a collection of datasets that can be easily refined using schema-free search. We extend
the recent idea of cell-centric search to semi-structured data, describe the architecture of the system, present a
use case from the context of materials science, and evaluate the efficacy of the system.
1 INTRODUCTION
Scientific experiments are time-consuming and costly.
However, most data generated by researchers is stored
in file systems where the only identifiable and search-
able metadata is the file name and attributes. Funding
agencies have expanded policies requiring scientific
data to be made FAIR: Findable, Accessible, Inter-
operable, and Reproducible. However, many scien-
tists view data management as a burden with ques-
tionable scientific value, as researchers have minimal
tools to extract utility from their data. User adoption
requires the combination of simplifying the burden
and demonstrating added value.
When data is shared without tightly controlled
schema, locating relevant data can be challenging be-
cause users do not know how the data is organized
or what search terms to use. To solve this prob-
lem, we describe a solution based on cell-centric in-
dexing (Heflin et al., 2021), which was initially de-
vised for tabular data. In particular, we extend that
paradigm to semi-structured data, such as JSON or
multi-level dictionaries. JSON files encompass a mul-
titude of nested key-value pairs, extending over mul-
tiple levels. Although key-value stores and graph
databases are often suitable for storing JSON data,
they require detailed knowledge of the structure to
construct queries. This problem is exacerbated when
many heterogeneous JSON files are stored.
To support data exploration by novel users, we
propose building inverted indices using individual
data items as the fundamental unit of semi-structured
data. This approach, based on cell-centric indexing,
enables flexible, schema-optional queries.
The contributions of this paper are: (1) We extend
cell-centric indexing to the realm of semi-structured
data, allowing users to discover and retrieve data
without requiring prior knowledge of the specific keys
and values within the semi-structured dataset. (2) We
provide a comprehensive explanation of the system
architecture. (3) We apply this approach to the do-
main of materials science. We also illustrate how
a user-friendly interface design can effectively con-
tribute to accomplishing the objective. (4) We as-
sess the efficacy of indexing and querying datasets in
terms of their efficiency.
2 BACKGROUND
Several projects present novel ways to search for spe-
cific datasets or to explore a collection of datasets.
Chapman et al. (2020) provide a good review of
dataset search while Maier et al. (2014) identify sev-
eral challenges. Exploratory search requires interac-
tivity and the ability of the user to filter the informa-
tion (White and Roth, 2009). Some other examples
264
Jagini, K., Zhang, Y., Guo, Y., Goddy, J., Stansberry, D., Agar, J. and Heflin, J.
Data Discovery and Indexing for Semi-Structured Scientific Data.
DOI: 10.5220/0012706000003690
Paper published under CC license (CC BY-NC-ND 4.0)
In Proceedings of the 26th International Conference on Enterprise Information Systems (ICEIS 2024) - Volume 2, pages 264-271
ISBN: 978-989-758-692-7; ISSN: 2184-4992
Proceedings Copyright © 2024 by SCITEPRESS – Science and Technology Publications, Lda.

are He et al. (2008), Dunaiski et al. (2017) and Soto
et al. (2015).
This paper is the evolution of research that be-
gan with a user-friendly exploration interface for dis-
tributed knowledge graphs (Zhang et al., 2013). That
work combined tag clouds and faceted-browsing. Tag
clouds are a popular visualization method that con-
veys data importance or frequency through varying
font sizes. One inspiration for that work was Fan
et al. (2009), who created an interactive user interface
utilizing image clouds. Faceted browsing (Wong-
suphasawat et al., 2016) is a ubiquitous paradigm
found across the Web where users can filter the dis-
played information (e.g., a set of products in a store)
by various categories (i.e., the facets). This interface
lets users grasp their underlying query intentions and
guides the system in curating personalized image sug-
gestions.
These ideas were adapted to exploration for tab-
ular data in developing cell-centric indexing (Heflin
et al., 2021). The key idea is that individual cells of
data tables are the key items of interest, and that in-
dexing the properties of these cells enables schema-
free search. The visualization allows the user to view
summary histograms about the entire data collection;
these histograms are organized by properties such as
dataset title, column name, data value, and row con-
text. Like faceted browsing, the histograms are re-
computed as users specialize their queries, allowing
patterns and anomalies to be discovered. To support
the generation of the histograms, each cell is indexed
in Elasticsearch using multiple fields. The underly-
ing algorithms for computing the histograms rely on
the notion of a conditional frequency vector (CFV)
(Heflin et al., 2021). Each CFV summarizes the re-
sults of a query by providing a list of term/frequency
pairs that describe the matches. This paper extends
the concept of cell-centric indexing to semi-structured
formats such as JSON, and applies the results to ma-
terials science as an exemplar.
Discovering new materials that underpin current
and future technologies requires the ability to mine
scientific databases. There has been work to organize
this data via knowledge graphs and ontologies (Mc-
Cusker et al., 2020), but such work requires data
providers to “buy in” to the ontology. CRUX (Wang
et al., 2022) is a crowd-sourced repository of materi-
als science workflows but uses keyword-based search,
requiring users to be familiar with the system’s ontol-
ogy.
Materials science experiments often collect im-
ages via electron microscopy, but there is no common
database for storing these images. One complication
is that these experiments use collections of highly cus-
tomized systems that are rarely integrated or digitized.
3 DATA-CENTRIC INDEXING OF
SEMI-STRUCTURED DATA
Semi-structured data is data that does not have a fixed
schema, but instead schema information is embedded
in the data. Typically, this data will have a tree struc-
ture. Thus, we can represent the data as a graph with
two types of nodes: the complex nodes V
c
and the
atomic nodes V
a
. Complex nodes are internal nodes,
while atomic nodes are leaves that have values from
a set D. Formally, the data is a graph G = (V, E, r, v)
with nodes V = V
c
∪V
a
, edges E, a root r ∈ V , and
a function v: V
a
→ D that assigns values to atomic
nodes. Each edge is a tuple e ∈ V
C
× A ×V , where A
is the set of attribute names. This general model can
be used to describe the most common forms of semi-
structured data: JSON and XML. For example, JSON
consists of sequences of key-value pairs, where the
values themselves can also be such sequences. In our
abstract model, JSON keys are the attribute names,
and each atomic value is associated with a node from
V
a
. We will consider each tree (typically one per file)
to be a distinct dataset.
Compared to cell-centric indexing, the complex
nodes provide schema information, while the atomic
nodes contain data values. Thus, we need to index
each node n ∈ V
a
. A na
¨
ıve approach would simply
use the more specific attribute of each value when
indexing, but this would lose all structural informa-
tion conveyed by the nesting. Unlike tabular data, the
schema information of V
a
is not a column name, but
instead the sequence of attribute labels for the path
from the root r to n. One could concatenate this se-
quence to form a virtual schema entity, but there is no
way to distinguish between a specific attribute label
and its context. Another issue is that, unlike tabular
data, there is no row; instead, a node can have sib-
lings, and these siblings can have different attributes
and values.
In the rest of the paper, we use the following func-
tions as shorthand for referencing different parts of
the tree: Given an edge e = (n
1
, a, n
2
), src(e) = n
1
is
the source of the edge, att(e) = a is the attribute of
the edge, and dest(e) = n
2
is the destination of the
edge. Additionally, path(n) is the sequence of edges
(e
1
, e
2
, ..., e
k
) along the path from the root r to node
n, out(n) = {e | src(e) = n} is the set of edges with n
as a source, sib(n) is the set of nodes that share a par-
ent with n (i.e., if the edge to n is (p, a, n), then sib(n)
is the set of all nodes n
i
with an edge (p, a
i
, n
i
)), and
anc(n) is the set of nodes connected by the edges in
Data Discovery and Indexing for Semi-Structured Scientific Data
265

path(n), excluding n itself.
Like cell-centric indexing, each atomic node is in-
dexed concerning several fields. These fields are sum-
marized in Table 1. Note, the Type and Anaylzer
columns of the table will be explained in Sec-
tion 4.2.1. The value field is the content of the atomic
node n. The attribute field is the last attribute name
on the path to n. The pathname is all other attribute
names along this path. The sibling context is the set
of values for all siblings of n. The path context is the
set of values for all siblings of ancestors of n.
Algorithm 1 illustrates how to index a single node.
IndxSS() is a recursive algorithm that performs a
depth-first traversal of the tree. It is initially called
with the root r, an empty string a, and empty sets
path and pathcon. First, we collect all of the atomic
node siblings in a set, and then collect all of the val-
ues of these sibling nodes (lines 2-3). If the cur-
rent node n is an atomic node, then we index sev-
eral fields with the appropriate values as determined
by Table 1 (lines 4-9). The signature of Index is
Index( f ield, doc, content). We stress that a core idea
of our approach is that the “document” is a data
item, in this case, an atomic node n from the semi-
structured document. Many values (i.e., those for
fields attribute, pathname, path
context) are
provided as parameters as determined by the parent
node. If the node is complex, we collect the outgo-
ing edges, create a new path
0
by adding a to the set
path, and create a new pathcon
0
by adding sibcon to
pathcon. We then make a recursive call for each edge
(lines 14- 15). Note, for brevity, we have excluded
trivial elements of the algorithm, such as the indexing
of the title field.
Algorithm 1: How to index a node.
1: procedure INDXSS(n, a, path, pathcon)
2: sibs ← sib(n) ∩V
a
3: sibcon ←
S
i
v(sibs
i
)
4: if n ∈ V
a
then
5: INDEX(value, n, v(n))
6: INDEX(attribute, n, a)
7: INDEX(pathname, n, path)
8: INDEX(sibling context, n, sibcon)
9: INDEX(path context, n, pathcon)
10: else
11: edges ← out(n)
12: path
0
← path ∪ a
13: pathcon
0
← pathcon ∪ sibcon
14: for e in edges do
15: INDXSS(dest(e), att(e), path
0
, pathcon
0
)
16: end for
17: end if
18: end procedure
4 SYSTEM ARCHITECTURE
There are three subsystems: Data Pre-Processing,
Data Indexing and Retrieval, and a GUI for Data Dis-
covery.
4.1 Data Pre-Processing
First, we upload relevant data in DataFed (Stansberry
et al., 2019), a specialized platform designed for man-
aging and organizing research data. DataFed provides
a distributed scientific data management platform that
is federated, scalable, and flexible for science, with
elaborate administrative and access controls. DataFed
repositories can be established at any institution but
rely on a centrally managed metadata server. Meta-
data schemas can be designed using flexible JSON
notation, and thus, DataFed is not restricted to spe-
cific scientific disciplines. Interaction with DataFed
is possible through a command line interface, Python
API, or a fully functional web interface.
Subsequently, JSON files are extracted from
DataFed and processed according to Algorithm 1.
The indexing calls are made to an Elasticsearch
server, which is described in the next section.
Domain-specific transformations can be applied here.
4.2 Data Indexing and Retrieval
The fundamental component of our system revolves
around an Elasticsearch server, which serves as a scal-
able and distributed search engine with advanced ana-
lytical capabilities. The primary objectives of our sys-
tem are: 1) Processing collections of datasets by ex-
tracting relevant information and organizing it into a
set of data-centric fields. As field/value pairs are iden-
tified, they are sent to Elasticsearch through appropri-
ate API calls. Elasticsearch builds the index, enabling
efficient storage and retrieval. 2) Responding to user
queries by executing a sequence of queries to Elastic-
search and generating specialized histograms called
CFVs, for each field. These histograms provide a
concise summary of the data distribution within each
field.
4.2.1 Indexing
It is common for search engines to create an inverted
index for each of several fields, such as a title field and
a content field. A query can target a specific field, or
the document rankings might depend on which field
a match occurred in. Fields can have different types
and might be parsed into tokens differently. This in-
formation is provided by a mapping within the Elas-
ticsearch framework. In our project, each data value
ICEIS 2024 - 26th International Conference on Enterprise Information Systems
266

Table 1: Fields for indexing Semi-Structured Data.
Field Definition Type Analyzer
value v(n) text
numeric
whitespace stop analyzer
NA
attribute att(e
k
) where path(n) = (e
1
, e
2
, ..., e
k
) text wordDelimiter
pathname {att(e
i
) | path(n) = (e
1
, e
2
, ..., e
k
) and 1 ≤ i < e
k
} text wordDelimiter
sibling context {v(s) | s ∈ sib(n)} text stop
path context {v(u) | a ∈ anc(n) and u ∈ sib(a)} text stop
title The name of the containing dataset text stop
serves as a document, and it is important that our in-
dex incorporates fields that accurately describe these
data values. The last two columns of Table 1 describe
the field type and the analyzer used to parse input.
We utilize three distinct field types: text, key-
word, and double. Text fields undergo tokenization
and are subject to word analyzers for processing. On
the other hand, keyword fields are indexed in their
original form without undergoing tokenization or ad-
ditional processing steps.
Our system includes a few implementation-
specific fields. While most of our fields are text fields,
there are a few additional keyword fields: fullTitle
allows users to access and view the complete name
of the dataset in the search results and datafedId is
used for provenance and to retrieve the raw data from
DataFed.
It is important to note that we use two different
fields to store different types of values: value and val-
ueNumeric. The valueNumeric field is designated as
a double field. This enables storing integer and real
numeric values within this field. As discussed later,
histograms with dynamically calculated buckets are
created whenever numeric values appear in a query.
An analyzer is essential for properly handling text
fields, as it determines the tokenization process and
any additional processing requirements. In our sys-
tem, we employ the stop analyzer for most text fields.
This analyzer segments text by separating it at every
non-letter character (e.g., whitespace, numbers, sym-
bols, etc.) and eliminates 33 commonly occurring
stop words, such as “a,” “the,” “to,” and others.
However, for the attribute and pathname fields,
we utilize the wordDelimiter analyzer instead. This
analyzer, in addition to separating text into special
characters, also recognizes transitions in letter case.
For instance, a term like “crystalStructure” would be
tokenized into “crystal” and “structure”, taking into
account the change in case. It is important to note
that the wordDelimiter analyzer does not remove stop
words from the analyzed text. For the value field, we
used the whitespace stop analyzer, which is a varia-
tion of the stop analyzer that only considers whites-
pace as a token separator. Similar to the stop ana-
lyzer, it removes stop words from the text. However, it
does not separate strings that contain numbers or sym-
bols. Thus, a chemical composition value like “Li1
V2 Cr1 O6” will be parsed into four tokens, “Li1,”
“V2,” “Cr1,” and “O6,” instead of eight tokens, four
of which are numbers.
4.2.2 Handling Tensors
Scientific data often includes tensors, which are ob-
jects consisting of multi-dimensional numeric data.
Given our emphasis on scientific data, we include spe-
cial processing for tensors. In JSON, a tensor is en-
coded as a multi-dimensional array of numbers. Our
interface (see Section 5) uses a distinctive notation:
(α)i, j to identify specific elements of relevant ten-
sors. Here, α stands for an unspecified tensor, while
the pathname field can be used to determine the con-
text of the tensor. However, the wordDelimiter ana-
lyzer is useful for most attribute names and will au-
tomatically separate numeric tokens from text strings.
Therefore, our system must use an internal represen-
tation for the attribute name that does not include
numbers or symbols. Our solution is to replace each
number with a corresponding letter, resulting in a pat-
tern “row” + let ter(i) + “col” + letter( j) for a given
tensor element. This results in attribute names such
as rowbcolc to signify the positions of these values
based on their row and column placements. When we
display these tokens to users, we translate the codes
into a more human-readable form. So, the code rowb-
colc becomes (α)2, 3, which makes it easier for users
to see and understand how the different elements of
relevant tensors relate to other data. When parsing
semi-structured files, our algorithm assumes that any
data that is a list of lists containing only numbers is a
tensor, and assigns each element a field name as de-
scribed above.
4.2.3 Query Processor
The query processor takes user queries and generates
CFVs that can be displayed as histograms. It sub-
mits textual aggregation requests to the Elasticsearch
server and packages the response to provide search re-
sults to the GUI. The process details are described in
Heflin et al. (2021).
Data Discovery and Indexing for Semi-Structured Scientific Data
267

When working with numeric data, histograms of
distinct values are rarely useful. Unlike textual terms,
numeric terms exhibit a greater variability. For ex-
ample, “135”, “135.0” and “1.35E+2” are all equiva-
lent, while some users might consider “135.0001” to
be close enough. To address this, we create ranges
over numeric values. Elasticsearch supports a his-
togram aggregation which can be used to build these
distributions. However, a dynamic system for data ex-
ploration cannot predefine numeric ranges to serve as
buckets for all possible data and queries. Our sys-
tem dynamically creates buckets that are useful for
any collection of numeric values that match the search
criteria. The algorithm evaluated in this paper builds
5 buckets with sizes dictated by the distribution of the
data. Once the numeric range CFV is created, this
is merged with the token value CFV (Heflin et al.,
2021).
4.3 GUI for Data Discovery
We have designed a GUI that enables users with the
means to discover and interact with the data, even if
they have no knowledge of the underlying schema.
Specific interface examples can be found in Section 5.
Our interface is web-based, and thus based on
HTML (Hypertext Markup Language) and CSS (Cas-
cading Style Sheets). Interactivity is accomplished
through a combination of JavaScript and TypeScript.
We use Google Charts to generate and display his-
tograms that convey information about the distribu-
tion of data that matches the user’s query through in-
teractive visualizations.
5 INTERFACE DESIGN
We developed an easy-to-use interface that allows
users to seamlessly navigate through the semi-
structured data efficiently. Throughout this section,
we will demonstrate the concepts for applications in
materials science.
The Materials Project database
1
contains more
than 150,000 materials whose structure and proper-
ties have been predicted using density functional the-
ory (DFT) simulations. From the simulations, de-
tailed information regarding the structural and func-
tional properties can be obtained. Similarly, func-
tional properties of materials, such as phonon struc-
ture, electronic structure, band gap, and magnetic
properties, can be predicted. This resource can be
used to discover materials with unique combinations
1
https://next-gen.materialsproject.org/
of properties. A common exploration might involve
a multiparameter search that considers the chemistry,
crystallographic structure, electrical conductivity, and
piezoelectric tensor
2
. An exploratory search can ex-
pose specific chemistries, crystal structures, and as-
sociated properties that enable the achievement of
application-specific figures of merit. Here, we use
data-centric indexing of semistructured data scraped
from the Materials Project and loaded into DataFed to
demonstrate the discovery process of new functional
materials.
The interface consists of seven interactive his-
tograms, thus summarizing the data collection (or a
subset of it) in a graphical form. Initially, two his-
tograms, the Title Histogram and the Path Name his-
togram, are pre-loaded. These two histograms are
most likely to define the context for the user’s search;
to diversify the users’ choices, we also show twice as
many values to serve as initial terms for the search.
For example, our Title histogram will show that the
Materials Project has data about different crystal sym-
metries, with Orthrombic being the most represented,
and Monoclinic the second-most represented. Like-
wise, the path name histogram, will contain attributes
about symmetry, substrates, and structure, to name a
few.
To observe the full set of histograms, the user must
select a value from one of the initial histograms. For
example, if the user clicks on Hexagonal in the Ti-
tle histogram, that term is added to the query, and
new histograms are generated to show what terms co-
occur with it. The user can continue to refine the
query by clicking on additional terms from any his-
togram. Figure 1 shows the path name, attribute, and
value histograms after the user has additionally cho-
sen the attribute “density”
3
. We can see that piezo-
electric is the most common path name component
found in datasets that match the query. As shown in
the Attribute Histogram, these datasets have attribute
names containing terms such as density, atomic, ionic,
and electronic. These two histograms provide infor-
mation about JSON keys in the indexed data. Users
can click on any of these bars to refine their queries.
To support expert users, the tool also has a feature
where users can select an index field (such as those
found in Table 1) and type in a query term.
Recall from Section 4.2.3, that our system dy-
namically create ranges for summarizing numeric
values. These values are displayed as a range as
2
Piezoelectric materials exhibit a linear coupling be-
tween the voltage and strain that can be used in energy con-
version and sensing applications.
3
Due to limited space, we do not show the other his-
tograms.
ICEIS 2024 - 26th International Conference on Enterprise Information Systems
268
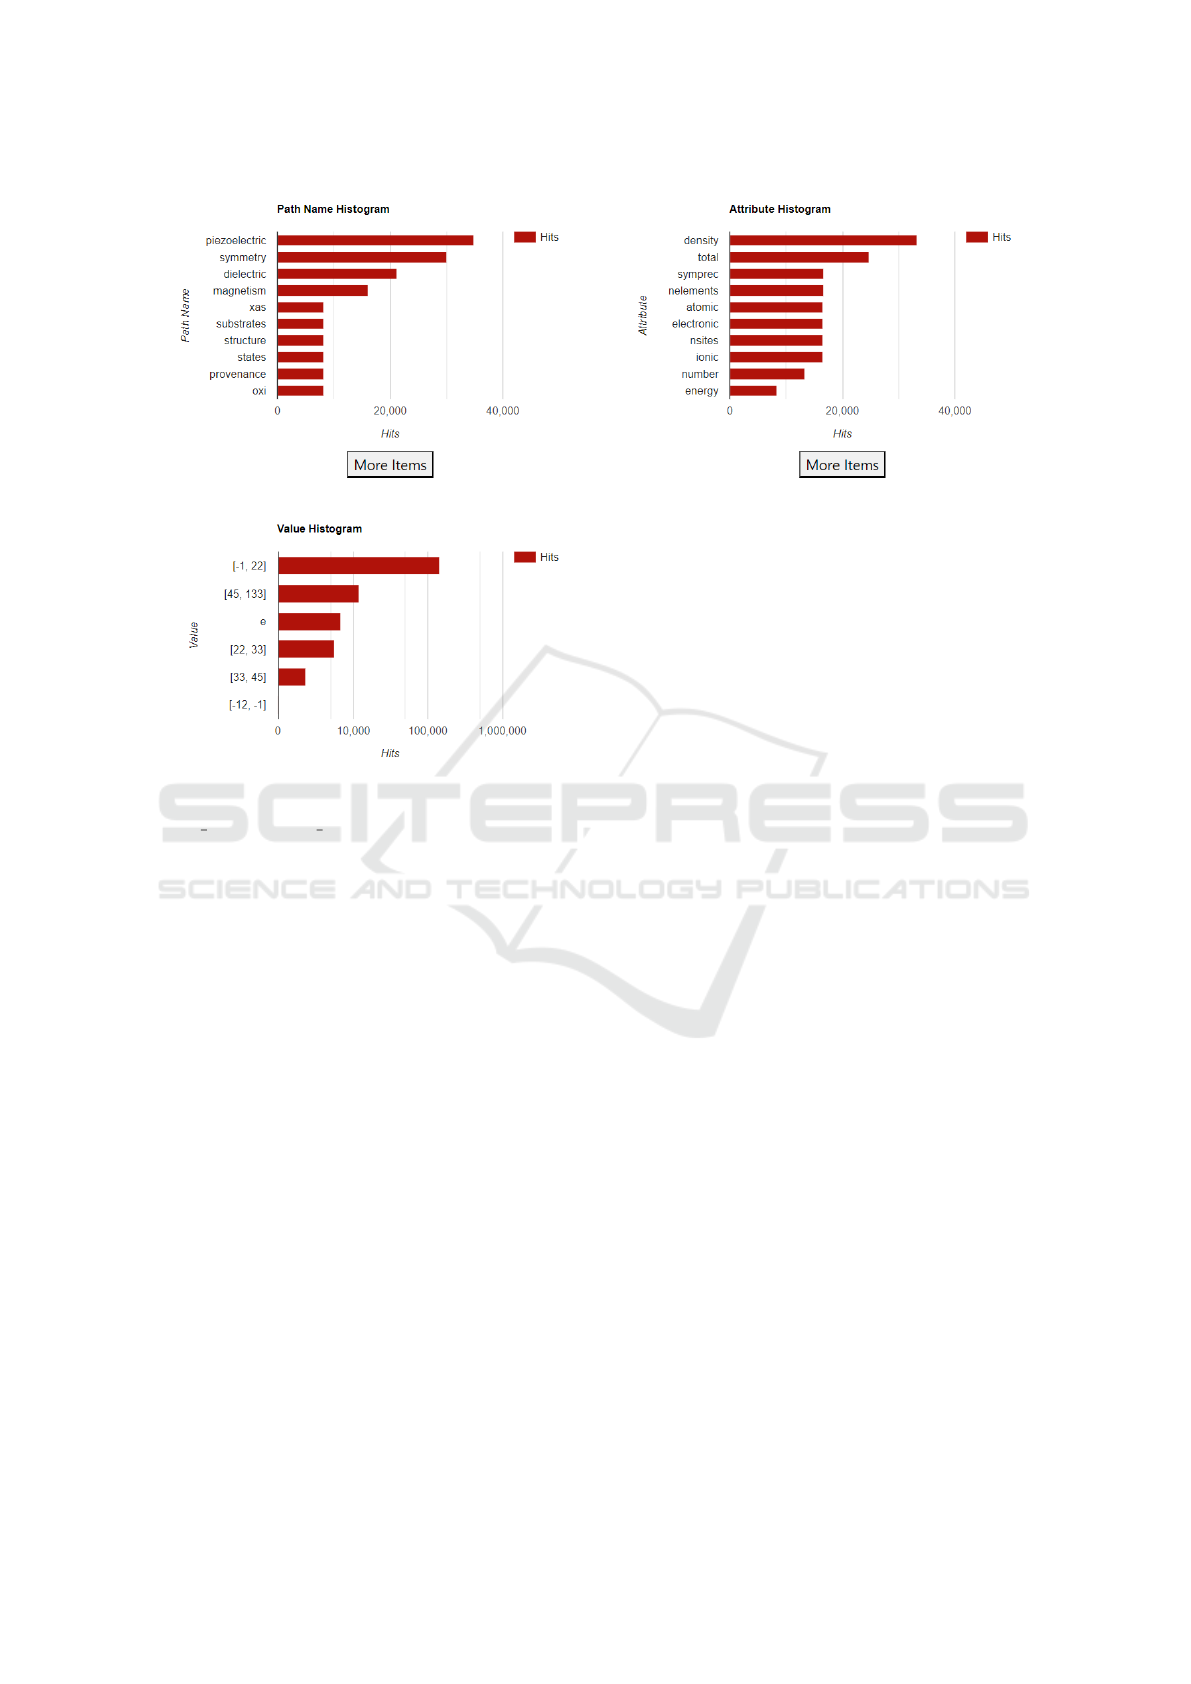
Figure 1: Path Name, Attribute, and Value Histograms after selecting title:“Hexagonal” and attribute:“density”.
[lower bound, upper bound]. Since the buckets ag-
gregate values across all matching data items, they
are not limited to values from any particular at-
tribute/JSON key. Thus, by selecting a range of in-
terest, the user will get context (such as path name,
field name, and data set title) about where these data
values are found. The Value histogram in Figure 1
shows several such ranges. We can see the count of
these numerical ranges when we hover over the par-
ticular value. Additionally, clicking on a range will
refine it by creating additional sub-buckets. One use
of this is to look for outlier values and to identify pat-
terns that lead to outliers. This feature is most useful
after users have identified an attribute or path name of
interest, but we emphasize that the generality of our
system allows them to consider many different related
attributes simultaneously.
As mentioned in Section 4.2.2, scientific data is
often expressed as tensors. Our system automati-
cally recognizes tensors and applies special indexing
so that users can drill down to a particular element
irrespective of the number of rows or columns. The
fields for these values are prefixed with (α), repre-
senting a generic tensor, and any particular value can
be accessed in the form of (α)row, column. For ex-
ample, if we have 3 rows and 4 columns, there will
be 12 distinct entries in the attribute histogram. The
entry for the third row and second column will be ref-
erenced as (α)3, 2.
When the user clicks any tensor element, based on
the previously described process of numerical buck-
ets, the values of these tensors are automatically buck-
eted. Alternatively, a user could select a value range,
and see which tensor elements have values in that
range.
With each query, a full title histogram is con-
structed and displayed at the bottom of the screen.
This summarizes which datasets/files contain the
most values matching the user’s query. Hovering on
the bars of these histograms displays additional data
like the DataFed id, etc.
Finally, once we identify the particular file we are
interested in, to further explore it in its original form,
its corresponding JSON file is retrieved from DataFed
and is displayed using a JSON viewer in a separate tab
by passing the corresponding DataFed id as the input
parameter.
6 PERFORMANCE EVALUATION
We conducted experiments to evaluate the system’s
performance in terms of indexing scalability and
query execution time. The experiments primarily fo-
Data Discovery and Indexing for Semi-Structured Scientific Data
269
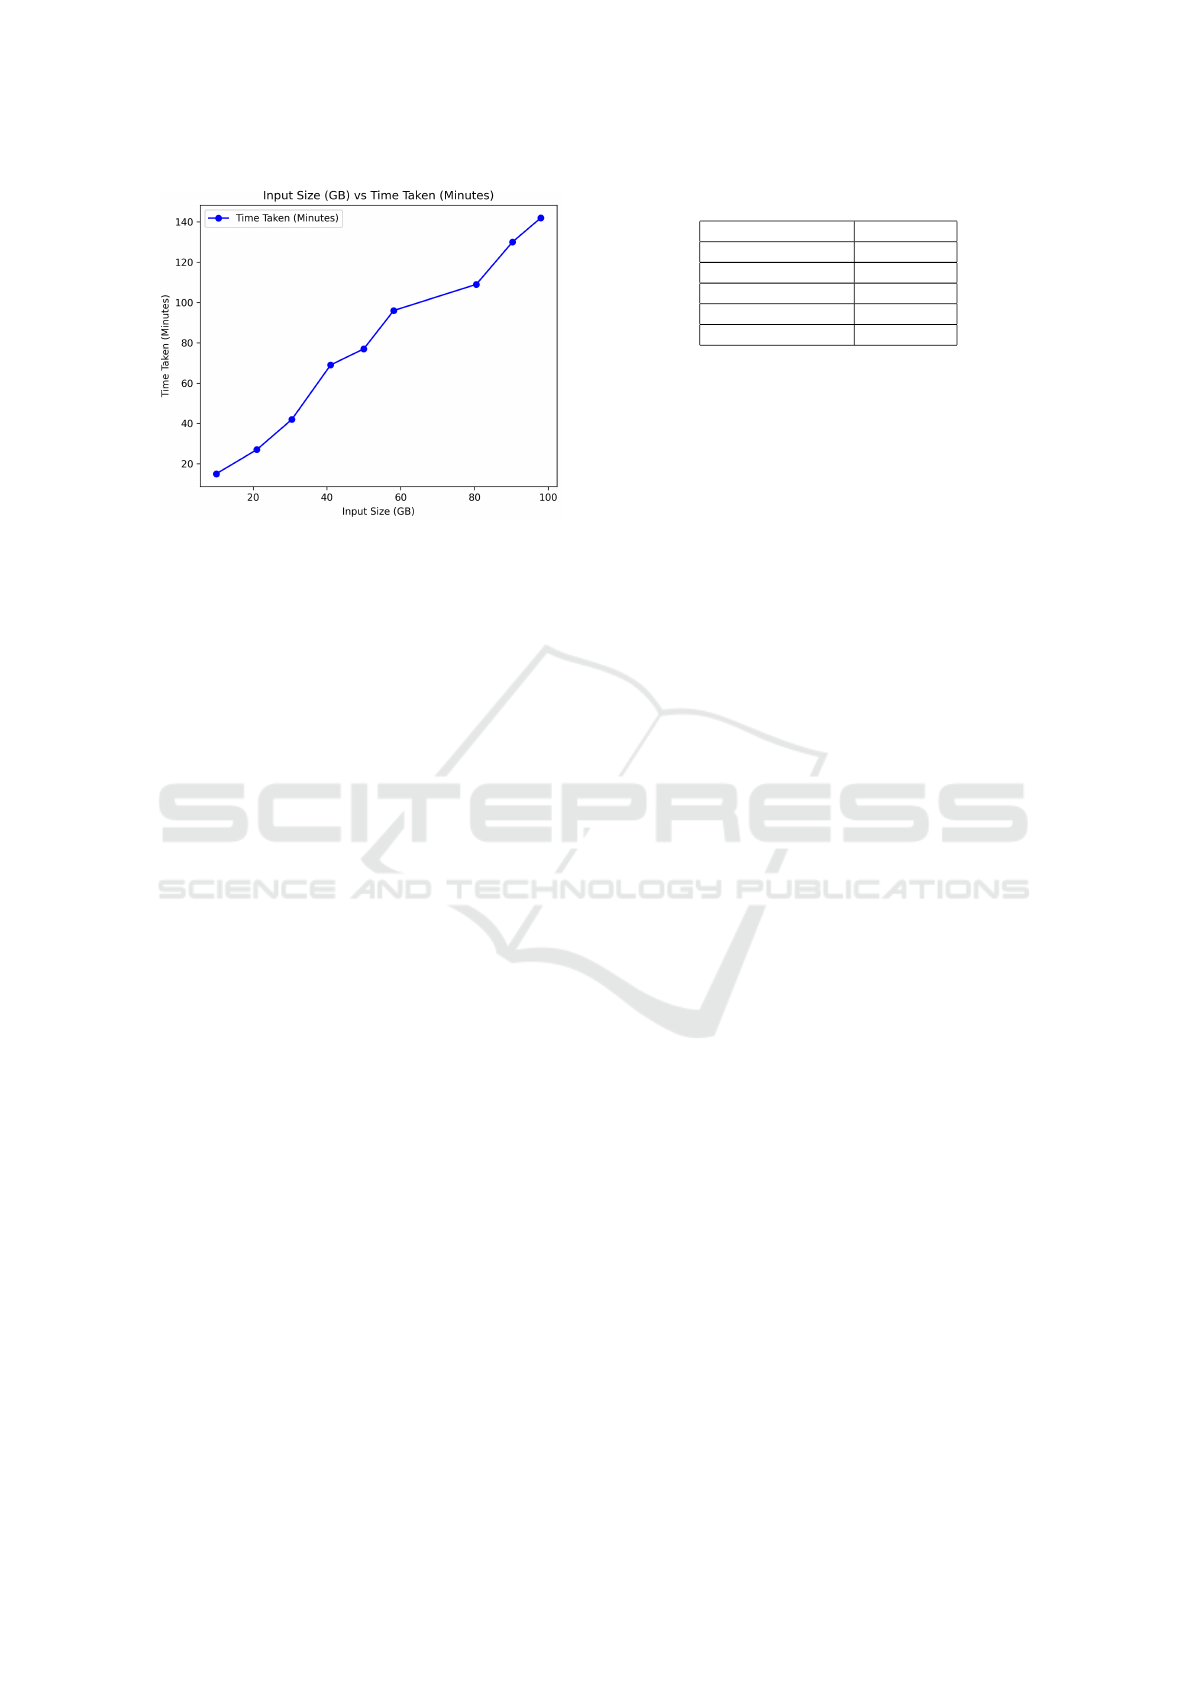
Figure 2: Time to index for different sizes of inputs.
cused on utilizing data from the Materials Project,
comprising a collection of 10,000 semi-structured
JSON files. Characterized by the properties of trees,
these files have an average depth of 4 and a maxi-
mum branching factor of 77 (at the first level). All of
our experiments are conducted using a Lehigh-hosted
server. The server has one Intel(R) Xeon(R) Silver
4110 CPU @ 2.10GHz, with 8 cores (16 threads) and
a total of 96GB RAM. It runs Java 11.0.7 and Elastic-
search 6.8.8.
The entire collection of files was loaded in
batches, with each subsequent batch increasing in
size. The indexing process was conducted for differ-
ent percentages (20%, 40%, 60%, 80%, and 100%)
of the 10,000 semi-structured JSON files comprising
nearly 100GB of data. Overall, there exists a linear
relationship between size and load time, as shown in
Figure 2. It took 143 minutes to index the entire col-
lection.
Indexing individual data items can use significant
disk space. Therefore, we also measured the size of
the resulting index in proportion to the original JSON
files. Again, the relationship is essentially linear (not
shown due to space limitations). On average, the
indexed file is ≈ 36% of the input size. We note,
however, that this relationship depends heavily on the
structure and content of the indexed files.
To measure query execution time, we had to gen-
erate a workload of realistic test queries. Note that
simply choosing a set of random query terms will of-
ten lead to queries with no results. Such queries are
usually executed quickly and will lead to an overly
optimistic evaluation. Given that our system uses in-
cremental query construction, it is also important that
the queries follow plausible paths. Hence, we gener-
ated queries utilizing the available materials science
data. The queries were formulated in five distinct
steps, starting with a single query search term (con-
Table 2: Query Execution Time as Query Length Increases.
Search Terms (#) Time (sec)
1 1.19
2 1.48
3 0.40
4 0.23
5 0.29
sisting of a pair of fields and terms) in the first step,
followed by adding a second query search term in
the second step, and so forth, until reaching the fifth
step with five query search terms. Since our inter-
face restricts the initial query to terms from the title
histogram and path name histogram, our query gener-
ation places a similar restriction on the first step. Sub-
sequently, the second, third, fourth, and fifth queries,
as outlined, will be derived from the subset of data
that already satisfies the condition established by the
first selected search term. This is done to ensure non-
null results. In each combination, a total of 10,000
queries were generated, resulting in an aggregate of
50,000 queries that were generated to capture and an-
alyze query execution time.
To evaluate query execution time, we executed
these 50,000 queries on the full index of 10,000 files
(∼18GB in size). The average query times, grouped
by the number of search terms, are shown in Table
2. Generally, query time decreases as the number of
search terms increases. Since the query is conjunc-
tive, adding more terms makes it more selective, and
the system can create histograms over fewer results
more quickly. Although the average for one and two
search terms was above 1 second, only 0.0015% of
all queries took 1 second or more. This means there
were a few outliers that impacted the average. Upon
investigating the reasons for the outlier queries, it was
observed that the increase in time is directly propor-
tional to the count of matched cells in our database.
In particular, there was an increase of 85% in matched
cell count that resulted in the increase of time by 82%.
This occurred for a few very common query terms, es-
pecially for widespread crystal systems such as “Or-
thogonal”. Usually, such queries like crystal systems
will be part of the broader filter and hence end up be-
ing in first or second query search terms. Hence, the
average query time for one search term and two search
terms is approximately 3.5x more compared to the re-
maining search terms. One possible solution to han-
dle such outlier queries is to use a caching mechanism
for such popular queries.
ICEIS 2024 - 26th International Conference on Enterprise Information Systems
270

7 CONCLUSION
In this paper, we present a novel approach to explor-
ing collections of semi-structured data by extending
the cell-centric indexing approach. We emphasize the
importance of a user-friendly interface in achieving
the overarching objective of data exploration and re-
trieval tasks. Our solution takes about just over an
hour to index 40 GB of semi-structured data. Over
99% of the queries are executed in under one second.
Our work not only empowers researchers to effort-
lessly access and retrieve data without prior knowl-
edge of its organization but also highlights its appli-
cability in material science.
Our short-term plans include incorporating our
system into the experimental pipeline of a small num-
ber of materials scientists. We will collect feedback
via surveys and think-aloud studies, adjust the sys-
tem as necessary, and expand the user group. A
key step is explicitly incorporating images, espe-
cially microscopy. Recently, Nguyen et al. (2021)
demonstrated the capabilities of a symmetry-aware
neural network featurization in exploring large un-
structured databases of microscopy images. We in-
tend to explore ways to use image embeddings as
additional criteria for refining searches, while main-
taining the performance we achieved by using Elas-
ticsearch as our backend indexing system. By in-
tegrating database management, ontology develop-
ment, and machine learning, we aim to enable effi-
cient metadata searches and facilitate the comparison
of physics-aware features within microscopy images.
This initiative holds the promise of accelerating the
exploration of synthesis-structure-property relation-
ships to advance materials design. Although our em-
phasis has been on scientific data management, these
approaches are general enough to be applied to any
enterprise that has a data lake of semi-structured data.
ACKNOWLEDGEMENTS
This material is based upon work supported
by the National Science Foundation under Grant
No. 2246463
REFERENCES
Chapman, A., Simperl, E., Koesten, L., Konstantinidis,
G., Ib
´
a
˜
nez, L.-D., Kacprzak, E., and Groth, P. (2020).
Dataset search: a survey. The VLDB Journal, 29(1):251–
272.
Dunaiski, M., Greene, G. J., and Fischer, B. (2017). Ex-
ploratory search of academic publication and citation
data using interactive tag cloud visualizations. Sciento-
metrics, 110(3):1539–1571.
Fan, J., Keim, D., Gao, Y., Luo, H., and Li, Z. (2009).
Justclick: Personalized image recommendation via ex-
ploratory search from large-scale flickr images. Circuits
and Systems for Video Tech., IEEE Trans., 19:273 – 288.
He, D., Brusilovsky, P., Ahn, J., Grady, J., Farzan, R.,
Peng, Y., Yang, Y., and Rogati, M. (2008). An evalua-
tion of adaptive filtering in the context of realistic task-
based information exploration. Inf. Process. Manage.,
44(2):511–533.
Heflin, J., Davison, B. D., and Jia, H. (2021). Exploring
datasets via cell-centric indexing. In DESIRES 2021,
CEUR Workshop Proceedings, volume 2950.
Maier, D., Megler, V. M., and Tufte, K. (2014). Challenges
for dataset search. In Int’l. Conf. on Database Systems
for Advanced Applications, pages 1–15. Springer.
McCusker, J. P., Keshan, N., Rashid, S. M., Deagen,
M., Brinson, L. C., and McGuinness, D. L. (2020).
Nanomine: A knowledge graph for nanocomposite ma-
terials science. In 19th Int’l Semantic Web Conference,
volume 12507 of LNCS, pages 144–159. Springer.
Nguyen, T. N. M., Guo, Y., Qin, S., Frew, K. S., Xu, R.,
and Agar, J. C. (2021). Symmetry-aware recursive im-
age similarity exploration for materials microscopy. npj
computational materials, 7(1):1–14.
Soto, A. J., Kiros, R., Ke
ˇ
selj, V., and Milios, E. (2015). Ex-
ploratory visual analysis and interactive pattern extrac-
tion from semi-structured data. ACM Trans. Interact. In-
tell. Syst., 5(3).
Stansberry, D., Somnath, S., Breet, J., Shutt, G., and
Shankar, M. (2019). DataFed: Towards reproducible
research via federated data management. In 2019 Int’l
Conf. on Comp. Science and Comp. Intelligence (CSCI),
pages 1312–1317.
Wang, M., Ma, H., Daundkar, A., Guan, S., Bian, Y., Se-
hirlioglu, A., and Wu, Y. (2022). CRUX: crowdsourced
materials science resource and workflow exploration. In
Proc. of the 31st ACM Int’l Conf. on Info. & Knowledge
Mgmt., pages 5014–5018. ACM.
White, R. W. and Roth, R. A. (2009). Exploratory Search:
Beyond the Query-Response Paradigm. Synthesis Lec-
tures on Information Concepts, Retrieval, and Services.
Morgan & Claypool Publishers.
Wongsuphasawat, K., Moritz, D., Anand, A., Mackinlay, J.,
Howe, B., and Heer, J. (2016). Voyager: Exploratory
analysis via faceted browsing of visualization recom-
mendations. IEEE Transactions on Visualization and
Computer Graphics, 22(1):649–658.
Zhang, X., Song, D., Priya, S., and Heflin, J. (2013). In-
frastructure for efficient exploration of large scale linked
data via contextual tag clouds. In International Semantic
Web Conference, pages 687–702. Springer.
Data Discovery and Indexing for Semi-Structured Scientific Data
271
