
Glaucoma Detection Using Transfer Learning with the Faster R-CNN
Model and a ResNet-50-FPN Backbone
Noirane Getirana de S
´
a
a
, Daniel Oliveira Dantas
b
and Gilton Jos
´
e Ferreira da Silva
c
Departamento de Computac¸
˜
ao, Universidade Federal de Sergipe, S
˜
ao Crist
´
ov
˜
ao, SE, Brazil
Keywords:
Ophtalmology, Diagnosis, Machine Learning, Deep Learning, Region-Based.
Abstract:
Early detection of glaucoma has the potential to prevent vision loss. The application of artificial intelligence
can enhance the cost-effectiveness of glaucoma detection by reducing the need for manual intervention. Glau-
coma is the second leading cause of blindness and, due to its asymptomatic nature until advanced stages,
diagnosis is often delayed. Having a general understanding of the disease’s pathophysiology, diagnosis, and
treatment can assist primary care physicians in referring high-risk patients for comprehensive ophthalmo-
logic examinations and actively participating in the care of individuals affected by this condition. This article
describes a method for glaucoma detection with the Faster R-CNN model and a ResNet-50-FPN backbone.
Our experiments demonstrated greater accuracy compared to models such as, AlexNet, VGG-11, VGG-16,
VGG-19, GoogleNet-V1, ResNet-18, ResNet-50, ResNet-101 and ResNet-152.
1 INTRODUCTION
The eye is an important organ of the human body. The
blindness is considered one of the most impactful dis-
abilities on individuals lives (Aljazaeri et al., 2020).
The significant prevalence of foreseeable blindness
cases poses a global health challenge. Cataracts, un-
corrected refractive errors, and glaucoma are identi-
fied as the primary causes of blindness (Furtado et al.,
2012). Early detection of glaucoma is crucial for pre-
venting visual impairment, and detection for this dis-
ease can have a significant impact on the general pop-
ulation.
The task of glaucoma detection has gained consid-
erable attention in the field of computerized medical
image analysis in recent years (Shibata et al., 2018).
Glaucoma is a chronic eye condition that causes per-
manent vision loss (Fu et al., 2018). Given that there
is no cure for the disease, it becomes crucial to timely
identify and diagnose it (Chai et al., 2018). Glaucoma
affects more than 70 million people worldwide with
approximately 10% being bilaterally blind (Quigley
and Broman, 2006).
The estimates indicate that the global number
of individuals affected by glaucoma will increase to
a
https://orcid.org/0009-0006-6767-292X
b
https://orcid.org/0000-0002-0142-891X
c
https://orcid.org/0000-0002-2281-9426
111.8 million by the year 2040, with a dispropor-
tionately higher incidence in regions of Asia and
Africa (Tham et al., 2014). Technological advance-
ments have been made in the application of artifi-
cial intelligence techniques to assist in the detection
and diagnosis of glaucoma. Machine learning algo-
rithms and convolutional neural networks have been
employed to analyze eye fundus images, identifying
characteristic glaucoma-related changes and aiding in
patient screening.
Glaucoma is primarily a neuropathy, not a
retinopathy, and it affects the retina by damaging gan-
glion cells and their axons (Abr
`
amoff et al., 2010). A
characteristic feature of glaucoma is the development
of a cupped area in the optic disc, which is the visible
part of the optic nerve head in its three-dimensional
structure. The ratio between the cupped area of the
optic disc and the surface area of the neuroretinal rim
serves as an important indicator to assess the presence
and progression of glaucoma.
In this study, a glaucoma detection system was de-
veloped for ophthalmic images using the Faster R-
CNN model with a ResNet-50-FPN (feature pyra-
mid network) backbone, trained on the Common Ob-
jects in Context (COCO) dataset. Our experiments
produced superior accuracy when compared to pre-
trained networks such as AlexNet, VGG-11, VGG-
16, VGG-19, GoogleNet-V1, ResNet-18, ResNet-50,
ResNet-101, and ResNet-152, as referenced in prior
Getirana de Sá, N., Dantas, D. and Ferreira da Silva, G.
Glaucoma Detection Using Transfer Learning with the Faster R-CNN Model and a ResNet-50-FPN Backbone.
DOI: 10.5220/0012706500003690
Paper published under CC license (CC BY-NC-ND 4.0)
In Proceedings of the 26th International Conference on Enterprise Information Systems (ICEIS 2024) - Volume 1, pages 837-844
ISBN: 978-989-758-692-7; ISSN: 2184-4992
Proceedings Copyright © 2024 by SCITEPRESS – Science and Technology Publications, Lda.
837

research (Sallam et al., 2021). The approach em-
ployed in our study demonstrates significant poten-
tial for early glaucoma detection, contributing to im-
proved clinical outcomes and preservation of vision.
Our study aims to answer two research questions:
1. Is it better to have more images with less pixels or
fewer images with more pixels?
2. Is it better to apply histogram equalization to high
quality images or leave them unchanged?
To answer the research questions, three experi-
ments were carried out. All experiments done us-
ing images from the Artificial Intelligence for Ro-
bust Glaucoma Detection (AIROGS) (de Vente et al.,
2023) dataset, where the images of the fundus of the
eye have varying dimensions and are provided in high
quality, no information about the location of the optic
disc is provided, so it was necessary to segment the
optic disc and then classify the glaucoma.
To answer the first research question, we used Ex-
periment 1 and Experiment 3. In Experiment 1, using
Detectron 2 (Wu et al., 2019), a state-of-the-art library
from Facebook AI Research that provides state-of-
the-art segmentation algorithms, 4.177 images were
generated with segmented optic discs, with dimen-
sions of 390×390 pixels. In Experiment 3, 1.000
images were used without any change in dimensions,
containing considerably more pixels than the images
in Experiment 1, the optic discs of the 1.000 images
were manually labeled using the LabelImg applica-
tion. We used histogram equalization in both experi-
ments 1 and 3.
To answer the second research question, we used
Experiment 2 and Experiment 3. The same set of
1.000 images used in Experiment 3 was also used
in Experiment 2. These experiments are similar, the
only difference is that histogram equalization is ap-
plied in Experiment 3, while the images from Exper-
iment 2 remain identical to those provided by dataset
AIROGS (de Vente et al., 2023). In all experiments,
we used the Faster R-CNN model with a ResNet-50-
FPN backbone structure for glaucoma detection.
2 FASTER R-CNN
Fast R-CNN utilizes a Convolutional Neural Network
(CNN) to extract features from the image and then
feeds these features into a classifier to perform object
detection. Compared to image classification, object
detection is a more challenging task that requires so-
phisticated methods, presenting two main challenges.
First, it is necessary to process multiple candidate ob-
ject locations, often referred to as to as proposals.
Second, these candidates provide only an approxi-
mate location that needs to be refined for precise lo-
calization (Girshick, 2015).
Faster R-CNN combines the Fast R-CNN
model with an additional region proposal network
(RPN) (Oliveira et al., 2021; Nazir et al., 2020).
The RPN is a type of CNN that has the ability to
predict object boundaries and assign confidence
scores to each position within an image. By utilizing
shared convolutional computations, it achieves a
considerably faster detection system compared to
the methods of selective search (SS) or edge boxes
(EB). The RPN’s approach of generating a reduced
number of proposals also leads to a decrease in the
computational workload required for region-wise
fully connected processing (Ren et al., 2015).
The choice to use Faster R-CNN is due to its
ability to achieve high accuracy in object detection.
Huang (Huang et al., 2017) analyzes the performance
of various object detection networks, including sin-
gle shot detector (SSD), Faster R-CNN, and R-FCN.
According to the results presented in his study, Faster
R-CNN emerged as the most accurate model, albeit
slower. It requires at least 100 ms per image, but of-
fers greater precision in object detection compared to
the R-FCN and SSD model. Despite its slower speed,
Faster R-CNN still ensures an apropriate speed for
implementation in this project.
Faster R-CNN and RPN have been used by several
winning teams in different object detection categories
in competitions such as, ILSVRC and COCO 2015,
suggesting that the method is not only an economical
solution for practical use, but also an effective way to
improve the accuracy in detecting objects. (Ren et al.,
2015).
3 METHODOLOGY
The methodology of this study is divided into seven
subsections. The first subsection describes the
AIROGS, a dataset with 113,893 color images of the
fundus of the eye, with different dimensions. The
second subsection discusses the use of Detectron 2,
an open-source platform that was utilized for optic
disc detection. In the third subsection, the Faster R-
CNN model and the ResNet-50-FPN backbone are
presented, which were used for glaucoma detection.
The fourth subsection covers Experiment 1, using re-
sized images that underwent histogram equalization.
The fifth subsection addresses Experiment 2, where
original images were used. The sixth subsection de-
scribes Experiment 3, where histogram equalization
was applied to the images with original dimensions.
ICEIS 2024 - 26th International Conference on Enterprise Information Systems
838

Finally, in the seventh subsection, the details of the
model training are presented. The code was devel-
oped in Python
1
3.1 AIROGS Dataset
The AIROGS Dataset (de Vente et al., 2023) consists
of a collection of color images of the fundus of the
eye from 60,357 individuals, totaling 113,893 images,
with various dimensions. The dataset includes sub-
jects from approximately 500 different locations, rep-
resenting a diverse ethnic population. A table is pro-
vided, containing two columns: challenge id, which
includes the image names, and class, which indicates
the classification as either referable glaucoma (RG) or
non-referable glaucoma (NRG).
The label quality was ensured by a carefully se-
lected group of evaluators. This group included oph-
thalmologists, glaucoma specialists, ophthalmology
residents, and optometrists, totaling 32 professionals.
Each image was evaluated twice by different eval-
uators. If there was agreement between the evalu-
ators, the agreed-upon label became the final label.
In case of disagreement, the image was assessed by
an experienced glaucoma specialist, and their deter-
mined label served as the final label for the image.
Throughout the evaluation process, the performance
of all evaluators was monitored. Those who exhibited
sensitivity below 80% and/or specificity below 95%
were removed from the group of evaluators. Thus,
the AIROGS dataset has been meticulously labeled
and provides a set of high-quality labels for analysis
and research in the field of glaucoma detection.
As the training labels did not contain information
about the location of the optic disc, it was necessary
to perform manual segmentation. In Experiment 1,
4.177 images were resized to 512×512 pixels. Then,
500 of these images underwent manual labeling of the
optic disc using the LabelImg application. Each la-
beled image had an XML annotation indicating the
location of the optic disc. The 500 images, along with
their XML annotations, were used as input for Detec-
tron 2 to generate 4.177 cropped optic discs with di-
mensions of 390×390 pixels. For experiments 2 and
3, the image dataset retained its original dimensions.
A total of 1.000 images were manually labeled using
the LabelImg application for these two experiments.
In Experiment 1, 4.177 images of the optic disc
were used, divided as follows: the test set was de-
fined as 10% of the total training set size (417 im-
ages), while the validation set corresponded to 20%
of the total training set size (835 images), with the
remaining images (2925) allocated for training.
1
https://github.com/ddantas-ufs/2024 glaucoma
In experiments 2 and 3, 1.000 images of the eye
fundus with manually marked optic discs were used.
The test set size was defined as 10% of the total
size (100 images), while the validation set size cor-
responded to 20% of the total size (200 images), with
the remaining images (700) allocated for training.
3.2 Detectron 2
Developed by Facebook AI Research (FAIR), is an
open-source platform that implements object detec-
tion and segmentation algorithms (Pham et al., 2020).
Detectron is a state-of-the-art library developed by
Facebook AI Research that provides cutting-edge
object detection and segmentation algorithms. It
serves as the successor to Detectron and maskrcnn-
benchmark
2
. Detectron2 supports various computer
vision research projects and production applications
at Facebook (Wu et al., 2019). Optic disc detection is
a critical step in the development of automated diag-
nosis systems for various serious ophthalmic patholo-
gies (Aquino et al., 2010), Detectron 2 was used for
this purpose in Experiment 1.
3.3 Faster R-CNN Model and a
ResNet-50-FPN Backbone
To use the Faster R-CNN model with ResNet-50 and
feature pyramid network (FPN) a list of tensors is re-
quired as input. Each tensor corresponds to an im-
age. These flexible experiments allow the model to
handle images of different sizes and detect objects
at various resolutions. The behavior of the model
varies depending on whether it is in training or evalua-
tion mode (TorchVision maintainers and contributors,
2016). During training, the model uses input tensors
and a target (a list of dictionaries) that contains spe-
cific information. This target information typically
includes basic annotations for input images, such as
bounding boxes of objects present in the images. The
bounding boxes are a matrix of float tensors with di-
mensions (N, 4), where N is the number of bound-
ing boxes. Each bounding box is defined by coor-
dinates (x
1
, y
1
, x
2
, y
2
), which represent the reference
points defining the box. The values (x
1
, y
1
, x
2
, y
2
)
specify the coordinates of the corners of the rectangu-
lar bounding box. Let W be the image width and H be
the image height. The conditions (0 ≤ x
1
< x
2
< W )
and (0 ≤ y
1
< y
2
< H) ensure that the bounding box
is within the image boundaries. In addition to the
bounding boxes, the target also includes the class la-
2
https://github.com/facebookresearch/maskrcnn-
benchmark
Glaucoma Detection Using Transfer Learning with the Faster R-CNN Model and a ResNet-50-FPN Backbone
839
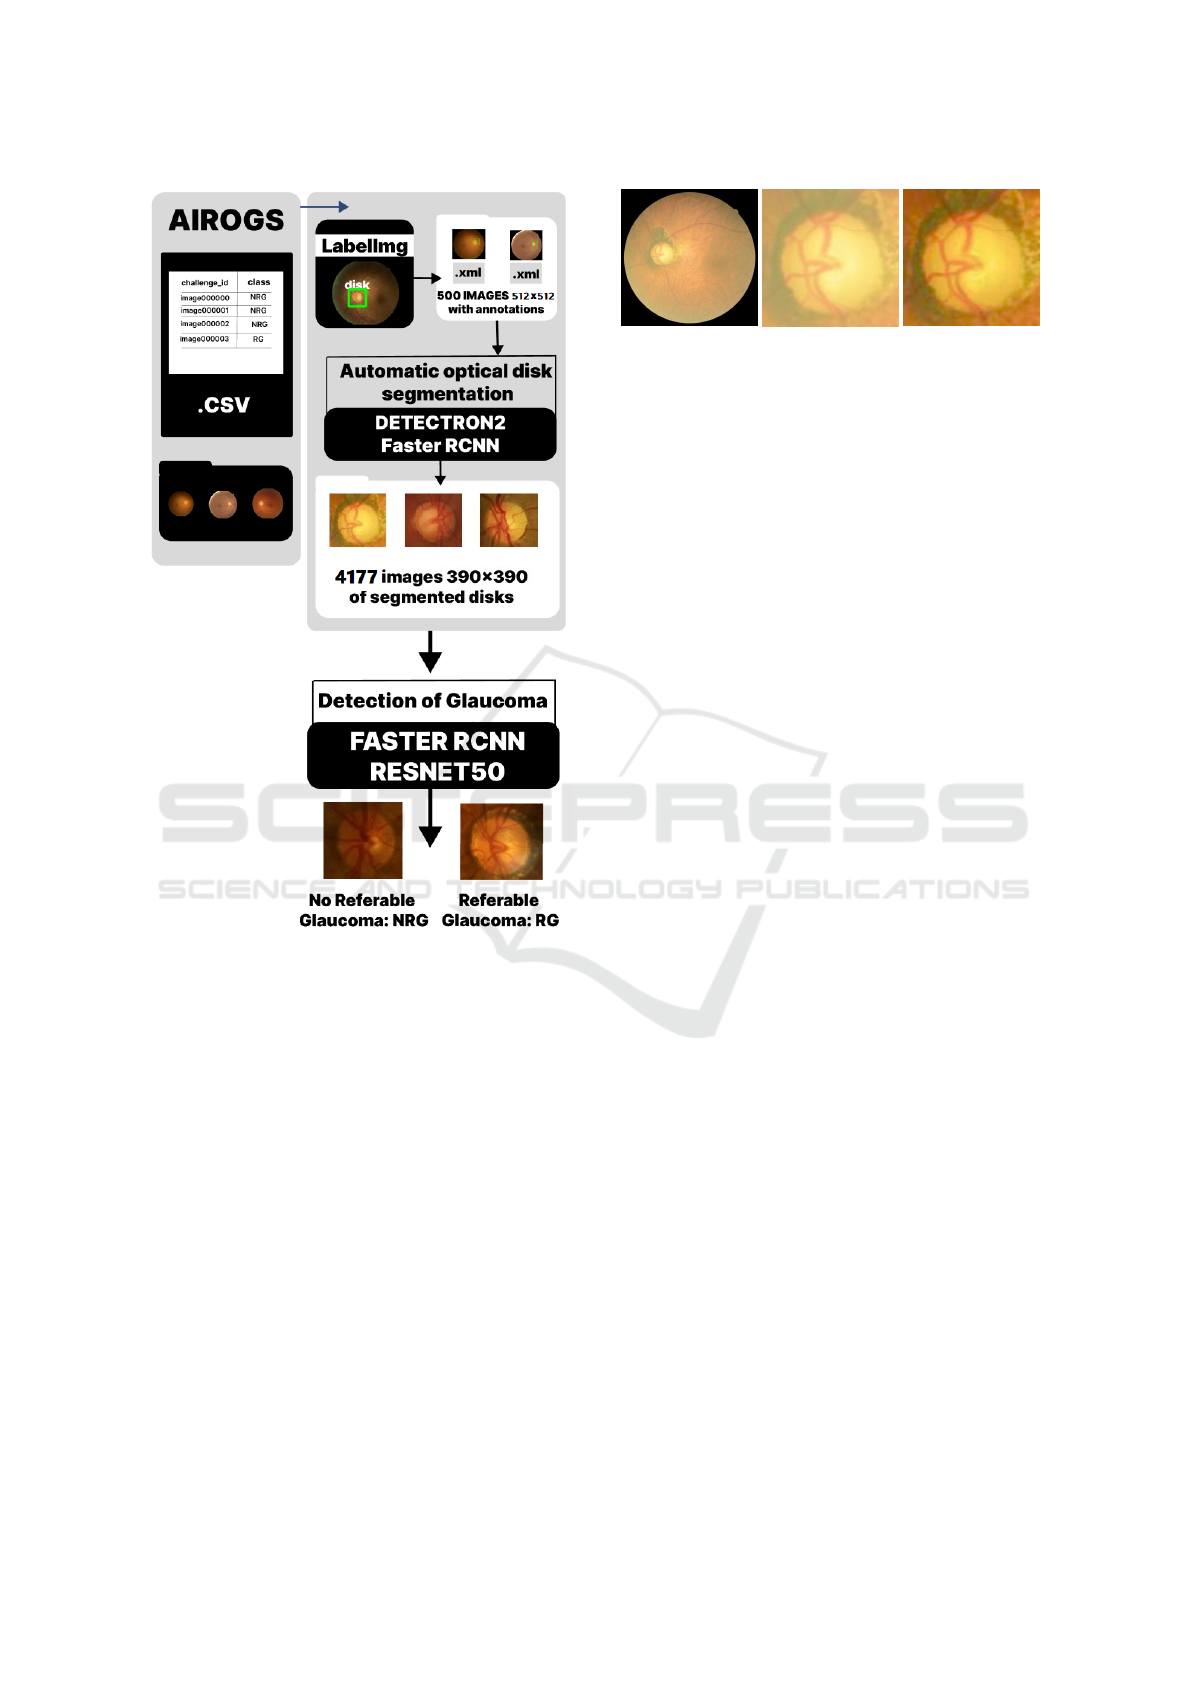
Figure 1: Experiment 1: Images resized and with histogram
equalization.
bel for each box. During inference, the model only
requires the input tensors and returns post-processed
predictions, one for each input image. The fields of
the dictionary are as follows: the predicted bounding
boxes, the predicted labels for each detection, and the
scores for each detection.
3.4 Experiment 1: Images Resized and
with Histogram Equalization
Figure 1 illustrates the workflow for glaucoma detec-
tion in Experiment 1. Initially, a total of 4.177 fundus
images were resized to dimensions of 512×512 pix-
els. Out of these images, 500 were manually anno-
tated using the LabelImg application. Each annotated
image had an XML annotation specifying the location
of the optic disc.
The manually annotated images, along with their
respective annotations, were used to train Detectron 2,
Figure 2: Histogram equalization example: (a) Fundus of
the eye (b) Optic disc without histogram equalization (c)
Optic disc with histogram equalization.
an automated segmentation model. This enabled the
automatic segmentation of the optic discs, resulting
in 4.177 cropped discs with dimensions of 390×390
pixels.
The 4.177 segmented disc images, along with
a processed label table from the AIROGS dataset,
were used as input for classification. This classifica-
tion step employed the Faster R-CNN model with a
ResNet-50-FPN backbone.
To enhance the image quality, the histogram
equalization technique, as depicted in Figure 2, was
applied to all the segmented optic discs.
3.5 Experiment 2: Images with Original
Sizes
Figure 3 illustrates the workflow for glaucoma detec-
tion in Experiment 2. Initially, 1.000 images from the
AIROGS dataset were manually labeled using the La-
belImg application. Each labeled image was accom-
panied by an XML annotation indicating the location
of the optic disc.
The manually labeled images, along with their re-
spective XML labels, were used to train the Faster R-
CNN model with a ResNet-50 backbone responsible
for glaucoma classification.
3.6 Experiment 3: Images with Original
Sizes and with Histogram
Equalization
In Experiment 3, the same images and annotations
from Experiment 2 were used. The Faster R-CNN
model with a ResNet-50-FPN backbone was utilized
for glaucoma detection. The only aspect that dis-
tinguishes Experiment 2 from Experiment 3 is that
in Experiment 3 the images went through histogram
equalization before training.
3.7 Training
Transfer learning is used to improve a model by trans-
ferring information from a related domain (Yan et al.,
ICEIS 2024 - 26th International Conference on Enterprise Information Systems
840
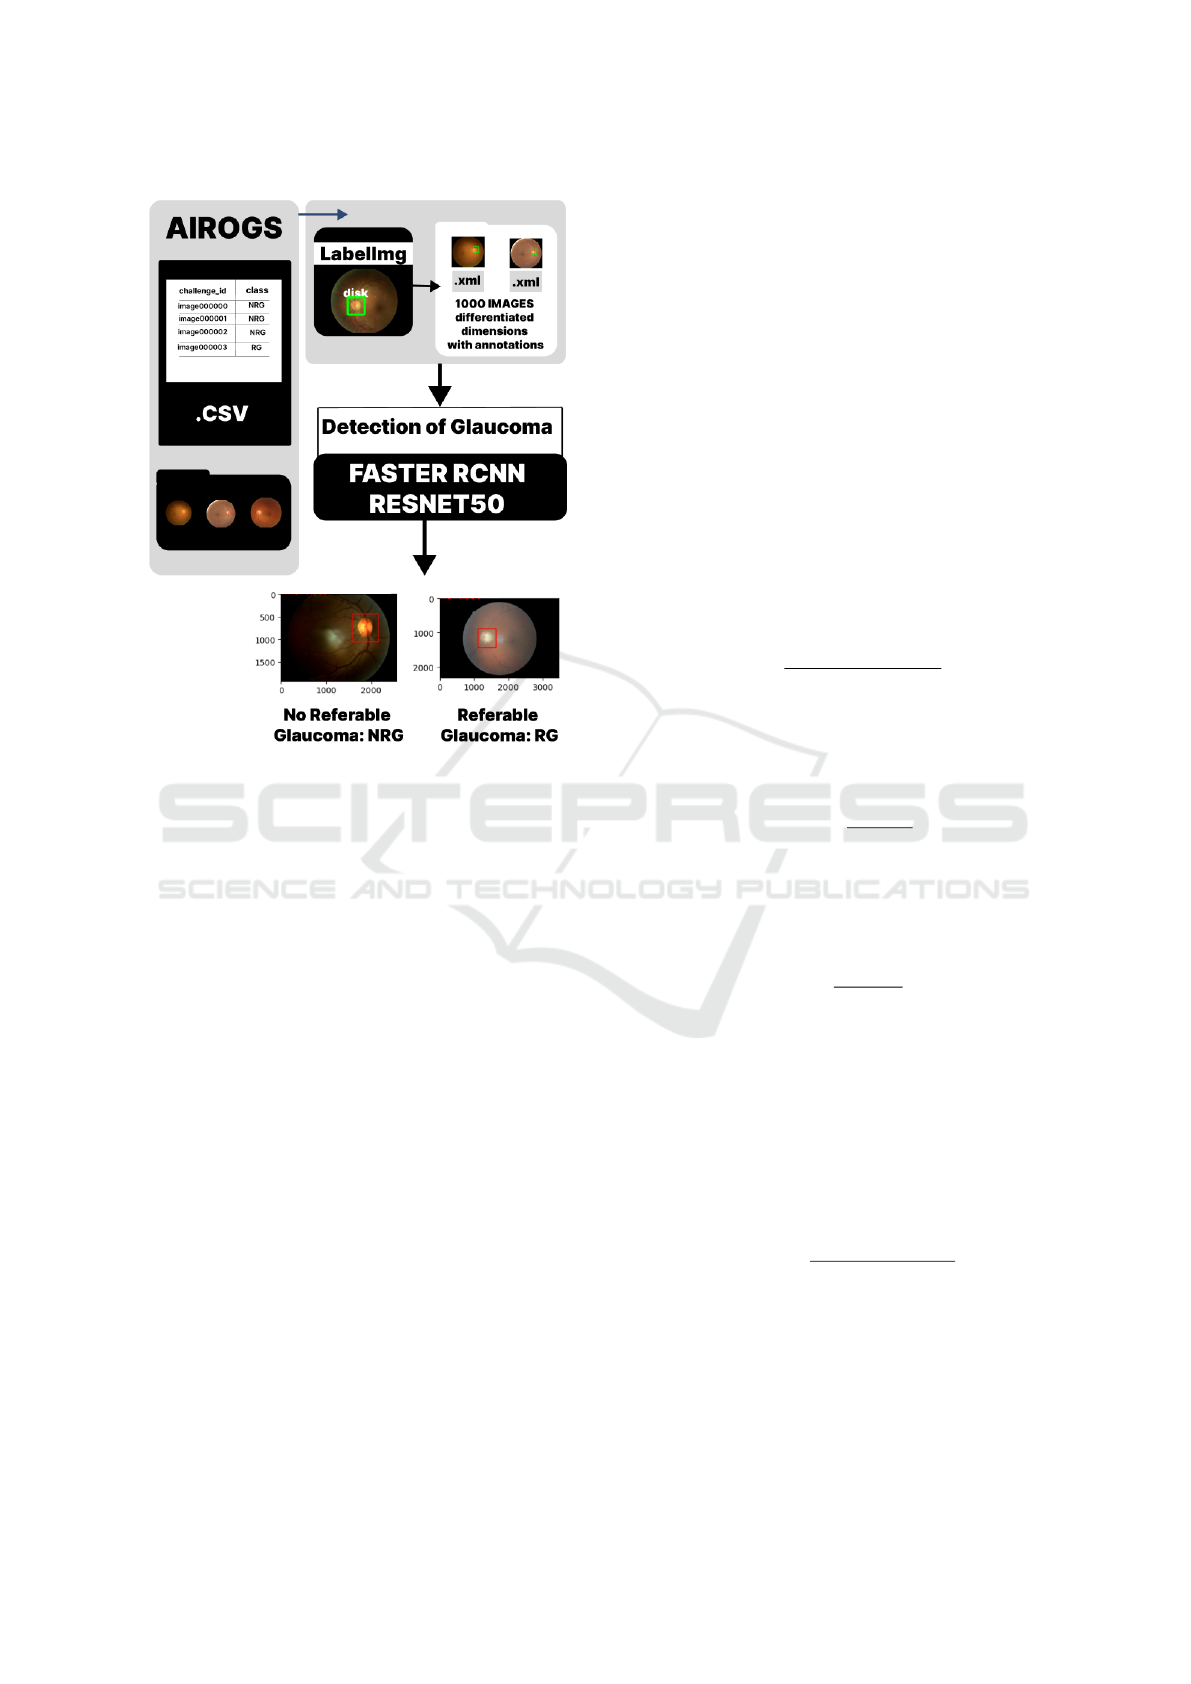
Figure 3: Experiment 2: Images with original sizes.
2017). The Faster R-CNN model with ResNet-50
architecture and FPN was pre-trained on the COCO
(Common Objects in Context) dataset (Lin et al.,
2014). In this study, the model weights are updated
during training using the SGD optimizer with a learn-
ing rate of 0.005, a momentum of 0.9, and a weight
decay rate of 0.0005. In terms of the model’s classifi-
cation layer, the Faster R-CNN model with a ResNet-
50-FPN backbone architecture was designed for 91
classes. However, in the context of glaucoma detec-
tion, the classification layer is replaced by a new layer
adapted to the specified number of classes, which in
this case are 3 classes: 0 for background, 1 for RG,
and 2 for NRG. The training duration in all experi-
ments was 12 epochs.
4 RESULTS AND DISCUSSION
Table 1 displays the values of the metrics in glaucoma
detection. Experiment 2 achieved the highest accu-
racy of 0.8900. In terms of precision, Experiment 1
had the highest value of 0.8967, while Experiment 3
had the lowest precision of 0.8043. Regarding recall,
Experiment 3 obtained the highest value of 0.9250,
while Experiment 1 had the lowest recall of 0.8643. In
terms of the F1-score, Experiment 2 had the best per-
formance with a score of 0.8817, followed by Exper-
iment 1 with 0.8802, and Experiment 3 with 0.8605.
These metrics can be compared with the metrics re-
ported by Sallam (Sallam et al., 2021). Figure 4 and
Figure 5 display examples of glaucoma detection pre-
dictions from experiments 1 and 2, respectively.
Accuracy (ACC) is an evaluation metric that mea-
sures the rate of correct predictions made by the
model in relation to the total number of evaluated ex-
amples. In other words, accuracy indicates the per-
centage of correct predictions out of the total predic-
tions made. True positive (TP) represents the cases in
which the model correctly predicted the positive class.
True negative (TN) represents the cases in which the
model correctly predicted the negative class. False
positive (FP) represents the cases in which the model
incorrectly predicted the positive class. False negative
(FN) represents the cases in which the model incor-
rectly predicted a negative class.
ACC =
TP+TN
TP+TN+FP+FN
Precision, also known as positive predictive value,
provides an estimate of how many of the examples
classified as positive by the model are actually posi-
tive.
Precision =
TP
TP+FP
Recall, also known as true positive rate (TPR) or
sensitivity, is an evaluation metric that measures the
proportion of true positive predictions in relation to
the total number of actual positive examples.
Recall =
TP
TP+FN
F1-score is the harmonic mean of precision and re-
call, giving equal weight to both metrics. It provides
a balanced evaluation of a model’s performance, par-
ticularly in scenarios where precision and recall are
both important. By using the F1-score, we can assess
the trade-off between precision and recall. A higher
F1-score indicates a better balance between the two
metrics, while a lower score suggests an imbalance in
favor of either precision or recall.
F1-score = 2
Precision×Recall
Precision+Recall
In this study, three separate experiments, experi-
ment 1, experiment 2, and experiment 3, were car-
ried out to evaluate glaucoma detection using a Faster
R-CNN model and a ResNet-50-FPN backbone. The
accuracy values obtained were 0.8753, 0.8900, and
Glaucoma Detection Using Transfer Learning with the Faster R-CNN Model and a ResNet-50-FPN Backbone
841
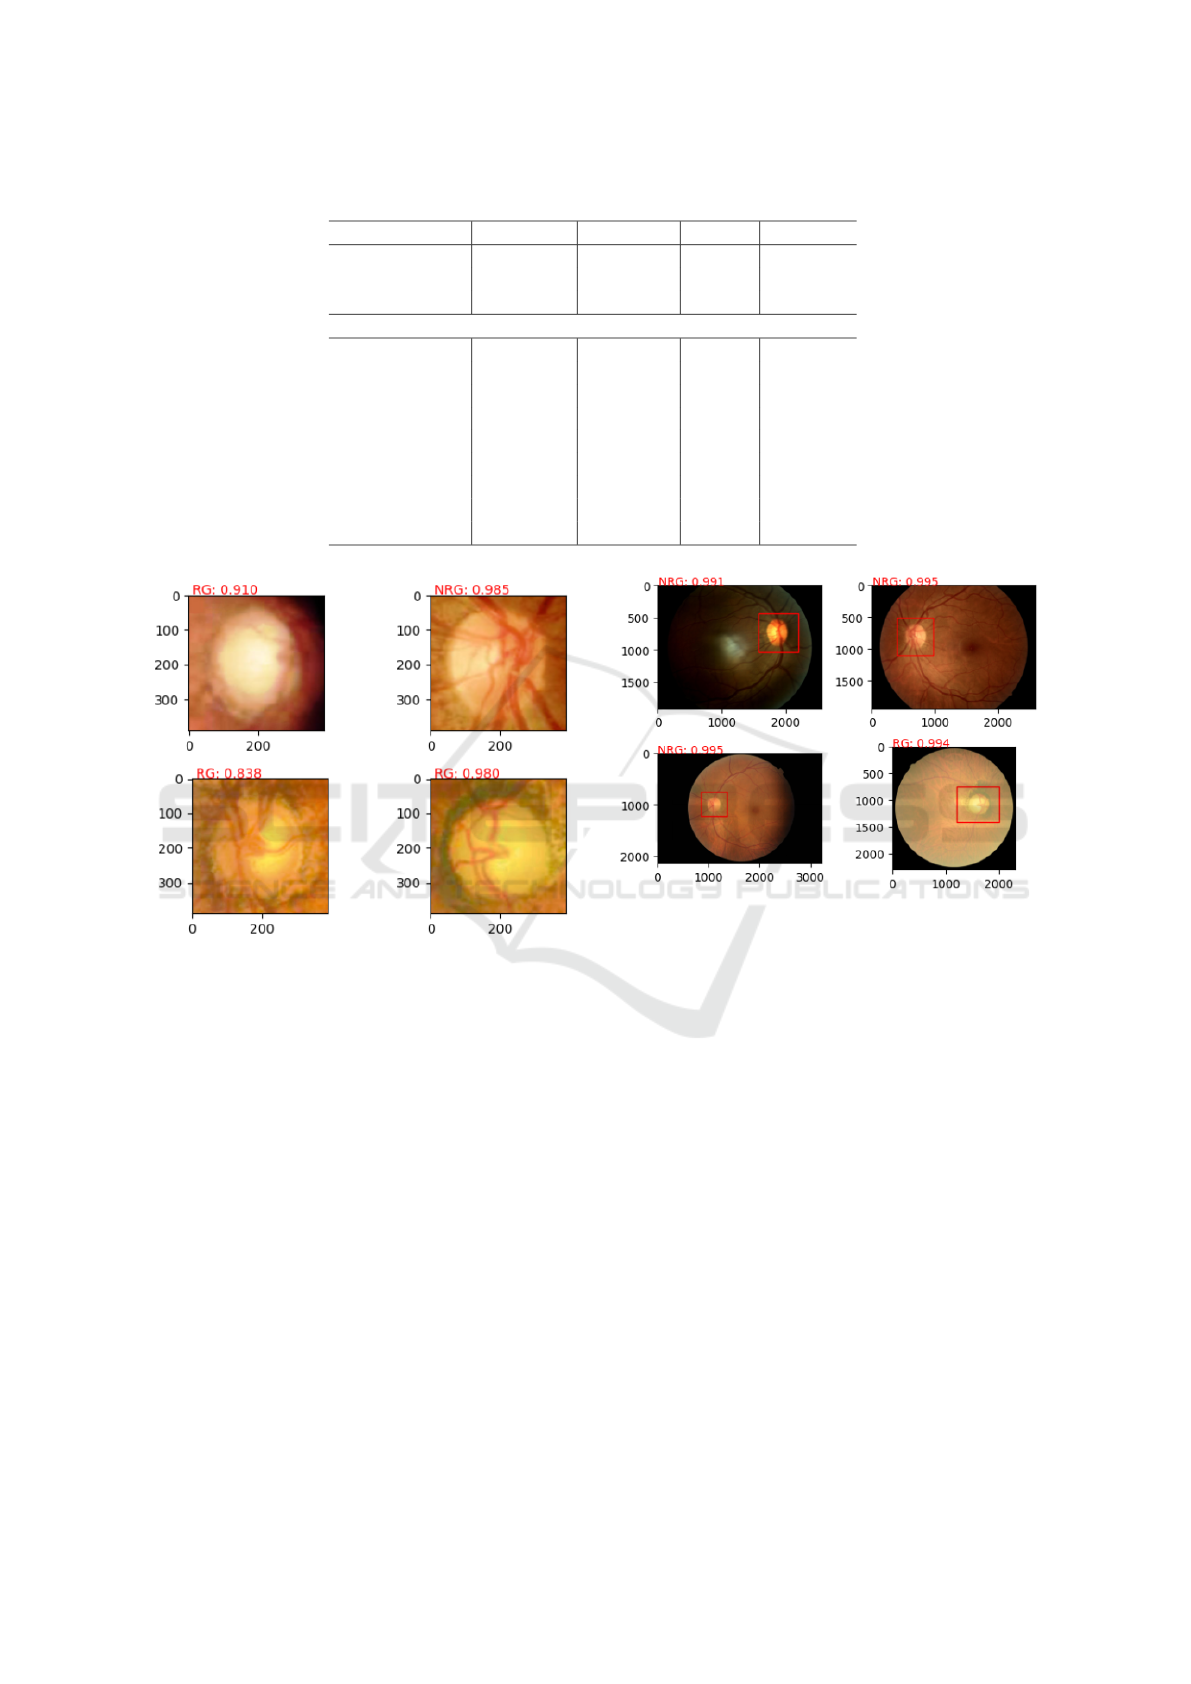
Table 1: Comparison of metrics.
Experiment Accuracy Precision Recall F1-score
Experiment 1 0.8753 0.8967 0.8643 0.8802
Experiment 2 0.8900 0.8913 0.8723 0.8817
Experiment 3 0.8800 0.8043 0.9250 0.8605
Models presented in Sallam (Sallam et al., 2021)
AlexNet 0.814 0.818 0.815 -
VGG-11 0.800 0.800 0.800 -
VGG-16 0.822 0.820 0.820 -
VGG-19 0.809 0.809 0.809 -
GoogleNet-V1 0.829 0.829 0.830 -
ResNet-18 0.867 0.867 0.867 -
ResNet-50 0.856 0.856 0.857 -
ResNet-101 0.862 0.862 0.862 -
ResNet-152 0.869 0.869 0.869 -
Figure 4: Prediction of glaucoma detection Experiment 1.
0.8800 for experiment 1, experiment 2, and experi-
ment 3, respectively, indicating a promising perfor-
mance in detecting glaucoma in the dataset used in
this study.
Our study aimed to answer two research ques-
tions. The first question was whether it is better to
have more images with fewer pixels or fewer images
with more pixels. Experiment 3, which used fewer
images with more pixels, obtained a greater accuracy
of 0.8800 compared to experiment 1, which obtained
an accuracy of 0.8753.
The second research question was whether it is
better to apply histogram equalization to high qual-
ity images or leave them unchanged. Experiment 2,
which used high-quality unaltered images, had a bet-
ter accuracy of 0.8900 compared to experiment 3,
which used histogram equalization on high-quality
images, and achieved an accuracy of 0.8800.
These findings suggest that in our study, hav-
ing fewer images with more pixels and leaving high-
Figure 5: Prediction of glaucoma detection Experiment 2.
quality images unaltered led to improved performance
in terms of accuracy.
As shown in Table 1, the experiments conducted
in this study exhibited a superior performance in glau-
coma detection compared to the results reported in
the reference study (Sallam et al., 2021). The refer-
ence study employed models such as AlexNet, VGG-
11, VGG-16, VGG-19, GoogleNet-V1, ResNet-18,
ResNet-50, ResNet-101, and ResNet-152, achieving
an accuracy ranging from 0.814 to 0.869.
5 CONCLUSIONS
This study provided compelling evidence of the
promising performance of the Faster R-CNN model
and a ResNet-50-FPN backbone approach in glau-
coma detection. The experimental results demon-
strated higher accuracy compared to reference mod-
els such as AlexNet, VGG-11, VGG-16, VGG-
19, GoogleNet-V1, ResNet-18, ResNet-50, ResNet-
101, and ResNet-152. This disparity suggests that
ICEIS 2024 - 26th International Conference on Enterprise Information Systems
842

the combination of the Faster R-CNN model and a
ResNet-50-FPN can serve as a robust and effective
choice for early glaucoma detection.
In our study, we investigated how the number of
images and histogram equalization affect the accu-
racy of glaucoma detection. The first question we
addressed was, is it better to have more images with
fewer pixels or fewer images with more pixels? We
found that using fewer images with more pixels re-
sulted in higher accuracy in glaucoma detection com-
pared to using more images with fewer pixels. This
means that having a higher resolution in the images,
even with fewer total images, led to better perfor-
mance in glaucoma detection.
The second question we investigated was whether
histogram equalization affects glaucoma detection in
high-quality images. We found that leaving the high-
quality images unaltered resulted in better accuracy
than applying histogram equalization to those im-
ages. This indicates that histogram equalization did
not bring considerable benefits to glaucoma detection
in high-quality images in our study.
For future studies, we recommend conducting a
Monte Carlo analysis and applying a statistical test to
determine if there is a significant difference between
the results of the different experiments. By perform-
ing Monte Carlo simulations and appropriate statis-
tical tests, it will be possible to obtain more robust
conclusions about which experiment yields superior
results. This statistical analysis will enhance the reli-
ability and validity of the findings, contributing to the
advancement of knowledge in glaucoma detection.
The accuracy and recall achieved in the exper-
iments underscore the ability of the Faster R-CNN
model and ResNet-50-FPN backbone approach to
make accurate predictions and identify positive cases
of glaucoma. These findings highlight the potential
of the proposed approach to support healthcare pro-
fessionals in the early diagnosis.
REFERENCES
Abr
`
amoff, M. D., Garvin, M. K., and Sonka, M. (2010).
Retinal imaging and image analysis. IEEE Reviews in
Biomedical Engineering, 3:169–208.
Aljazaeri, M., Bazi, Y., AlMubarak, H., and Alajlan, N.
(2020). Faster R-CNN and DenseNet regression for
glaucoma detection in retinal fundus images. In 2020
2nd International Conference on Computer and Infor-
mation Sciences (ICCIS), pages 1–4. IEEE.
Aquino, A., Geg
´
undez-Arias, M. E., and Mar
´
ın, D. (2010).
Detecting the optic disc boundary in digital fundus im-
ages using morphological, edge detection, and feature
extraction techniques. IEEE Transactions on Medical
Imaging, 29(11):1860–1869.
Chai, Y., Liu, H., and Xu, J. (2018). Glaucoma diagnosis
based on both hidden features and domain knowledge
through deep learning models. Knowledge-Based Sys-
tems, 161:147–156.
de Vente, C., Vermeer, K. A., Jaccard, N., Wang, H., Sun,
H., Khader, F., Truhn, D., Aimyshev, T., Zhanibekuly,
Y., Le, T.-D., Galdran, A., Gonz
´
alez Ballester, M. n.,
Carneiro, G., G, D. R., S, H. P., Puthussery, D., Liu,
H., Yang, Z., Kondo, S., Kasai, S., Wang, E., Durva-
sula, A., Heras, J., Zapata, M. n., Ara
´
ujo, T., Aresta,
G., Bogunovi
´
c, H., Arikan, M., Lee, Y. C., Cho, H. B.,
Choi, Y. H., Qayyum, A., Razzak, I., van Ginneken,
B., Lemij, H. G., and S
´
anchez, C. I. (2023). AIROGS:
Artificial Intelligence for RObust Glaucoma Screen-
ing Challenge. arXiv preprint arXiv:2302.01738.
Fu, H., Cheng, J., Xu, Y., Zhang, C., Wong, D. W. K., Liu,
J., and Cao, X. (2018). Disc-aware ensemble network
for glaucoma screening from fundus image. IEEE
Transactions on Medical Imaging, 37(11):2493–2501.
Furtado, J. M., Lansingh, V. C., Carter, M. J., Milanese,
M. F., Pe
˜
na, B. N., Ghersi, H. A., Bote, P. L., Nano,
M. E., and Silva, J. C. (2012). Causes of blindness
and visual impairment in Latin America. Survey of
Ophthalmology, 57(2):149–177.
Girshick, R. (2015). Fast R-CNN. In 2015 IEEE Interna-
tional Conference on Computer Vision, pages 1440–
1448.
Huang, J., Rathod, V., Sun, C., Zhu, M., Korattikara, A.,
Fathi, A., Fischer, I., Wojna, Z., Song, Y., Guadar-
rama, S., et al. (2017). Speed/accuracy trade-offs for
modern convolutional object detectors. In 2017 IEEE
Conference on Computer Vision and Pattern Recogni-
tion, pages 7310–7311.
Lin, T., Maire, M., Belongie, S. J., Bourdev, L. D., Girshick,
R. B., Hays, J., Perona, P., Ramanan, D., Doll’a r, P.,
and Zitnick, C. L. (2014). Microsoft COCO: common
objects in context. CoRR, abs/1405.0312.
Nazir, T., Irtaza, A., Rashid, J., Nawaz, M., and Mehmood,
T. (2020). Diabetic retinopathy lesions detection using
faster-rcnn from retinal images. In 2020 First Inter-
national Conference of Smart Systems and Emerging
Technologies (SMARTTECH), pages 38–42. IEEE.
Oliveira, A. L. C., Carvalho, A. B., and Dantas, D. O.
(2021). Faster R-CNN approach for diabetic foot ul-
cer detection. In 16th International Joint Conference
on Computer Vision, Imaging and Computer Graphics
Theory and Applications (VISIGRAPP 2021) - Volume
4: VISAPP, pages 677–684. INSTICC, SciTePress.
Pham, V., Pham, C., and Dang, T. (2020). Road damage
detection and classification with detectron2 and faster
r-cnn. In 2020 IEEE International Conference on Big
Data (Big Data), pages 5592–5601. IEEE.
Quigley, H. A. and Broman, A. T. (2006). The number of
people with glaucoma worldwide in 2010 and 2020.
British Journal of Ophthalmology, 90(3):262–267.
Ren, S., He, K., Girshick, R., and Sun, J. (2015). Faster R-
CNN: Towards real-time object detection with region
proposal networks. Advances in neural information
processing systems, 28.
Glaucoma Detection Using Transfer Learning with the Faster R-CNN Model and a ResNet-50-FPN Backbone
843

Sallam, A., Gaid, A. S., Saif, W. Q., Hana’a, A., Abdulka-
reem, R. A., Ahmed, K. J., Saeed, A. Y., and Radman,
A. (2021). Early detection of glaucoma using transfer
learning from pre-trained cnn models. In 2021 Inter-
national Conference of Technology, Science and Ad-
ministration (ICTSA), pages 1–5. IEEE.
Shibata, N., Tanito, M., Mitsuhashi, K., Fujino, Y., Mat-
suura, M., Murata, H., and Asaoka, R. (2018). Devel-
opment of a deep residual learning algorithm to screen
for glaucoma from fundus photography. Scientific re-
ports, 8(1):14665.
Tham, Y.-C., Li, X., Wong, T. Y., Quigley, H. A., Aung, T.,
and Cheng, C.-Y. (2014). Global prevalence of glau-
coma and projections of glaucoma burden through
2040: a systematic review and meta-analysis. Oph-
thalmology, 121(11):2081–2090.
TorchVision maintainers and contributors (2016). Torchvi-
sion: Pytorch’s computer vision library. https://github.
com/pytorch/vision.
Wu, Y., Kirillov, A., Massa, F., Lo, W.-Y., and Gir-
shick, R. (2019). Detectron2. https://github.com/
facebookresearch/detectron2.
Yan, S., Shen, B., Mo, W., and Li, N. (2017). Transfer learn-
ing for cross-platform software crowdsourcing recom-
mendation. In 2017 24th Asia-Pacific Software Engi-
neering Conference (APSEC), pages 269–278. IEEE.
ICEIS 2024 - 26th International Conference on Enterprise Information Systems
844
