
Simulation-Based Performance Evaluation of 3D Object Detection
Methods with Deep Learning for a LiDAR Point Cloud Dataset in a
SOTIF-related Use Case
Milin Patel
1 a
and Rolf Jung
2 b
1
Institute for Advanced Driver Assistance Systems and Connected Mobility, Kempten University of Applied Sciences,
Benningen, Germany
2
Faculty of Computer Science, Kempten University of Applied Sciences, Kempten, Germany
Keywords:
Simulation-Based, Performance Evaluation, Deep Learning, 3D Object Detection, LiDAR Point Cloud,
SOTIF-related Use Case.
Abstract:
Safety of the Intended Functionality (SOTIF) addresses sensor performance limitations and deep learning-
based object detection insufficiencies to ensure the intended functionality of Automated Driving Systems
(ADS). This paper presents a methodology examining the adaptability and performance evaluation of the 3D
object detection methods on a LiDAR point cloud dataset generated by simulating a SOTIF-related Use Case.
The major contributions of this paper include defining and modeling a SOTIF-related Use Case with 21 diverse
weather conditions and generating a LiDAR point cloud dataset suitable for application of 3D object detection
methods. The dataset consists of 547 frames, encompassing clear, cloudy, rainy weather conditions, corre-
sponding to different times of the day, including noon, sunset, and night. Employing MMDetection3D and
OpenPCDET toolkits, the performance of State-of-the-Art (SOTA) 3D object detection methods is evaluated
and compared by testing the pre-trained Deep Learning (DL) models on the generated dataset using Average
Precision (AP) and Recall metrics.
1 INTRODUCTION
Automated Driving System (ADS.) utilizes object de-
tection methods to detect and respond to objects and
events in the environment. Object detection methods
methods use Deep Learning (DL.) models that are
trained on large datasets of images or LiDAR. point
clouds to detect objects entities including pedestrians,
vehicles, and obstacles. However, the performance of
these methods is influenced by the quality of the train-
ing data, the complexity of the driving scenarios, and
the inherent model constraints.
The process of 3D point cloud object detec-
tion involves recognizing and locating objects within
a three-dimensional space using point cloud data,
which is a collection of data points representing the
surfaces of objects in a given environment, typically
obtained from LiDAR. sensor. (Arzhanov, 2019)
Adapting DL. models to perform well across di-
verse domains and in adverse weather conditions to
a
https://orcid.org/0000-0002-8357-6018
b
https://orcid.org/0000-0002-0366-4844
improve generalization is a complex task (Lin et al.,
2022). The survey by (Guo et al., 2021) provided an
overview of DL. for 3D point clouds but did not ad-
dress applications in SOTIF.-related Use Cases. The
study by (Dworak et al., 2019) evaluated LiDAR. ob-
ject detection using simulated data but did not account
for varying weather conditions essential for SOTIF.-
related Use Cases. Although (Peng et al., 2023) de-
veloped a dataset focusing on visual SOTIF. scenarios
in traffic, the application to point cloud-based object
detection methods was not examined. Furthermore,
(Abrecht et al., 2023) highlighted safety concerns in
automated driving perception without delving into the
specifics of LiDAR. sensor data in varying weather
conditions.
The challenges in object detection from point
clouds include the assumption that object categories
do not change over time, leading to performance
degradation when learning new classes consecutively
(Dong et al., 2023). Another challenge is detect-
ing small objects due to the lack of valid points and
the distortion of their structure within the point cloud
(Huang et al., 2023). Moreover, the raw point cloud
Patel, M. and Jung, R.
Simulation-Based Performance Evaluation of 3D Object Detection Methods with Deep Learning for a LiDAR Point Cloud Dataset in a SOTIF-related Use Case.
DOI: 10.5220/0012707300003702
Paper published under CC license (CC BY-NC-ND 4.0)
In Proceedings of the 10th International Conference on Vehicle Technology and Intelligent Transport Systems (VEHITS 2024), pages 415-426
ISBN: 978-989-758-703-0; ISSN: 2184-495X
Proceedings Copyright © 2024 by SCITEPRESS – Science and Technology Publications, Lda.
415

may be sparse or occluded, resulting in decreased de-
tection performance (Ruan et al., 2023). The chal-
lenges in 3D point cloud object detection include
noisy points, blind and cluttered scenes, uncompleted
parts of objects, and data analysis difficulties (Elhar-
rouss et al., 2023).
The performance of 3D object detection methods
with DL. can be evaluated in a simulation environ-
ment by using benchmark datasets. Simulation envi-
ronments allow for the creation of synthetic datasets
replicating different environmental conditions, pro-
viding a controlled and repeatable setting suitable for
evaluating the performance of 3D object detection
methods (Mehta et al., 2023). Benchmark datasets
provides standardized evaluation metrics, facilitating
comparisons between different methods, and enabling
the reproducibility of results. The KITTI dataset is
a commonly used benchmark dataset for 3D object
detection, offering a diverse range of object cate-
gories and annotated ground truth data (Mehta et al.,
2023),(Ai et al., 2023).
CARLA is utilized for generating LiDAR point
cloud datasets for 3D object detection due to its scal-
able simulation environment, the ability to simulate
a variety of driving scenarios, and sensor simulation.
However, it also faces challenges of the simulation-to-
reality gap, limited environmental diversity, and com-
putational demands (Li et al., 2023), (Zhang et al.,
2023), (R et al., 2023), (Xu et al., 2022).
To prepare a point cloud dataset from SOTIF-
related Use Case simulations for 3D object detection,
it is crucial to define specific driving scenarios encom-
passing safety considerations, potential failure modes,
and challenging environmental conditions. Utiliz-
ing simulation environments and synthetic data gen-
eration tools is essential for capturing point cloud
data representing these scenarios, while incorporating
variations in lighting, weather conditions, object oc-
clusions, sensor noise, and other factors relevant to
SOTIF-related use considerations. Additionally, an-
notating the simulated point cloud data with ground
truth labels for objects and applying DL.-based object
detection methods are critical to ensure the relevance
of the dataset to the intended functionality.
Acknowledging the conceptual background estab-
lished by existing literature, this paper aims to ex-
pand the application of 3D object detection methods
in SOTIF.-related Use Case by focusing on LiDAR.
point clouds.
1.1 Contribution
The main contributions of this paper are summarized
as follows:
(i) Defining and modeling of a SOTIF.-related Use
Case incorporating 21 diverse weather condi-
tions in the CARLA simulation environment.
(ii) Simulation and generation of a LiDAR. point
cloud dataset, suitable for the application of
State-of-the-Art (SOTA.) 3D object detection
methods.
(iii) Application and evaluation of point cloud based
3D object detection methods on the generated
dataset using MMDetection3D and OpenPCDet
toolkits, using Average Precision (AP.) and Re-
call metrics.
The work is limited to 3D object detection us-
ing LiDAR. point clouds. No RGB images or other
sensory data are used. This paper adopts an ap-
proach where detection methods, pretrained on a real-
world dataset, are evaluated against a simulated Li-
DAR point cloud dataset. This methodology enables
a direct assessment of the DL. models’ adaptability to
a range of simulated conditions.
1.2 Research Questions
This paper aims to resolve the following research
questions:
RQ1. What approach should be taken to prepare a
dataset from a SOTIF.-related Use Case simu-
lation that is suitable for point cloud-based 3D
object detection methods?
RQ2. Which SOTA. 3D object detection methods
are compatible with dataset generated from a
SOTIF.-related Use Case simulation?
RQ3. How do point cloud-based 3D object detec-
tion methods perform when applied to a dataset
generated from a SOTIF.-related Use Case
simulation?
1.3 Structure of the Paper
Following the introduction, this paper is organized
into four main chapters. Chapter 2 presents an
overview of the SOTIF-related Use Case, dataset
structure, the CARLA simulation environment, point
cloud-based 3D object detection methods, and the
evaluation metrics used.
Chapter 3 delineates the process of dataset gener-
ation from CARLA and applying 3D object detection
methods to this dataset. Chapter 4 presents the com-
parison of performance evaluation results obtained
from the application of 3D object detection methods.
The paper concludes with Chapter 5, summarizing
the work and suggesting directions for future research
VEHITS 2024 - 10th International Conference on Vehicle Technology and Intelligent Transport Systems
416
directions. Additionally, Appendix 5 lists the abbre-
viations used throughout the paper.
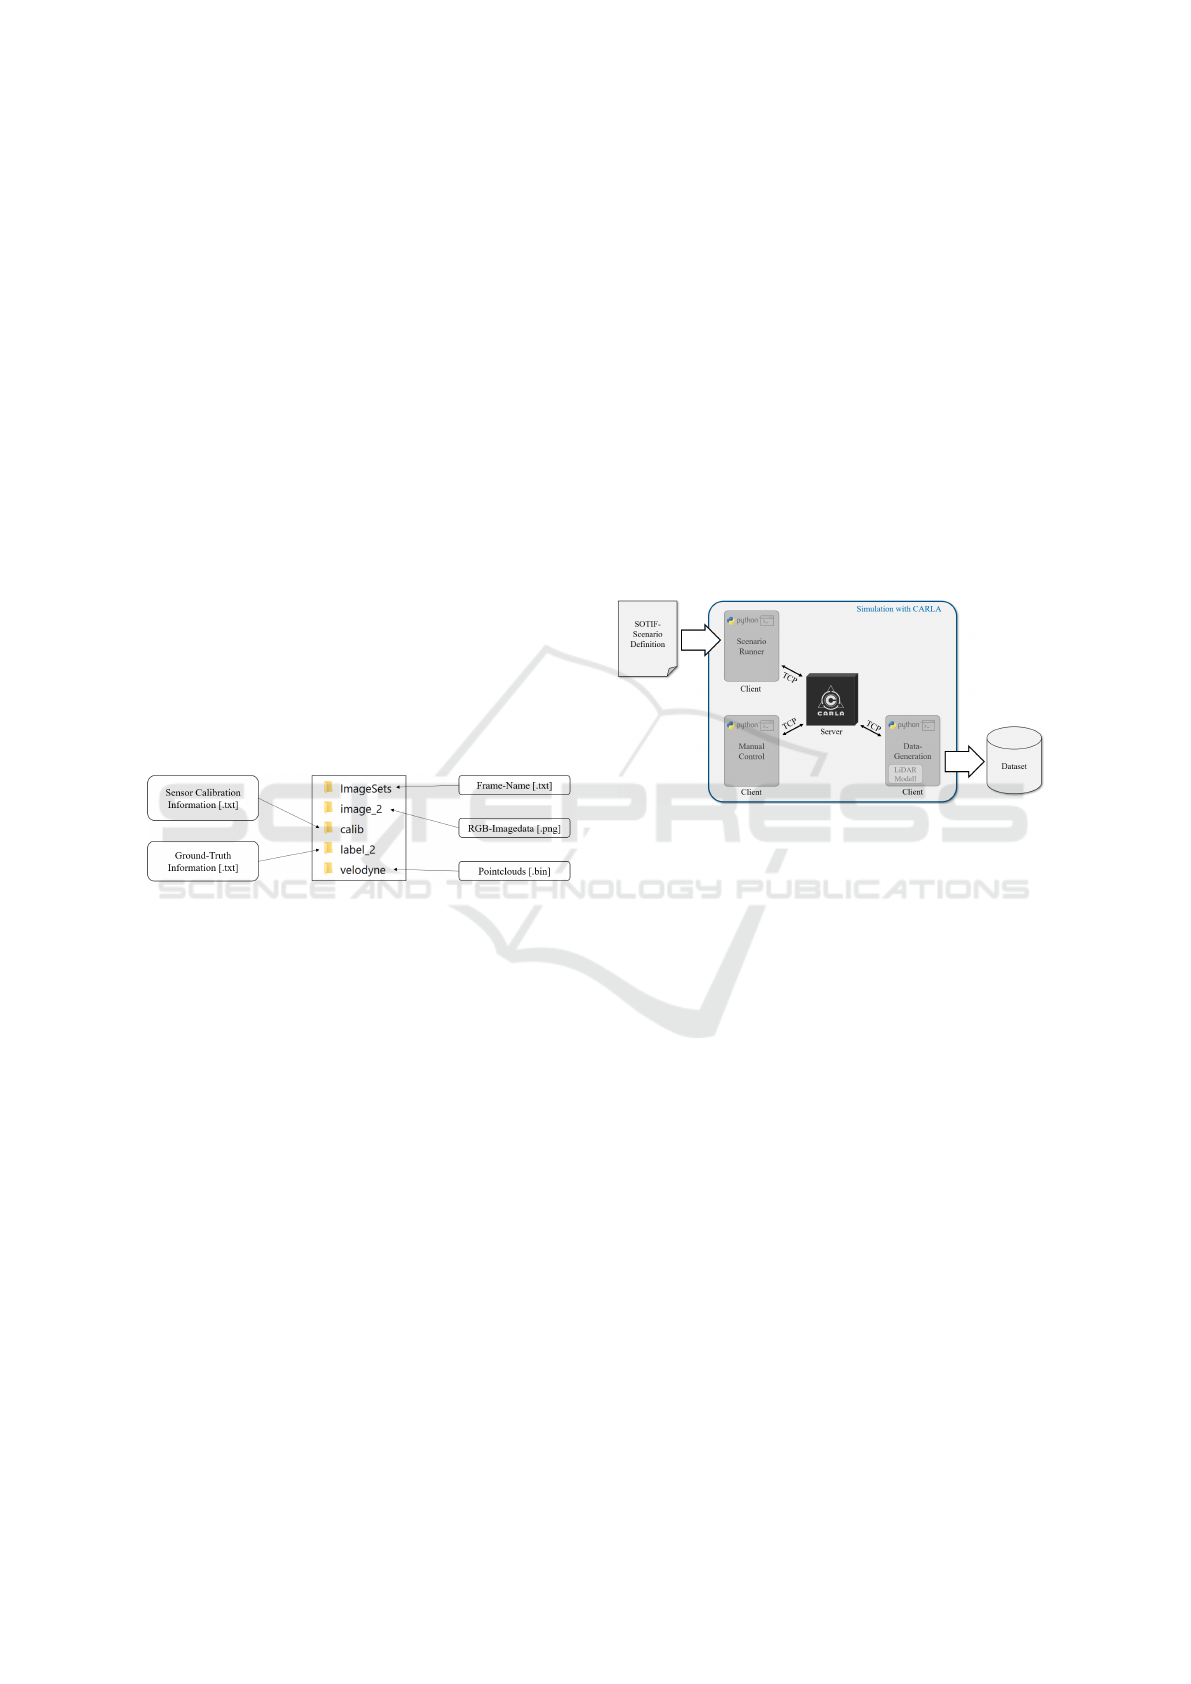
2 METHODOLOGY
This chapter outlines the methodology used to eval-
uate the performance of 3D object detection meth-
ods when applied to a LiDAR. point cloud dataset
from a SOTIF.-related Use Case. Figure 1 presents
a schematic representation of the methodological ap-
proach, detailing the tasks and anticipated outcomes
at each stage.
Figure 1: Schematic Representation of the Methodological
Approach.
The primary task involves simulating a SOTIF.-
related Use Case incorporating diverse weather con-
ditions to generate a point cloud dataset using the
CARLA simulation environment (Dosovitskiy et al.,
2017). The generated dataset is then processed
with 3D object detection methods with DL. models,
which are provided and supported by the MMDe-
tection3D and OpenPCDet toolkits (MMDetection3D
Team, 2020; OpenPCDet Development Team, 2020),
customized for LiDAR.-based 3D object detection.
These toolkits facilitate the performance evaluation of
3D object detection methods on the generated dataset
against established performance metrics.
2.1 Description of the SOTIF.-related
Use Case
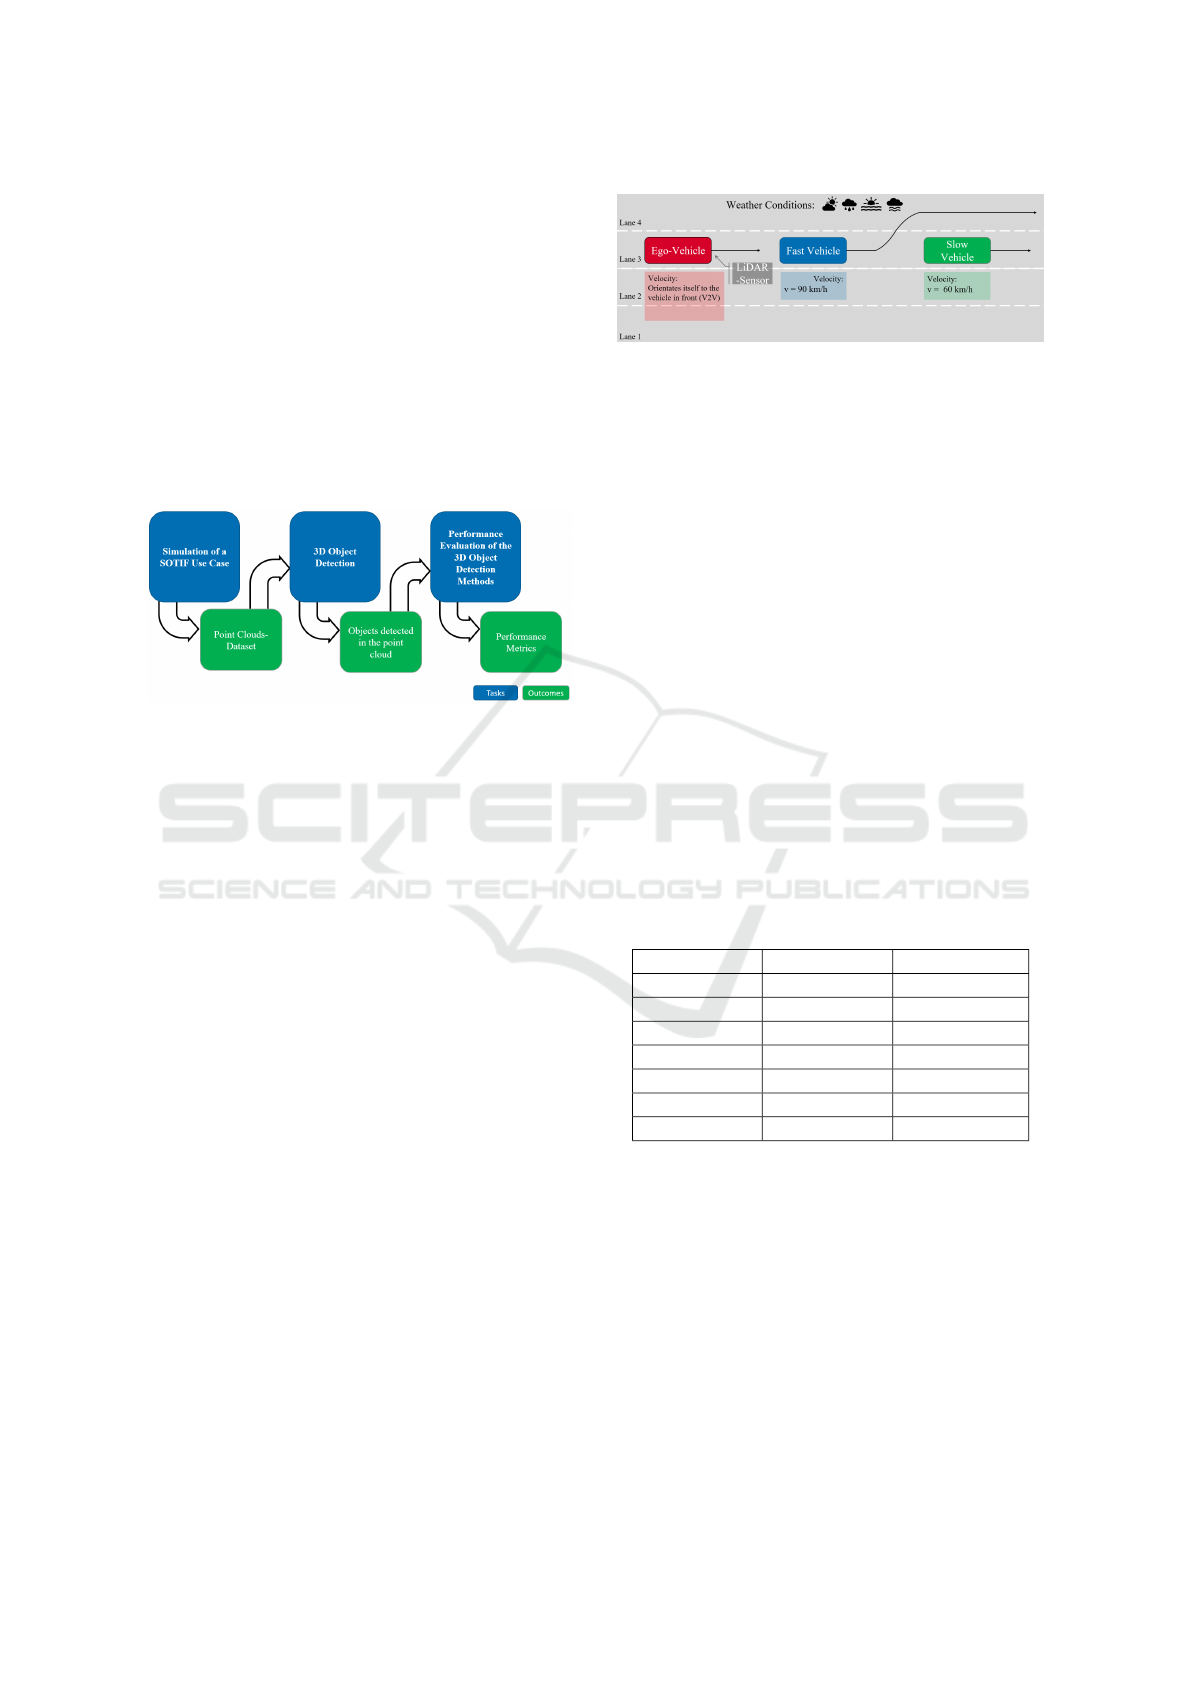
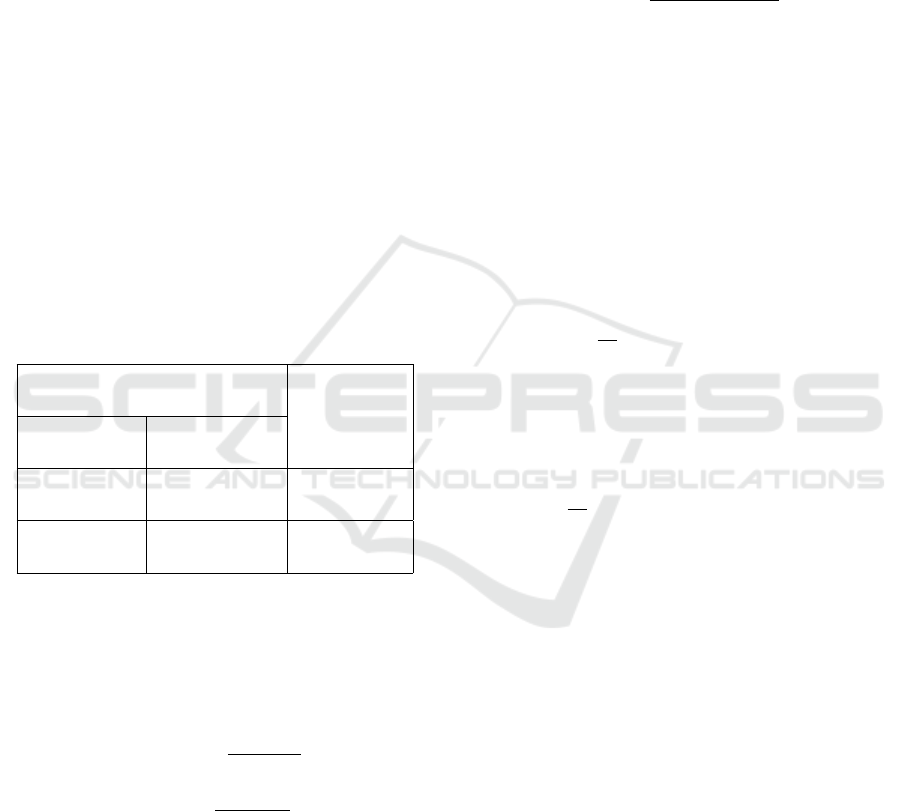
In the SOTIF.-related Use Case depicted in Figure
2, the focus is on the ‘Ego-Vehicle’ equipped with
a LiDAR. sensor that operates on a multi-lane high-
way. The LiDAR. sensor’s functionality is to generate
detailed three-dimensional point clouds of the Ego-
Vehicle’s surrounding. This enables the Ego-Vehicle
to detect surrounding vehicle, measure relative dis-
tance and velocity, and adjust its own velocity under
diverse weather conditions. The Ego-Vehicle is posi-
tioned in lane 3 and is programmed to adapt its veloc-
ity based on the traffic flow, specifically the vehicles
directly ahead. It utilizes Vehicle-to-Vehicle (V2V.)
Figure 2: Description of the SOTIF.-related Use Case.
communication to estimate the velocity and distance
to the preceding vehicle, termed as the ‘fast vehicle’,
traveling at 90 km/h. This enables the Ego-Vehicle to
adjust its velocity accordingly, maintaining a safe fol-
lowing distance without requiring driver intervention.
Subsequently, the fast vehicle changes lanes to
overtake a ‘slow vehicle’, traveling at 60 km/h in the
same lane as the Ego-Vehicle. This maneuver neces-
sitates the Ego-Vehicle’s LiDAR. sensor to promptly
detect the slower vehicle and execute a deceleration
maneuver to prevent a potential collision.
Furthermore, the Use Case includes diverse
weather conditions as outlined in the Table 1, range
from clear conditions optimal for LiDAR. sensor per-
formance to challenging weather conditions like rain
and cloud cover that could impede visibility and
LiDAR. sensor performance.
Table 1 categorizes weather conditions into three
columns corresponding to different times of day:
Noon, Night, and Sunset.
Table 1: Diverse Weather Conditions for SOTIF.-related
Use Case Dataset Generation, (CARLA Documentation:
WeatherParameters Class, 2024).
Noon Night Sunset
ClearNoon ClearNight ClearSunset
CloudyNoon CloudyNight CloudySunset
WetNoon WetNight WetSunset
WetCloudyNoon WetCloudyNight WetCloudySunset
MidRainyNoon MidRainyNight MidRainSunset
HardRainNoon HardRainNight HardRainSunset
SoftRainNoon SoftRainNight SoftRainSunset
Each row of the table represents a set of weather
conditions simulated during the respective time pe-
riod. The ‘Clear’ conditions serve as a control
or baseline, ‘Cloudy’ conditions introduce diffused
lighting challenges, ‘Wet’ conditions incorporate re-
flective lane surfaces, and ‘Rainy’ conditions mimic
visibility reduction due to precipitation. ‘WetCloudy’
conditions combine moisture and diffused light chal-
lenges, representing a more complex environment for
LiDAR. sensor.
Simulation-Based Performance Evaluation of 3D Object Detection Methods with Deep Learning for a LiDAR Point Cloud Dataset in a
SOTIF-related Use Case
417
2.2 Dataset Structure
For the effective application and evaluation of 3D ob-
ject detection methods on generated LiDAR. point
cloud data dataset, the data must be accurately struc-
tured and annotated. The dataset requires label data,
including precise object positions, dimensions, and
classifications, collectively known as ‘ground truth’
data.
The dataset format and structure must align with
benchmark standards to ensure compatibility with 3D
object detection methods. The KITTI dataset (Geiger
et al., 2012), established by the Karlsruhe Institute
of Technology and the Toyota Technological Insti-
tute in 2012, has become the benchmark in the au-
tonomous driving domain. The KITTI dataset is one
of the most frequently cited datasets in the research
field of autonomous driving (Yin and Berger, 2017)
and is used by the majority of 3D object detection
methods (Geiger et al., 2012).
The generated dataset for this paper, therefore,
adopts the KITTI format to facilitate the application
of SOTA. 3D object detection methods.
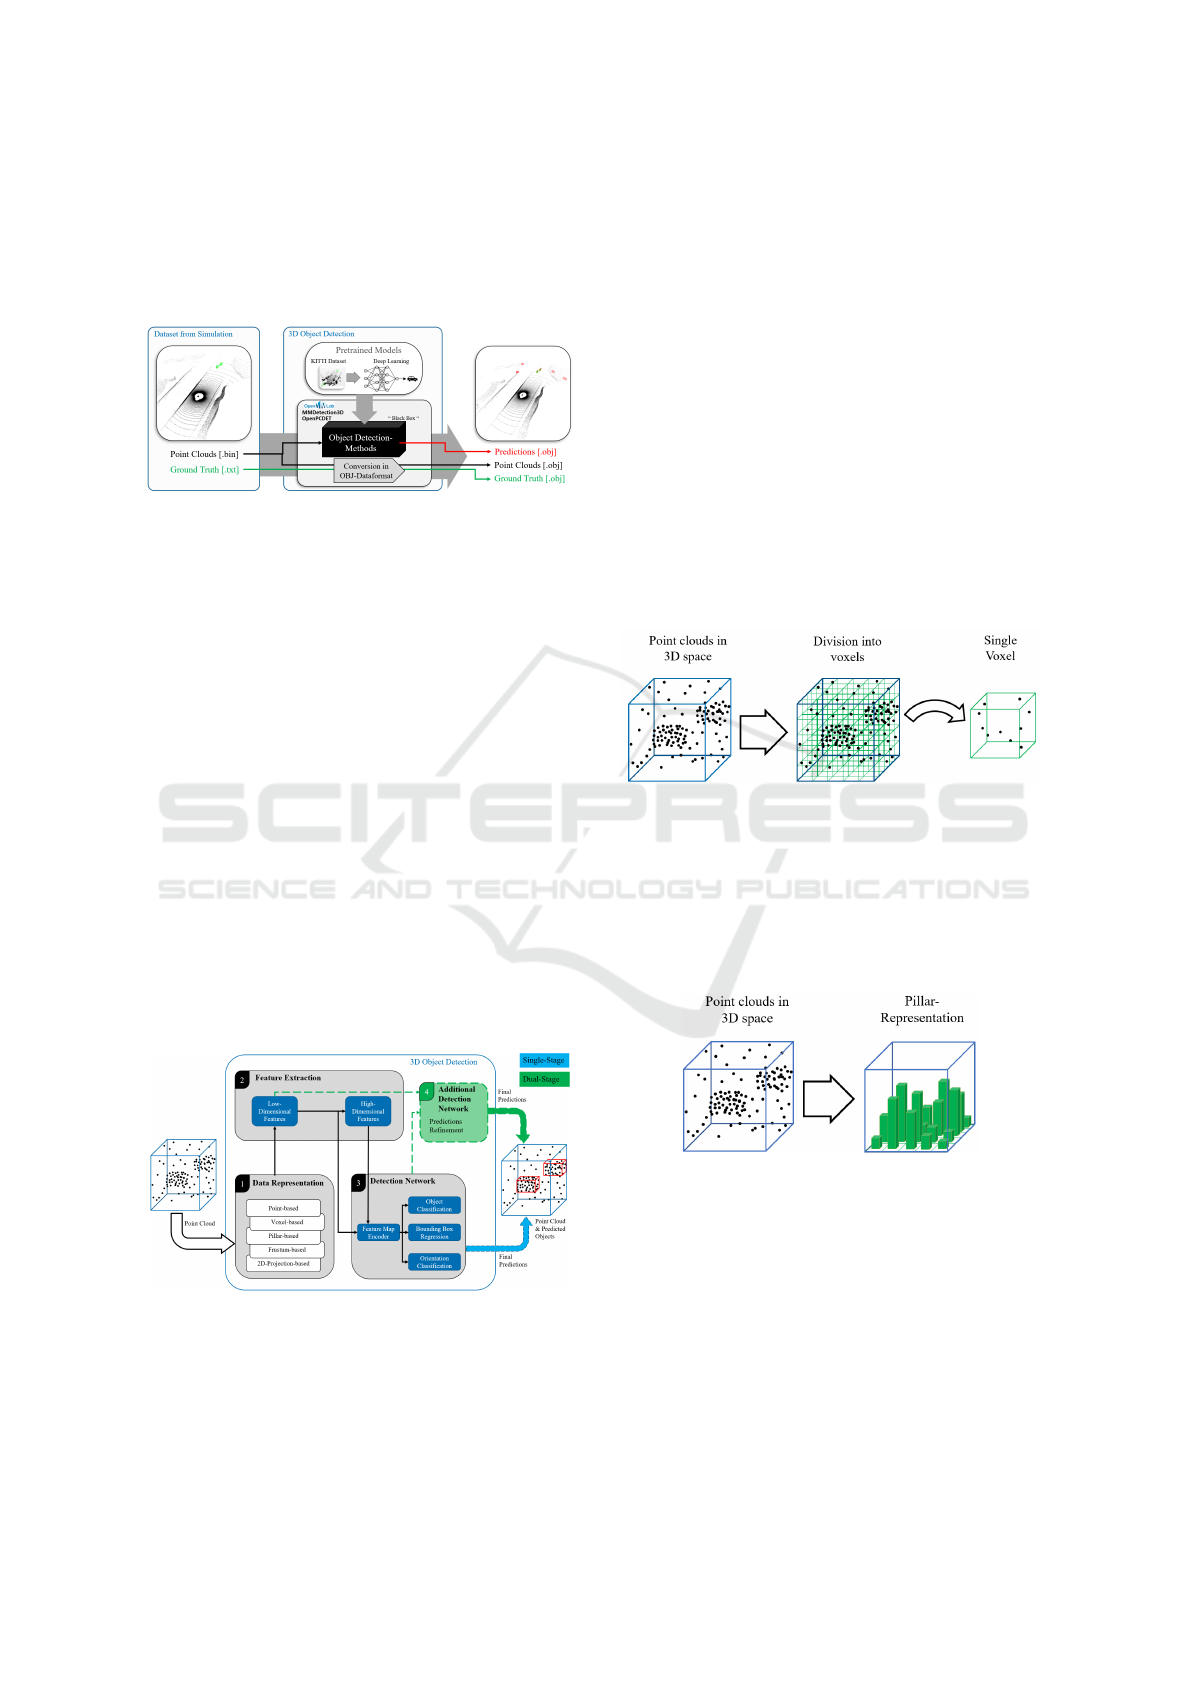
In Figure 3 illustrates the structure of the gener-
ated dataset in KITTI format.
Figure 3: Generated dataset structure.
The subsequent description details the contents
of each folder, describing their specific roles in the
dataset:
Point Cloud Data. The ‘velodyne’ folder contains
point cloud data, represented as binary files (.bin).
Image Data. RGB images, stored as portable net-
work graphics (.png) in the ‘image_2’ folder, sup-
plement the point cloud data by providing visual
context.
Calibration Data. Stored in the ‘calib’ folder as text
files (.txt), calibration data provide parameters for
camera sensor alignment and calibration.
Frame Names. Recorded frame identifiers (e.g.,
000001, 000002, 000003) are documented in a
text file (.txt) within this folder. These identifiers
facilitate dataset division into training, validation,
and testing subsets.
Label Data. The ‘label_2’ folder contains ground
truth data in a text file (.txt), encompassing details
of object class, dimensions, and bounding box co-
ordinates. This data is pivotal for validating object
detection accuracy and training DL. models.
2.3 Simulation Environment: CARLA
CARLA, an open-source platform, was selected for
its capability to simulate intricate traffic scenarios
with customization weather conditions and provides
diverse suite of perception sensors, including Cam-
era, Radar and LiDAR.. The versatility make CARLA
an ideal choice for generating a custom dataset for
LiDAR.-based 3D point cloud detection application
within controlled simulation environment (Dosovit-
skiy et al., 2017).
Figure 4 depicts the server-client framework foun-
dational to CARLA’s functionality.
Figure 4: CARLA Simulation Environment Framework.
The CARLA server is the core of the virtual en-
vironment where simulations are hosted. The simu-
lation can be customized and controlled as required
via clients. A client is started by executing a Python
script. Communication between clients and the server
is established over a Transmission Control Protocol
(TCP.).
As shown in Figure 4, three clients are used for
the simulation. The ‘Scenario Runner’ client sets the
stage for the SOTIF.-related Use Case by utilizing
a configuration file that specifies the weather condi-
tions, virtual map layout, and the vehicle dynamics.
Simultaneously, the ‘Manual Control’ client,
linked to the ‘Scenario Runner’ for initializing the
Ego-Vehicle’s characteristics, allows for independent
vehicle control outside the Scenario Runner’s domain.
The ‘Data-Generation’ client systematically struc-
tures the data storage folders, converts the simulation
output into the required formats, and compiles the
data. The resulting dataset, as described in Chapter
2.2, is prepared for subsequent data processing in 3D
object detection application.
VEHITS 2024 - 10th International Conference on Vehicle Technology and Intelligent Transport Systems
418
2.4 Point Cloud-Based 3D Object
Detection Methods
The workflow for 3D object detection is presented in
the accompanying Figure 5.
Figure 5: Overview of point cloud-based object detection.
The simulation produces a dataset comprising
point clouds, files in binary format encoding the 3D
spatial data collected by LiDAR. sensors. Ground
truth data, in text format, providing object location
and size within the point clouds.
3D object detection methods that utilize DL. mod-
els are employed to process the simulation-based gen-
erated dataset as input. The methodologies, operating
as a “Black Box”, transform the input data into output
predictions, represented by bounding boxes around
detected objects within the point clouds. Two toolkits
were employed: MMDetection3D and OpenPCDet.
DL.-based 3D object detection methods can be de-
scribed by a uniform architecture. The structure con-
sists of three blocks (Fernandes et al., 2021):
• Data Representation
• Feature Extraction
• Detection Network
Figure 6 shows the general structure of point cloud-
based 3D object detection methods.
Figure 6: General structure of a 3D Object Detection model
according to (Fernandes et al., 2021).
2.4.1 Data Representation
Data representation refers to the process of transform-
ing raw data into a structured format that can be ef-
ficiently processed by DL. models. There are sev-
eral types of data representation approaches, includ-
ing: (Fernandes et al., 2021).
Point-Based. The point cloud is processed directly.
For each point, a feature vector is extracted,
in which the neighboring properties are added.
The low-dimensional properties of the individual
points are combined into high-dimensional prop-
erties (Fernandes et al., 2021), (Qi et al., 2017).
Voxel-Based. The point cloud is segmented into
uniformly sized voxels, representing values on a
3D grid, allowing for aggregation of points within
each voxel (Fernandes et al., 2021), (Zhou and
Tuzel, 2018).
Figure 7: Division of the 3D space into voxels.
Pillar-Based. Point clouds are divided into vertical
columns pillars that are located on a uniform 2D
grid (x-y plane). The height of the column is equal
to the number of points above the corresponding
grid position (Fernandes et al., 2021), (Lang et al.,
2019).
Figure 8: Transferring point cloud information into pillars.
Frustums-Based. Point clouds are converted into
frustums. To do this, an image-based object de-
tection method is first applied. In an image, a
possible region in which an object can be located
is detected. The image is then projected into the
three-dimensional point cloud, creating a trun-
cated cone (Fernandes et al., 2021), (Qi et al.,
2018).
2D-Projections-Based. Three-dimensional LiDAR.
point cloud data is converted into a 2D projec-
Simulation-Based Performance Evaluation of 3D Object Detection Methods with Deep Learning for a LiDAR Point Cloud Dataset in a
SOTIF-related Use Case
419
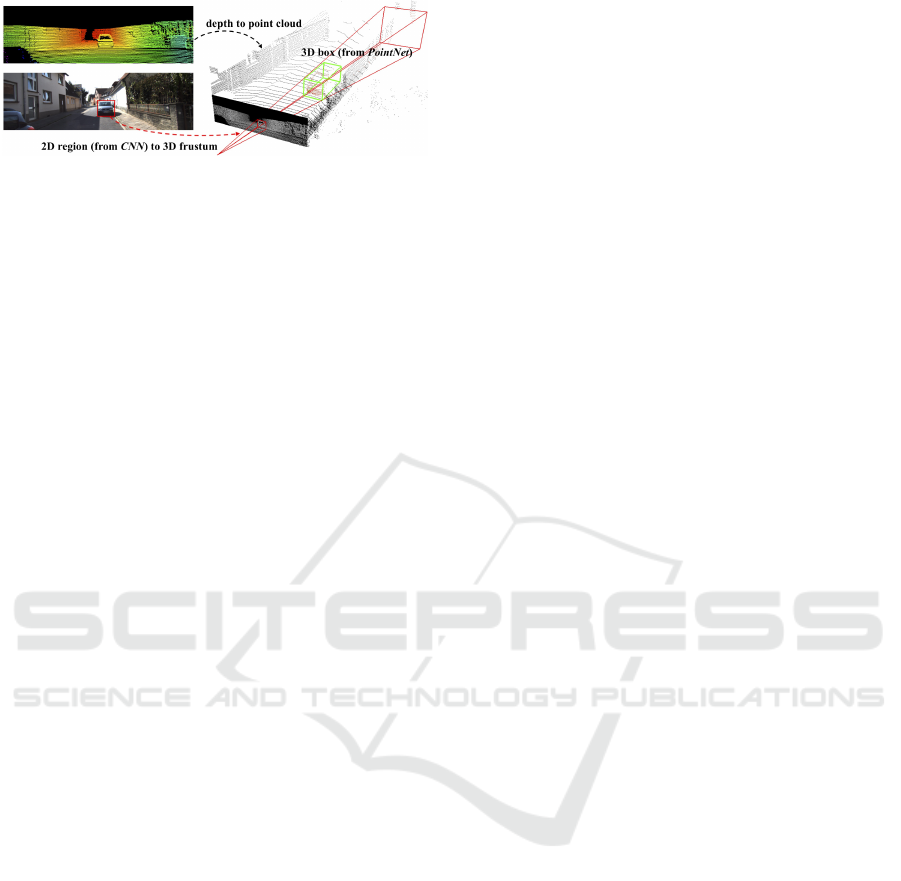
Figure 9: Generation of a frustum representation on the ba-
sis of an image (Qi et al., 2018).
tion. Different projection schemes can be used:
frontal view, area view, or bird’s-eye view (Fer-
nandes et al., 2021).
Point-based and voxel-based methods are com-
putationally intensive than methods in which the
data is transformed from three-dimensional to two-
dimensional space (Fernandes et al., 2021).
2.4.2 Feature Extraction
It extracts low- and high-dimensional features to cre-
ate a feature map. Optimised feature extraction is
the basis for subsequent object classification at a later
stage (Fernandes et al., 2021). A distinction is made
between different methods for feature extraction:
Point-by-Point Feature Extraction. The whole
point cloud is processed to extract features indi-
vidually from points, subsequently creating a col-
lective high-dimensional feature set (Fernandes
et al., 2021).
Segment-Wise Feature Extraction. Segmentation
of the point cloud precedes point-by-point classi-
fication, improving efficiency and reducing com-
putational load (Fernandes et al., 2021).
Object-by-Object Feature Extraction. Initial 2D
object detection is performed to create 3D bound-
ing boxes, thus narrowing the search to regions
containing objects of interest (Fernandes et al.,
2021).
Convolutional Neural Networks (CNNs.). Point
clouds are inherently sparse, making direct 3D
data processing time-consuming and computa-
tionally intensive. The inherent sparsity of point
clouds is leveraged by CNNs. to reduce the num-
ber of points considered (Fernandes et al., 2021).
2.4.3 Detection Network
It includes the determination of object classes, bound-
ing box regression, and orientation assessment, occa-
sionally considering object velocity (Fernandes et al.,
2021).
Detector Architectures. An additional detection
network is used, with which the detection of the
data is carried out, as shown in Figure 6.
• Single Stage. Utilizes a singular network for
detection.
• Dual Stage. Employs an additional network to
refine predictions.
Dual-stage detectors are typically more accurate but
slower, while single-stage detectors are more efficient
and less time-consuming, which makes them easier to
apply to real-time systems (Fernandes et al., 2021).
Detection Module Techniques
• Region Proposal Based. Generates Region
of Interest (RoI.) using a low-level algorithm.
These proposed regions are then further pro-
cessed and analyzed by subsequent stages of
the detection system to determine the presence
and characteristics of objects within those re-
gions.
• Anchorless Detectors. Suitable for occluded
or truncated objects, these detectors do not pre-
define candidate regions.
Data conversion to OBJ format standardizes eval-
uation by providing a consistent format for comparing
predictions with ground truth locations.
2.5 Performance Evaluation
The selection of appropriate performance evaluation
metrics for 3D point cloud-based object detection
methods depends on the characteristics of the point
cloud data and the specific context. As dataset is
prepared in KITTI format, AP. and recall are used
as performance evaluation metric, aligning with es-
tablished benchmark of MMDetection3D and Open-
PCDet toolkits for applicability of the results.
3D object detection involves encapsulating ob-
jects within predicted bounding boxes, using point
cloud data as input. A predicted bounding box for
each object is represented by a vector of its center co-
ordinates, dimensions, orientation, and class: (Skoog,
2024)
B “ rx, y, z, l, w, h, θ, classs
The coordinates px, y, zq denotes the center position of
the object within the three-dimensional space. The
dimensions of the object are encapsulated by pl, w, hq,
outlining the extent of the bounding box that encloses
it. The orientation of this bounding box is conveyed
through θ, which represents its rotation around the
Y -axis in camera sensor coordinates. Additionally,
the class parameter specifies the type of the object,
differentiating between multiple entities within the
VEHITS 2024 - 10th International Conference on Vehicle Technology and Intelligent Transport Systems
420
dataset. Notably, in the dataset generated from the
SOTIF.-related Use Case, the class parameter is uni-
formly ‘Car’ (Skoog, 2024).
A confusion matrix presented in Table 2 is piv-
otal in evaluating the performance of DL. models
for object detection. This matrix is composed of
four elements, reflecting the model’s detection accu-
racy against the ground truth. These elements are:
True Positive (TP.), False Positive (FP.), True Neg-
ative (TN.), and False Negative (FN.) (Sharath and
Mehran, 2021).
True Positive (TP). Correctly detected objects by
the DL. model that are present in the ground truth.
False Positives (FP). Objects detected by the DL.
model that do not exist in the ground truth.
True Negatives (TN). Correct non-detection, where
the DL. model correctly identifies that no object
is present in the ground truth.
False Negatives (FN). objects that are present in the
ground truth but are not detected by the DL. mod-
els.
Table 2: Confusion Matrix for Object Detection using DL.
Model, adapted from (Sharath and Mehran, 2021).
DL. Model Prediction
Ground Truth
Object Detected No Object Detected
TP (True Positive) FN (False Negative) Object Present
FP (False Positive) TN (True Negative) No Object Present
Precision and Recall are two metrics derived from
the confusion matrix. Precision is the ability of a DL.
to identify only relevant objects. It is the percent-
age of correct positive predictions. While Recall ex-
presses the ratio of correctly detected objects to the to-
tal number of existing ground-truth objects of a class.
Precision “
T P
T P ` FP
(1)
Recall “
T P
T P ` FN
(2)
There’s a trade-off between Precision and Recall.
Predicting many bounding boxes may yield high Re-
call but low Precision. Conversely, predicting only
certain boxes may result in high Precision but low Re-
call (Padilla et al., 2020).
AP. is a metric obtained using a Precision-Recall
curve and is the equivalent to the integral of the Pre-
cision as a function of Recall. The AP. metric is usu-
ally averaged over a set of classes, and it provides a
measure of the model’s Precision-Recall performance
across different thresholds (Padilla et al., 2020).
Intersection over Union (IoU.) quantifies the over-
lap between predicted and ground truth bounding
boxes. An IoU. threshold is used to classify predic-
tions. A prediction is considered correct if IoU. is
greater than or equal to threshold and incorrect other-
wise (Padilla et al., 2020).
IoU “
Area of Overlap
Area of Union
(3)
For the KITTI dataset, the AP. is calculated at an IoU.
threshold of 0.70, signifying the required overlap be-
tween predicted and ground truth bounding boxes.
AP. is further evaluated using 11-point and 40-point
interpolation methods (AP
11
and AP
40
).
AP
11
is calculated by interpolating Precision at 11
equally spaced Recall levels. The Recall levels for
AP
11
are t0.0, 0.1, . . . , 1.0u. At each Recall level R,
the maximum Precision from all Recall levels greater
than or equal to R is considered. The average of these
maximum Precision values yields AP
11
(Padilla et al.,
2020).
AP
11
“
1
11
ÿ
RPt0.0,0.1,...,0.9,1.0u
P
interp
pRq, (4)
Similarly, AP
40
is calculated using 40 Recall levels,
providing a finer granularity in the Precision-Recall
curve.
AP
40
“
1
40
ÿ
RPt0.025,0.05,...,0.975,1.0u
P
interp
pRq, (5)
For both AP
11
and AP
40
, P
interp
pRq represents the in-
terpolated Precision at Recall level R, defined as:
P
interp
pRq “ max
˜
R:
˜
RěR
Pp
˜
Rq, (6)
where
˜
R ranges over all Recall levels greater than or
equal to R (Padilla et al., 2020).
OpenPCDet toolkit facilitates a evaluation of dual-
stage detectors by using Recall metrics at IoU. thresh-
olds, specifically 0.30 and 0.50. The Recall metric is
calculated after the entire dual-stage detection process
and indicates how effectively the model detects and
classifies objects, at specified IoU. thresholds.
In dual-stage detectors, as explained in chapter
2.4, the first stage involves the Region Proposal Net-
work (RPN.), which identifies potential object loca-
tions.
The Recall at this stage, referred to as ‘Recall at
RoI.’, is calculated post-RPN. stage and signifies the
the rate at which the RPN. successfully identifies ac-
tual objects within its proposed areas, adhering to the
Simulation-Based Performance Evaluation of 3D Object Detection Methods with Deep Learning for a LiDAR Point Cloud Dataset in a
SOTIF-related Use Case
421
specified IoU. thresholds. The subsequent stage re-
fines the RPN.’s initial proposals, sharpening the ob-
ject boundaries and accurately classifying each ob-
ject, and is assessed by the ‘Recall at R-CNN.’ (Shi
et al., 2019), (OpenPCDet Development Team, 2020).
3 IMPLEMENTATION
This chapter details the implementation of the
methodology defined in the chapter 2, specifically fo-
cusing on the generation of a LiDAR. point cloud
dataset using the CARLA simulation environment,
the application of SOTA. 3D object detection meth-
ods, and the subsequent performance evaluation.
3.1 Dataset Generation from CARLA
Utilizing the CARLA Scenario Runner extension, the
SOTIF.-related Use Case is modeled following the
procedure outlined in Chapter 2.3 (CARLA Docu-
mentation: ScenarioRunner, 2023).
Using the CARLA Scenario Runner extension, the
SOTIF.-related Use Case was modeled, adhering to
the procedure specified in Chapter 2.3. This setup
facilitated the definition of environmental parame-
ters, vehicle behavior, and the arrangement of objects
within the simulation.
The simulation parameters were set through an
XML configuration file, detailing the virtual map, ve-
hicle models, and weather settings. Medium-sized
vehicle models with light colors were chosen for
LiDAR. sensor visibility, with the Dodge Charger se-
lected for both the lead and following vehicles, while
the Mercedes Coupe was used for the Ego-vehicle, as
shown in Figure 10.
Python scripts, using the pyTree package, were
employed to define the driving scenario’s behavior,
including vehicle maneuvers and positioning. A sep-
arate CARLA client was tasked with data generation,
structured akin to the KITTI dataset. The script for
dataset generation from (Bai et al., 2022) served as
the reference, which was modified to adapt the SO-
TIF Use Case description.
Each data frame included point cloud data and
synchronized ground-truth and image data, with
frame numbering following a sequential pattern,
recording every fifth frame to capture significant dif-
ferences in the 10Hz LiDAR. data. Maintaining syn-
chronization between server and data collection client
was essential. In synchronous mode, the server ad-
vances time-steps only after all clients have com-
pleted their tasks.
Figure 10: Simulation of the SOTIF-related Use Case in
CARLA.
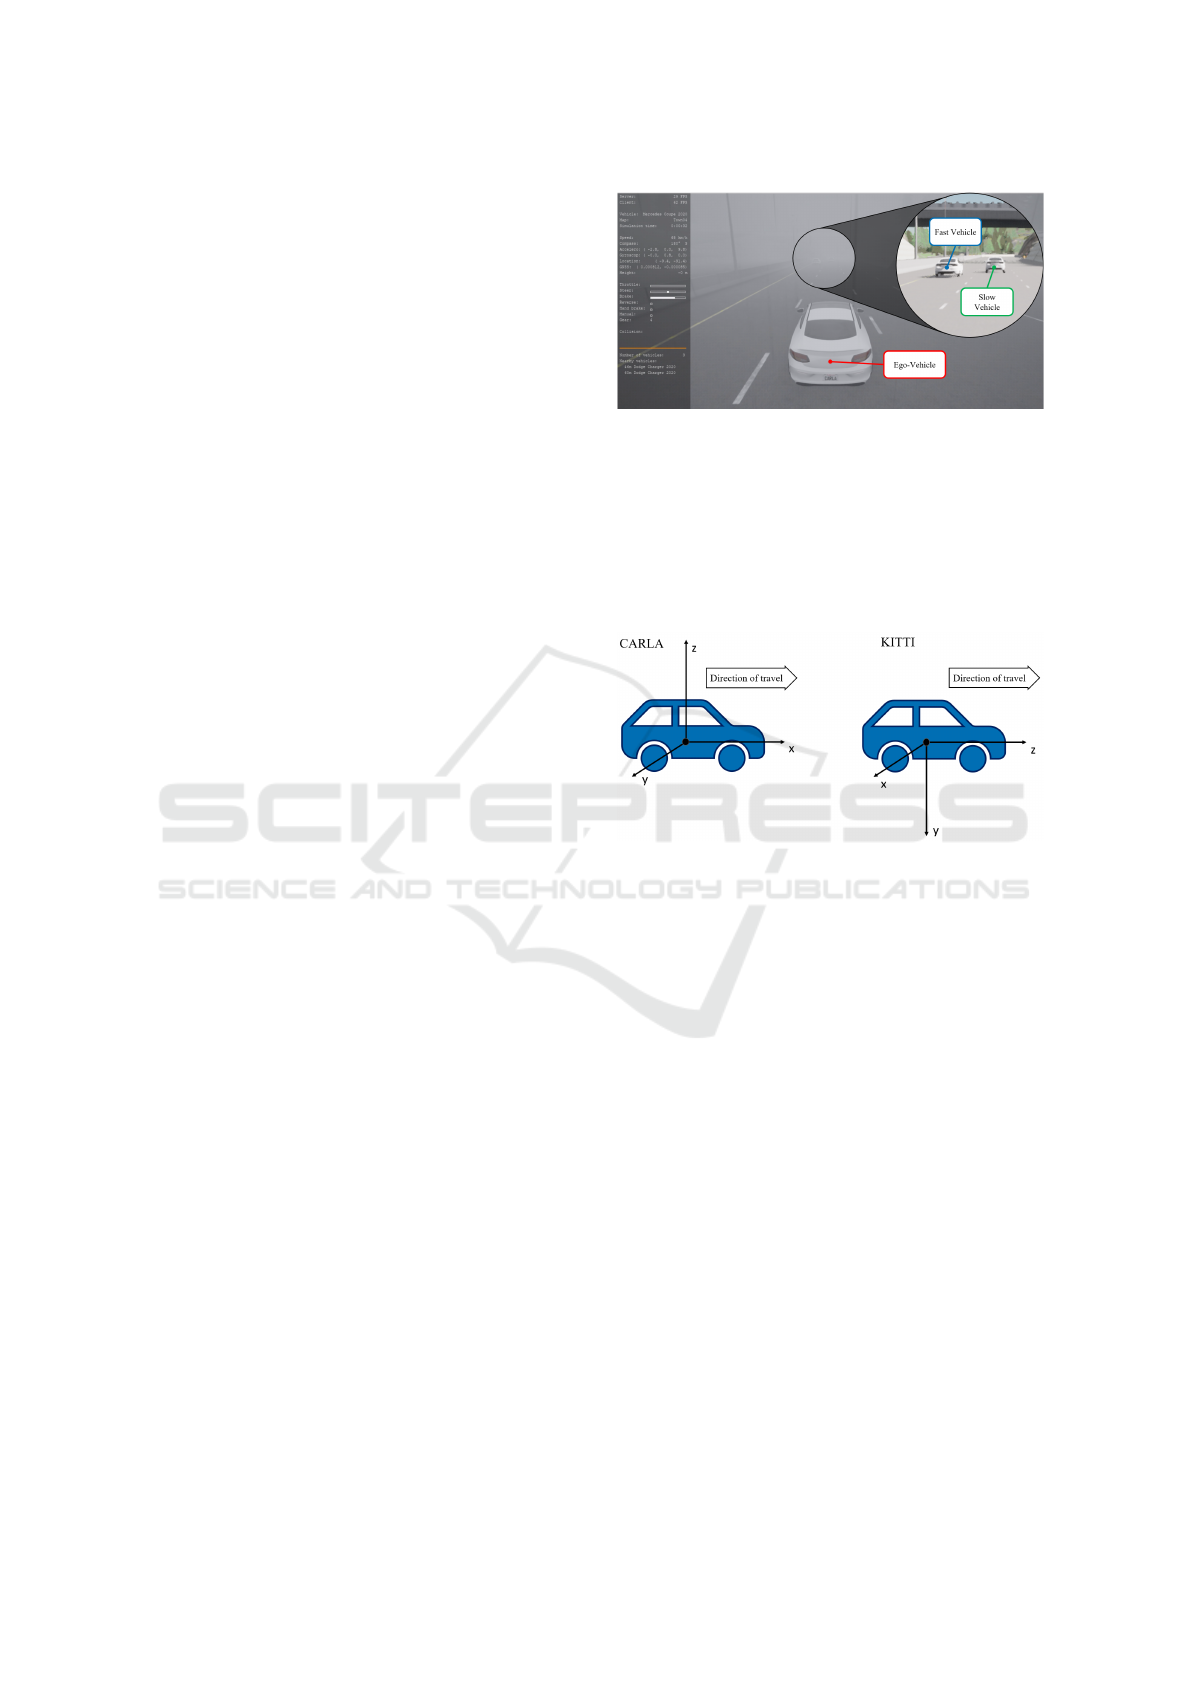
A significant consideration was the difference
in coordinate systems between CARLA and KITTI
datasets. CARLA uses a left-handed coordinate sys-
tem, while KITTI uses a right-handed system, neces-
sitating adjustments when saving ground truth bound-
ing box coordinates.
Figure 11: Comparative illustration of CARLA and KITTI
coordinate systems.
Before applying 3D object detection methods, the
dataset was preprocessed to reorganize ground-truth
data and create necessary files in Pickle (.pkl) format
for bounding box processing. Employing pre-trained
models from MMDetection3D and OpenPCDet, ob-
ject detection was executed, enabling the comparison
of predicted bounding boxes with the ground truth.
Figure 12 shows the overview of the generated
SOTIF.-related dataset in form of images. The dataset
consists of 547 frames, primarily allocated for perfor-
mance testing of a pre-trained DL. models, with 492
frames dedicated to the test set and 55 frames to the
validation set.
3.2 Application of 3D Object Detection
Methods
The computational system used was equipped with an
Nvidia Quadro RTX 3000 GPU and an Intel Core i7-
10850H CPU, with 64 GB of RAM, operating on both
Microsoft Windows and Ubuntu, due to different soft-
ware compatibility requirements.
MMDetection3D and OpenPCDet were chosen
VEHITS 2024 - 10th International Conference on Vehicle Technology and Intelligent Transport Systems
422
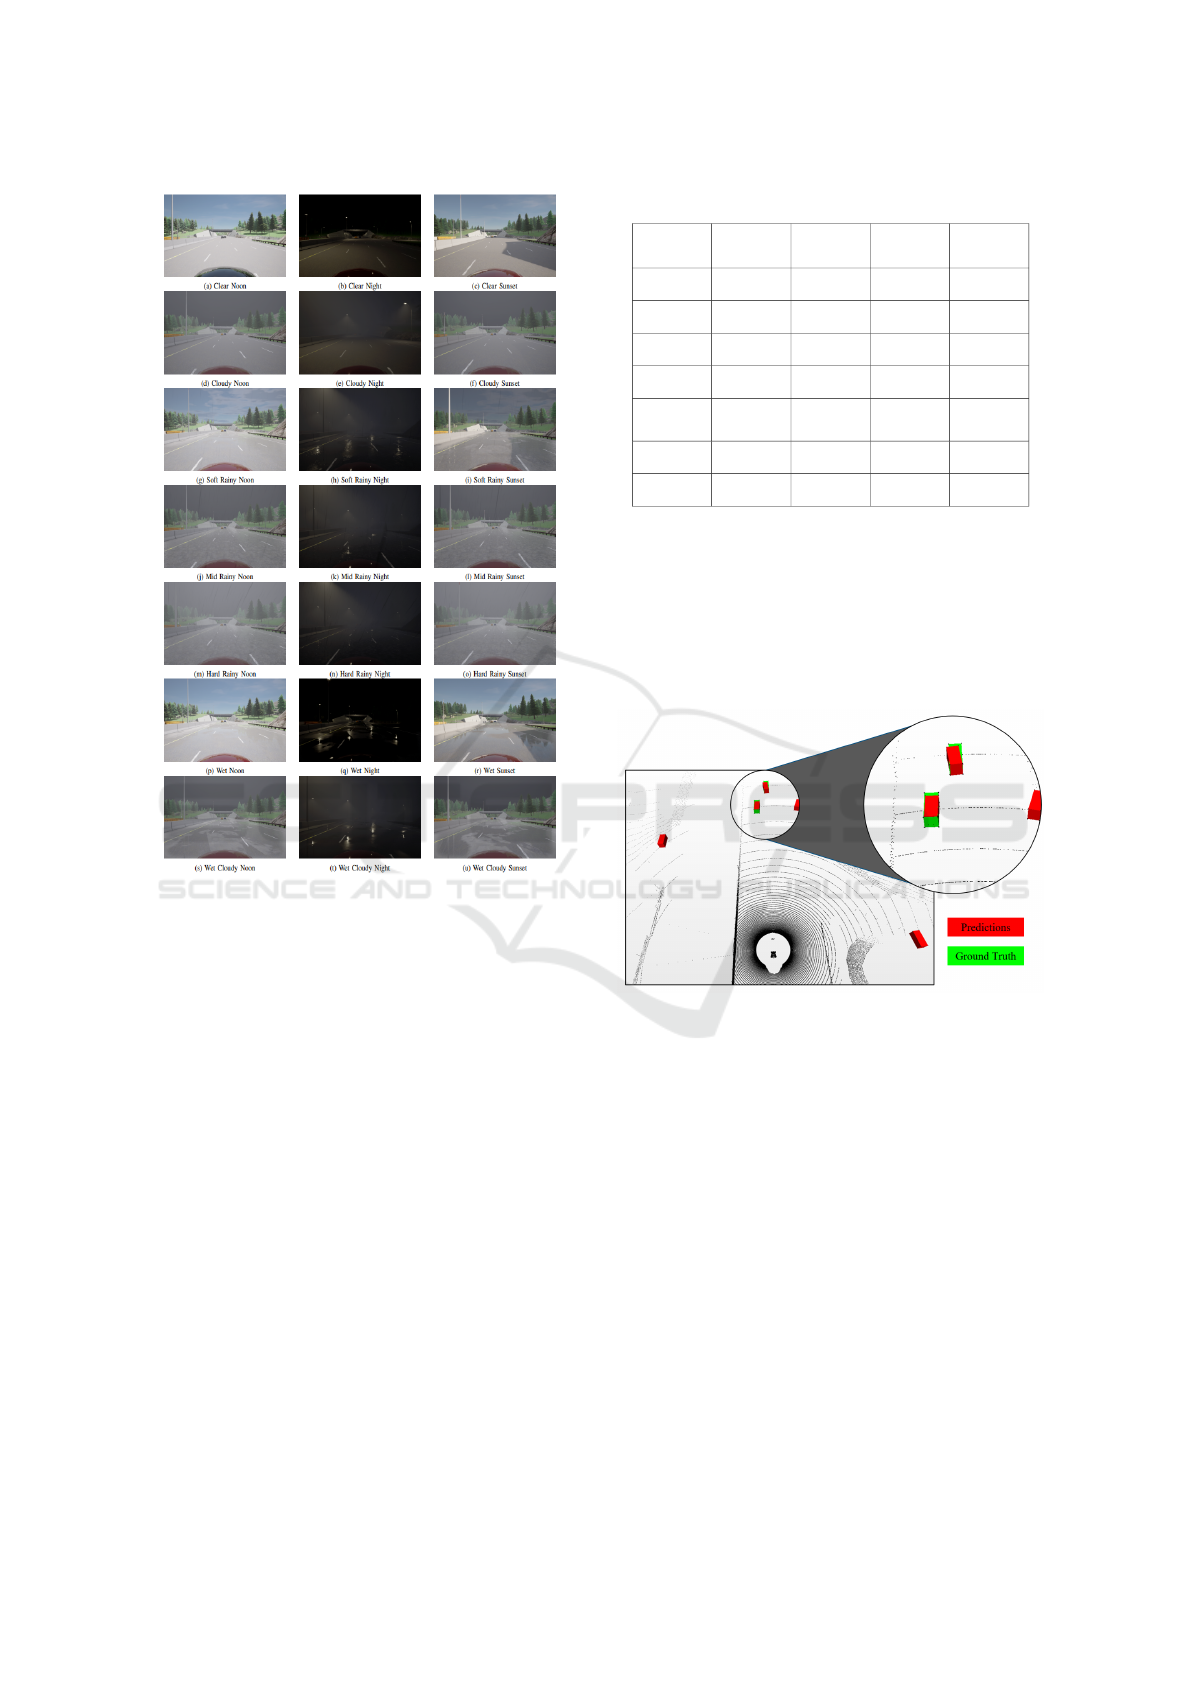
Figure 12: Overview of the generated dataset from SOTIF.-
related Use Case depicting diverse weather conditions.
for their collection of pre-trained DL. models, a broad
range of SOTA. 3D object detection methods, stan-
dardized benchmarking framework, and DL. model
files tailored for simulation-based generated custom
datasets.
The focus is on evaluating the adaptability and
performance of SOTA. 3D object detection by us-
ing pre-trained models, trained on the KITTI dataset
and testing them against a simulation-based generated
dataset. Pre-trained models offer the advantage of
saving substantial time and computational resources
by utilizing networks that have been trained on exten-
sive and diverse datasets.
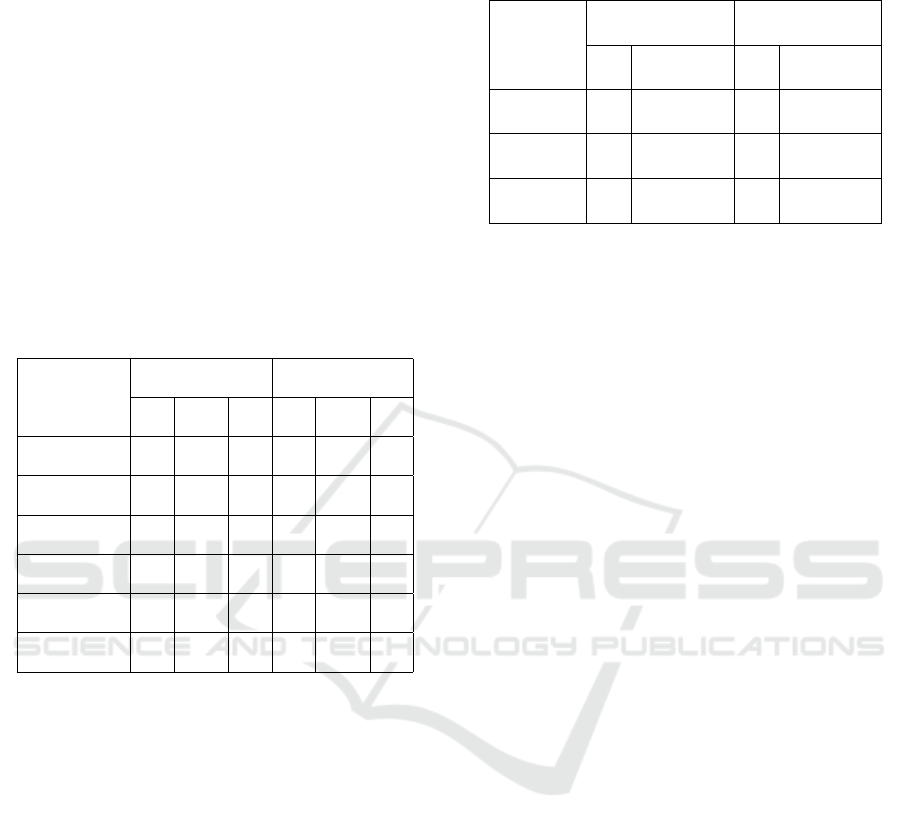
Table 3 provides a detailed comparison of the ap-
plied SOTA. 3D object detection methods. It high-
lights the methods, their data representation, feature
extraction techniques, detection architectures, and the
toolkits that support them.
However, the application of 3D object detection
methods to simulation-based datasets can introduce
challenges. Factors including the domain gap be-
Table 3: SOTA. 3D Object Detection Methods.
Methods
Data
Representation
Feature
Extraction
Detection
Architecture
Supported
Toolkit
Part-A
2
.
(Shi et al., 2021)
Point-based Point-by-point dual-stage MMDetection3D and
OpenPCDet
PV-RCNN.
(Shi et al., 2020)
Voxel-based Segment-wise dual-stage MMDetection3D
PointPillars.
(Lang et al., 2019)
Pillar-based CNN. single-stage MMDetection3D and
OpenPCDet
MVX-Net.
(Sindagi et al., 2019)
Voxel-based CNN. dual-stage MMDetection3D
Dynamic Voxeliza-
tion
(Zhou et al., 2019)
Voxel-based CNN. single-stage MMDetection3D
SECOND.
(Yan et al., 2018)
Voxel-based CNN. single-stage MMDetection3D and
OpenPCDet
PointRCNN.
(Shi et al., 2019)
Point-based Point-by-point dual-stage OpenPCDet
tween simulated and real-world scenarios, discrepan-
cies in sensor characteristics, and variations in data
distribution lead to mismatches in data characteristics
and potentially impede the accuracy of the DL. mod-
els.
Figure 13 displays a point cloud visualization,
demonstrating the application of an object detection
method within the MeshLab tool.
Figure 13: Visualisation of point cloud data and 3D object
detection results in MeshLab.
The point cloud, illustrated as a grayscale back-
drop of lines and dots, represents the environment
captured by simulation. Within this environment, red
boxes highlight the objects as predicted by the detec-
tion method, while green boxes illustrate their verified
actual positions, referred to as the ground truth. The
performance of the object detection method is deter-
mined by the degree of overlap between the red and
green boxes.
Simulation-Based Performance Evaluation of 3D Object Detection Methods with Deep Learning for a LiDAR Point Cloud Dataset in a
SOTIF-related Use Case
423
4 PERFORMANCE EVALUATION
RESULTS
This chapter compares the performance of 3D object
detection methods applied to generated dataset from a
SOTIF-related Use Case, using MMDetection3D and
OpenPCDet toolkits.
MMDetection3D
The Table 4 shows the performance comparison of 3D
object detection methods across “easy”, “moderate”,
and “hard” difficulty levels, measured by AP
11
and
AP
40
at an IoU. of 0.70 (Geiger et al., 2012).
Table 4: AP. performance comparison of 3D object detec-
tion methods using MMDetection3D.
Method
AP
11
, (IoU.=0.70) AP
40
, (IoU.=0.70)
Easy Moderate Hard Easy Moderate Hard
Part-A
2
. 85.5935 75.9445 75.4239 86.5662 77.8658 75.6141
PV-RCNN. 89.7738 88.0915 87.3886 89.7959 82.2261 79.5364
PointPillars. 86.2029 76.9022 74.0742 94.8259 90.9872 87.7803
MVX-Net. 81.9914 70.9114 71.7628 82.8947 70.6838 70.3484
Dynamic Voxelization 89.4193 87.8190 85.8189 93.2262 80.2123 70.8684
SECOND. 87.0021 76.9475 74.8431 88.5588 81.4183 75.3544
The comparison shows that PV-RCNN. and
PointPillars. exhibit higher AP. values, in “easy” con-
ditions.
OpenPCDet
The Table 5, presents performance comparison of 3D
object detection methods using the Recall metric at
IoU. thresholds of 0.30 and 0.50 for RoI. and R-CNN.
stages.
The results maintain a consistent recall rate above
50% at the lower IoU. threshold of 0.30, with a no-
ticeable decline at the higher threshold of 0.50.
The implications of these results are twofold.
First, they confirm the feasibility of using pre-
trained models on simulation-based generated custom
dataset. Second, the difference in performance across
difficulty levels and IoU. thresholds underscores the
need for further optimization and potential customiza-
tion of DL. models to bridge the gap between simu-
lated and real-world data accuracy.
Table 5: Recall performance comparison of 3D object de-
tection methods using OpenPCDet.
Method
Recall, (IoU.=0.30) Recall, (IoU.=0.50)
RoI. R-CNN. RoI. R-CNN.
Part-A
2
. 0.516 0.515 0.354 0.346
PointRCNN. 0.450 0.460 0.232 0.288
SECOND. 0.515 0.5158 0.369 0.369
5 CONCLUSION AND FUTURE
WORK
This paper investigates the application of 3D object
detection methods in a Use Case related to Safety Of
The Intended Functionality (SOTIF). The methodol-
ogy and implementation, detailed in chapters 2 and 3,
address RQ1 and RQ2 (described in sub-chapter 1.2).
The approach to preparing a dataset from a
SOTIF-related Use Case simulation involved us-
ing the CARLA simulation environment to model
a SOTIF-related Use Case, capturing 21 diverse
weather conditions. The resultant dataset, structured
in KITTI format, ensures compatibility and adaptabil-
ity with State-of-the-Art (SOTA) 3D object detection
methods designed for LiDAR point cloud datasets us-
ing Deep Learning (DL) models.
MMDetection3D and OpenPCDet toolkits were
employed to assess the compatibility of SOTA.
3D object detection methods, including Part-A
2
.,
PV-RCNN., PointPillars., MVX-Net., Dynamic Vox-
elization SECOND., and PointRCNN.. Performance
was benchmarked using pre-trained DL models, ini-
tially trained on the KITTI dataset, against the dataset
generated from the SOTIF-related Use Case simula-
tion.
Chapter 4 presents the performance evaluation of
these methods, using Average Precision (AP) and re-
call metrics. The results demonstrate the effectiveness
of these methods, offering detailed insights into their
performance across different IoU. thresholds, thereby
addressing RQ3. Based on the results, a key recom-
mendation is to focus on optimizing and customiz-
ing DL. models to improve their performance on sim-
ulated datasets. Adding more complex scenarios to
the dataset could help reduce the performance gap be-
tween simulated and real-world data.
For future work, evaluating the uncertainty in 3D
object detection models is a promising direction. This
approach involves quantifying the confidence of DL.
VEHITS 2024 - 10th International Conference on Vehicle Technology and Intelligent Transport Systems
424

models in their predictions. Incorporating uncertainty
evaluation allows for the identification of areas where
DL. models are less reliable, guiding efforts to im-
prove data, models, and training processes. Focus-
ing on uncertainty can enhance model interpretability
and trustworthiness, making it particularly valuable in
scenarios where making the correct decision is criti-
cal.
REFERENCES
Abrecht, S., Hirsch, A., Raafatnia, S., and Woehrle, M.
(2023). Deep learning safety concerns in automated
driving perception. arXiv preprint arXiv:2309.03774.
Ai, X., He, Q., and Zhang, P. (2023). Analysis of deep
learning object detection methods. In Shuhong Ba
and Fan Zhou, editors, Third International Confer-
ence on Machine Learning and Computer Application
(ICMLCA 2022), volume 12636, page 1263613. SPIE.
Arzhanov, A. (2019). 3d object detection from point cloud.
Bai, Z., Wu, G., Barth, M. J., Liu, Y., Sisbot, E. A., and
Oguchi, K. (2022). Pillargrid: Deep learning-based
cooperative perception for 3d object detection from
onboard-roadside lidar. pages 1743–1749.
CARLA Documentation: ScenarioRunner (12.09.2023).
Carla scenario runner.
CARLA Documentation: WeatherParameters Class
(17.01.2024). Carla weather parameters.
Dong, J., Cong, Y., Sun, G., Wang, L., Lyu, L., Li, J.,
and Konukoglu, E. (2023). Inor-net: Incremental 3-d
object recognition network for point cloud represen-
tation. IEEE Transactions on Neural Networks and
Learning Systems, 34(10):6955–6967.
Dosovitskiy, A., Ros, G., Codevilla, F., Lopez, A., and
Koltun, V. (2017). Carla: An open urban driving sim-
ulator. In Conference on robot learning, pages 1–16.
Dworak, D., Ciepiela, F., Derbisz, J., Izzat, I., Ko-
morkiewicz, M., and Wójcik, M. (2019). Perfor-
mance of lidar object detection deep learning architec-
tures based on artificially generated point cloud data
from carla simulator. In 2019 24th International Con-
ference on Methods and Models in Automation and
Robotics (MMAR), pages 600–605.
Elharrouss, O., Hassine, K., Zayyan, A., Chatri, Z., Al-
Maadeed, S., Abualsaud, K., et al. (2023). 3d objects
and scenes classification, recognition, segmentation,
and reconstruction using 3d point cloud data: A re-
view. arXiv preprint arXiv:2306.05978.
Fernandes, D., Silva, A., Névoa, R., Simões, C., Gonzalez,
D., Guevara, M., Novais, P., Monteiro, J., and Melo-
Pinto, P. (2021). Point-cloud based 3d object detec-
tion and classification methods for self-driving appli-
cations: A survey and taxonomy. Information Fusion,
68:161–191.
Geiger, A., Lenz, P., and Urtasun, R. (2012). Are we ready
for autonomous driving? the kitti vision benchmark
suite. In 2012 IEEE Conference on Computer Vision
and Pattern Recognition, pages 3354–3361.
Guo, Y., Wang, H., Hu, Q., Liu, H., Liu, L., and Ben-
namoun, M. (2021). Deep learning for 3d point
clouds: A survey. IEEE Transactions on Pattern Anal-
ysis and Machine Intelligence, 43(12):4338–4364.
Huang, Z., Zheng, Z., Zhao, J., Hu, H., Wang, Z., and Chen,
D. (2023). Psa-det3d: Pillar set abstraction for 3d ob-
ject detection. Pattern Recognition Letters, 168:138–
145.
Lang, A. H., Vora, S., Caesar, H., Zhou, L., Yang, J.,
and Beijbom, O. (2019). Pointpillars: Fast encoders
for object detection from point clouds. In 2019
IEEE/CVF Conference on Computer Vision and Pat-
tern Recognition (CVPR), pages 12689–12697.
Li, C., Ren, Y., and Liu, B. (2023). Pcgen: Point cloud
generator for lidar simulation. In 2023 IEEE In-
ternational Conference on Robotics and Automation
(ICRA), pages 11676–11682.
Lin, J., Yin, H., Yan, J., Ge, W., Zhang, H., and Rigoll, G.
(2022). Improved 3d object detector under snowfall
weather condition based on lidar point cloud. IEEE
Sensors Journal, 22(16):16276–16292.
Mehta, T., Riddhi, L., and Mohana (2023). Simulation and
performance analysis of 3d object detection algorithm
using deep learning for computer vision applications.
In 2023 2nd International Conference on Applied Ar-
tificial Intelligence and Computing (ICAAIC), pages
535–541.
MMDetection3D Team (2020). Mmdetection3d: Openmm-
lab: next-generation platform for general 3d object de-
tection.
OpenPCDet Development Team (2020). Openpcdet: An
open-source toolbox for 3d object detection from
point clouds.
Padilla, R., Netto, S. L., and Da Silva, E. A. B. (2020).
A survey on performance metrics for object-detection
algorithms. In 2020 International Conference on Sys-
tems, Signals and Image Processing (IWSSIP), pages
237–242.
Peng, L., Li, J., Shao, W., and Wang, H. (2023). Peso-
tif: a challenging visual dataset for perception sotif
problems in long-tail traffic scenarios. In 2023 IEEE
Intelligent Vehicles Symposium (IV), pages 1–8.
Qi, C. R., Liu, W., Wu, C., Su, H., and Guibas, L. J. (2018).
Frustum pointnets for 3d object detection from rgb-
d data. In 2018 IEEE/CVF Conference on Computer
Vision and Pattern Recognition, pages 918–927.
Qi, C. R., Su, H., Mo, K., and Guibas, L. J. (2017). Point-
net: Deep learning on point sets for 3d classification
and segmentation. In Proceedings of the IEEE con-
ference on computer vision and pattern recognition,
pages 652–660.
R, S., Durbha, S. S., and Singh, G. (2023). 3d object detec-
tion in lidar point clouds using graph neural networks.
arXiv preprint arXiv:2301.12519.
Ruan, H., Xu, B., Gao, J., Liu, L., Lv, J., Sheng, Y., and
Zeng, Z. (2023). Gnet: 3d object detection from point
cloud with geometry-aware network. In 2022 IEEE
International Conference on Cyborg and Bionic Sys-
tems (CBS), pages 190–195.
Simulation-Based Performance Evaluation of 3D Object Detection Methods with Deep Learning for a LiDAR Point Cloud Dataset in a
SOTIF-related Use Case
425

Sharath, M. N. and Mehran, B. (2021). A literature review
of performance metrics of automated driving systems
for on-road vehicles. Frontiers in Future Transporta-
tion.
Shi, S., Guo, C., Jiang, L., Wang, Z., Shi, J., Wang, X., and
Li, H. (2020). Pv-rcnn: Point-voxel feature set ab-
straction for 3d object detection. In 2020 IEEE/CVF
Conference on Computer Vision and Pattern Recogni-
tion (CVPR), pages 10526–10535.
Shi, S., Wang, X., and Li, H. (2019). Pointrcnn: 3d object
proposal generation and detection from point cloud. In
2019 IEEE/CVF Conference on Computer Vision and
Pattern Recognition (CVPR), pages 770–779.
Shi, S., Wang, Z., Shi, J., Wang, X., and Li, H. (2021).
From points to parts: 3d object detection from point
cloud with part-aware and part-aggregation network.
IEEE Transactions on Pattern Analysis and Machine
Intelligence, 43(8):2647–2664.
Sindagi, V. A., Zhou, Y., and Tuzel, O. (2019). Mvx-net:
Multimodal voxelnet for 3d object detection. In 2019
International Conference on Robotics and Automation
(ICRA), pages 7276–7282.
Skoog, S. (2024). Lidar perception in a virtual environment
using deep learning: A comparative study of state-of-
the-art 3d object detection models on synthetic data.
Xu, B., Rong, Y., and Zhao, M. (2022). 3d object detection
for point cloud in virtual driving environment. In 2022
IEEE International Symposium on Product Compli-
ance Engineering - Asia (ISPCE-ASIA), pages 1–5.
Yan, Y., Mao, Y., and Li, B. (2018). Second: Sparsely em-
bedded convolutional detection. Sensors, 18(10).
Yin, H. and Berger, C. (2017). When to use what data set for
your self-driving car algorithm: An overview of pub-
licly available driving datasets. In 2017 IEEE 20th In-
ternational Conference on Intelligent Transportation
Systems (ITSC), pages 1–8.
Zhang, D., Wang, X., Zheng, Z., Liu, X., and Fang, G.
(2023). Arfa: Adaptive reception field aggregation for
3-d detection from lidar point cloud. IEEE Sensors
Journal, 23(11):11156–11167.
Zhou, Y., Sun, P., Zhang, Y., Anguelov, D., Gao, J., Ouyang,
T. Y., Guo, J., Ngiam, J., and Vasudevan, V. (2019).
End-to-end multi-view fusion for 3d object detection
in lidar point clouds. ArXiv, abs/1910.06528.
Zhou, Y. and Tuzel, O. (2018). Voxelnet: End-to-end learn-
ing for point cloud based 3d object detection. In
2018 IEEE/CVF Conference on Computer Vision and
Pattern Recognition (CVPR), pages 4490–4499, Los
Alamitos, CA, USA. IEEE Computer Society.
APPENDIX
Supplementary Data
The dataset and the associated script is available at the
following link: https://dx.doi.org/10.21227/j43q-z57
8.
Abbreviations
ADS. Automated Driving System
AP. Average Precision
CNN. Convolutional Neural Network
DL. Deep Learning
FN. False Negative
FP. False Positive
IoU. Intersection over Union
LiDAR. Light Detection And Ranging
MVX-Net. Multimodal VoxelNet for 3D Object De-
tection
Part-A
2
. Part-aware and Part-aggregation Network
PointPillars. Fast Encoders for Object Detection
from Point Clouds
PointRCNN. 3D object proposal generation and de-
tection from point
PV-RCNN. Point-Voxel Feature Set Abstraction for
3D Object Detection
R-CNN. Region-based Convolutional Neural Net-
works
RoI. Region of Interest
RPN. Region Proposal Network
SECOND. Sparsely Embedded Convolutional De-
tection
SOTA. State-of-the-Art
SOTIF. Safety Of The Intended Functionality
TCP. Transmission Control Protocol
TN. True Negative
TP. True Positive
V2V. Vehicle-to-Vehicle
VEHITS 2024 - 10th International Conference on Vehicle Technology and Intelligent Transport Systems
426
