
Automated Software Vulnerability Detection Using CodeBERT and
Convolutional Neural Network
Rabaya Sultana Mim, Abdus Satter, Toukir Ahammed and Kazi Sakib
Institute of Information Technology, University of Dhaka, Dhaka, Bangladesh
Keywords:
Source Code, Vulnerability Detection, CodeBERT, Centrality Analysis, Convolutional Neural Network.
Abstract:
As software programs continue to grow in size and complexity, the prevalence of software vulnerabilities
has emerged as a significant security threat. Detecting these vulnerabilities has become a major concern due
to the potential security risks they pose. Though Deep Learning (DL) approaches have shown promising
results, previous studies have encountered challenges in simultaneously maintaining detection accuracy and
scalability. In response to this challenge, our research proposes a method of automated software Vulnerability
detection using CodeBERT and Convolutional Neural Network called VulBertCNN. The aim is to achieve
both accuracy and scalability when identifying vulnerabilities in source code. This approach utilizes
pre-trained codebert embedding model in graphical analysis of source code and then applies complex network
analysis theory to convert a function’s source code into an image taking into account both syntactic and
semantic information. Subsequently, a text convolutional neural network is employed to detect vulnerabilities
from the generated images of code. In comparison to three existing CNN based methods TokenCNN, VulCNN
and ASVD, our experimental results demonstrate a noteworthy improvement in accuracy from 78.6% to
95.7% and F1 measure increasing from 62.6% to 89% which is a significant increase of 21.7% and 26.3%.
This underscores the effectiveness of our approach in detecting vulnerabilities in large-scale source code.
Hence, developers can employ these findings to promptly apply effective patches on vulnerable functions.
1 INTRODUCTION
Software vulnerabilities pose an increasing risk to
software systems making them susceptible to attacks
and potential damage, thereby raising security con-
cerns (Alves et al., 2016). In 2023, the Open Source
Security and Risk Analysis (OSSRA) conducted a
comprehensive study involving 1703 codebases with
audit data. The findings indicated that 76% of the
codes were open source. Moreover, 48% of the code-
bases exhibited high-risk vulnerabilities and 84% of
these vulnerabilities were associated with open source
security flaws. Consequently, to enhance the security
of software it is crucial to employ advanced methods
for detecting vulnerabilities on a large scale.
Recently, several approaches for vulnerability de-
tection using Deep Learning (DL) have emerged
falling into two categories: the text-based approach
(Li et al., 2018; Zou et al., 2019) and the graph-
based approach (Zhou et al., 2019; Cheng et al.,
2021). Prior studies (Li et al., 2018; Zou et al., 2019;
Mim et al., 2023a) focusing on text-based identifica-
tion of source code vulnerabilities applied static pro-
gram analysis or natural language processing. How-
ever, these approaches often fall short in disregarding
the semantics of the source code. To address these
limitations, program analysis is employed to repre-
sent source code semantics as a graph. Graph analy-
sis methods such as Graph Neural Networks (GNN),
are then applied to identify vulnerabilities. While
these graph-based approaches excel at vulnerability
identification but their scalability is challenging, es-
pecially when compared to text-based approaches.
Text-based approaches, lacking the ability to capture
inter-dependencies between different lines of source
code, result in lower accuracy. On the other hand,
graph-based methods achieve high accuracy but strug-
gle with scalability in complex scenarios with many
nodes in a graph representing statements in the pro-
gram’s source code. The most recent vulnerability de-
tection system, VulCNN (Wu et al., 2022) and ASVD
(Mim et al., 2023b), attempts to combine both text-
based and graph-based approaches to gather syntac-
tic and semantic data from source code. However,
156
Mim, R., Satter, A., Ahammed, T. and Sakib, K.
Automated Software Vulnerability Detection Using CodeBERT and Convolutional Neural Network.
DOI: 10.5220/0012707900003687
Paper published under CC license (CC BY-NC-ND 4.0)
In Proceedings of the 19th International Conference on Evaluation of Novel Approaches to Software Engineering (ENASE 2024), pages 156-167
ISBN: 978-989-758-696-5; ISSN: 2184-4895
Proceedings Copyright © 2024 by SCITEPRESS – Science and Technology Publications, Lda.

VulCNN’s scalability has improved compared to eight
state-of-the-art vulnerability detectors. Still, its detec-
tion performance is deemed unsatisfactory as it lever-
ages Sent2Vec (Moghadasi and Zhuang, 2020) em-
bedding in source code which struggles in capturing
intricate code context and misinterpret code seman-
tics. VulCNN only considers three network central-
ities (Freeman et al., 2002) (degree centrality, katz
centrality, and closeness centrality) for calculating the
importance of each line of source code. The impact of
incorporating other centrality measures such as eigen-
vector centrality and betweenness centrality in vulner-
ability detection has not been explored yet. But these
centralities might have a greater impact on vulnera-
bility detection combining with DL based approaches
which accounts for the overall effect of a node or
statement in source code and detects vulnerability.
To address these issues, we propose an en-
hanced automated Vulnerability detection method us-
ing CodeBERT and Convolutional Neural Network
called VulBertCNN. which uses CodeBERT (Feng
et al., 2020) embedding model leveraging the advan-
tages of large-scale pre-training which captures both
syntactic and semantic information of source code.
Our method comprises of three phases. First, using
the source code as input, we create a Program Depen-
dency Graph (PDG) containing data flow and control
flow information. In the second phase, CodeBERT
embedding is applied to each node of the generated
PDG. In the third phase, we utilize different combi-
nations of five centralities on each node, with each
centrality corresponding to a channel, to create an im-
age. Finally, a Convolutional Neural Network (CNN)
(Krizhevsky et al., 2017) model is trained on the pro-
duced images to identify functions as either vulnera-
ble or non-vulnerable.
To ensure the model’s effectiveness in large-scale
vulnerability scanning we explored pre-trained Code-
BERT embedding model with various centrality com-
binations and we applied the proposed model on two
benchmark dataset SARD and Big-Vul (Fan et al.,
2020) containing a total of 40,584 and 188,770 func-
tions. Results reveal its outperformance over the
state-of-the-art vulnerability detectors in terms of ac-
curacy and F1 measure by 21.7% and 26.3%.
In summary, the contributions of this paper are as
follows.
• We analyzed the shortcomings of three recent vul-
nerability detection approaches TokenCNN, Vul-
CNN and ASVD in doing syntactic and seman-
tic analysis along with selection of node centrality
in generating images from source code by CNN.
Then we proposed the efficient combination of
node centralities to generate images.
• We utilize the language model to develop a tech-
nique for representing vulnerable source code to
detect software vulnerabilities. In contrast to pre-
vious studies (Wu et al., 2022; Mim et al., 2023b)
that employed the Sent2Vec embedding method,
we incorporate the CodeBERT embedding model.
Furthermore, we design a more efficient Convo-
lutional Neural Network (CNN) model by inte-
grating five centralities. This design aims to re-
duce computational overhead while enhancing the
overall detection performance.
• Our experimental results indicate that Vul-
BertCNN outperforms the state-of-the-art meth-
ods (Russell et al., 2018; Wu et al., 2022; Mim
et al., 2023b) on two benchmark datasets SARD
and BigVul (Fan et al., 2020) significantly in
terms of accuracy and F1 measure.
Paper Organization. The remainder of this paper is
structured as follows. Section 2 gives an overview
of previous studies on vulnerability detection and
presents the motivation for our improvements. Sec-
tion 3 introduces the technical route of VulBertCNN.
Section 4 presents the experimental setup and results
analysis. Section 5 demonstrates the threats to valid-
ity of our work. Section 6 includes future research
directions and concludes this paper.
2 RELATED WORK
This section focuses on researches that are conducted
to detect vulnerabilities. Vulnerability detection tech-
niques vary in their degree of automation, typically
falling into three main categories: manual, semi-
automatic, and full-automatic methods. Manual tech-
niques rely on human experts to create vulnerability
patterns, but they may not cover all potential vulnera-
bilities, resulting in lower detection efficiency in real
world scenarios for tools like Checkmarx, FlawFinder
and RATS. Semi automatic techniques (Shankar et al.,
2001; Yamaguchi et al., 2015; Shar et al., 2014) in-
volve human experts extracting specific features, such
as API symbols (Yamaguchi et al., 2012) and sub-
trees, import and function calls (Neuhaus et al., 2007)
which are then fed into traditional machine learning
models to identify vulnerabilities. In contrast, full-
automatic techniques (Cheng et al., 2021; Duan et al.,
2019; Li et al., 2021; Lin et al., 2017) leverage deep
learning to automatically extract features and gener-
ate vulnerability patterns without the need for manual
expert input. Deep learning based techniques (Cheng
et al., 2021; Zhou et al., 2019; Russell et al., 2018;
Li et al., 2018; Zou et al., 2019) can be further cat-
Automated Software Vulnerability Detection Using CodeBERT and Convolutional Neural Network
157

egorized into text-based approaches and graph-based
approaches.
2.1 Text Based Approach
The text-based approaches involve treating a pro-
gram’s source code as text and employing natural lan-
guage processing techniques to identify vulnerabili-
ties. Russell et al. presented a TokenCNN model,
which utilizes lexical analysis for obtaining source
code tokens and employs a Convolutional Neural Net-
work (CNN) for the detection of vulnerabilities (Rus-
sell et al., 2018). Rahman et al. introduced a method-
level detection approach that minimizes the search
space, determining similarity scores between source
code and bug reports. Based on these scores, it
ranks methods that are identified as vulnerable (Rah-
man et al., 2016). Li et al. proposed Vuldeepecker,
which gathers code gadgets through program slic-
ing, converts them into vector formats, and utilizes
Bidirectional Long Short Term Memory (BLSTM)
models for vulnerability detection (Li et al., 2018).
Zhou et al. presented an enhanced method called
µVulDeePecker, which incorporates code attention
integrating control dependence into Vuldeepecker’s
program processing technique to identify multi-class
vulnerabilities (Zou et al., 2019). Mim et al. pro-
posed VFDetector which uses information retrieval
based method for detecting vulnerability from source
code using vulnerability reports. VFDetector calcu-
lates the textual similarity score between vulnerability
report’s description and source code of a software sys-
tem. Higher similarity score suggests highly vulnera-
ble software system (Mim et al., 2023a). These text-
based approaches suffer from poor detection perfor-
mance due to their reliance on static analysis of source
code neglecting source code semantics and consider-
ing the whole source code as plain text.
2.2 Graph Based Approach
To overcome the limitations of text-based approaches,
researchers have turned to dynamic program analy-
sis, converting source code semantics into a graph
and employing graph analysis for vulnerability de-
tection. Zhou et al. introduced an approach uti-
lizing a graph neural network with a convolutional
module to identify vulnerabilities, achieving com-
plete graph-level classification through node pooling
(Zhou et al., 2019). Cheng et al. segmented the pro-
gram dependency graph into subgraphs after distill-
ing program semantics, integrating these subgraphs
into a graph neural network to train a vulnerability
detector (Cheng et al., 2021). While graph-based ap-
proaches prove more effective in identifying vulnera-
bilities, they suffer from scalability issues compared
to text-based strategies. Addressing these, Wu et al.
proposed VulCNN, which leverages a program depen-
dency graph (PDG) to extract information from each
line of code. Centrality analysis on the PDG quanti-
fies the significance of each node in a specific func-
tion, considering three centralities: degree, katz, and
closeness. This analysis produces an image capturing
graph features from three perspectives. Subsequently,
a convolutional neural network (CNN) is trained to
detect vulnerabilities (Wu et al., 2022). Though Vul-
CNN address both syntactic and semantic analysis but
it’s detection performance is not satisfactory.
Text-based vulnerability detection techniques of-
ten overlook program semantics, leading to inaccurate
results. Conversely, graph-based techniques offer ac-
curacy but face scalability challenges, primarily due
to the substantial number of nodes in program graphs.
Consequently, there is a need for automated vulner-
ability detection techniques that strike a balance be-
tween accuracy and scalability, considering both as-
pects simultaneously.
3 PROPOSED METHODOLOGY
This section proposes VulBertCNN (Vulnerability de-
tection with CodeBERT based Convolutional Neu-
ral Network) which consists of three major phases:
Graph Generation, Feature Extraction and Vulnera-
bility Detection as shown in Figure 1. The details are
described in the followings.
3.1 Graph Generation
As shown in Figure 2, this phase initially normalize
the source code of a function before performing static
analysis to obtain the function’s Program Dependency
Graph (PDG). Since the goal of VulBertCNN is to
concurrently detect vulnerabilities with accuracy and
scalability, firstly static analysis is performed to trans-
late the program semantics of source code into a graph
representation. Since a function can potentially im-
plement a specific task, hence this phase concen-
trate on finding vulnerabilities at a more fine grained
level (i.e., function-level) due to the coarse granular-
ity of file-level vulnerability detection. The normal-
ization is performed in three steps. A sample function
transformation at three normalization steps has been
demonstrated in Figure 2. The steps are -
• Step 1: Eliminates the comments from the source
code because they have no effect on the semantics
of the program.
ENASE 2024 - 19th International Conference on Evaluation of Novel Approaches to Software Engineering
158
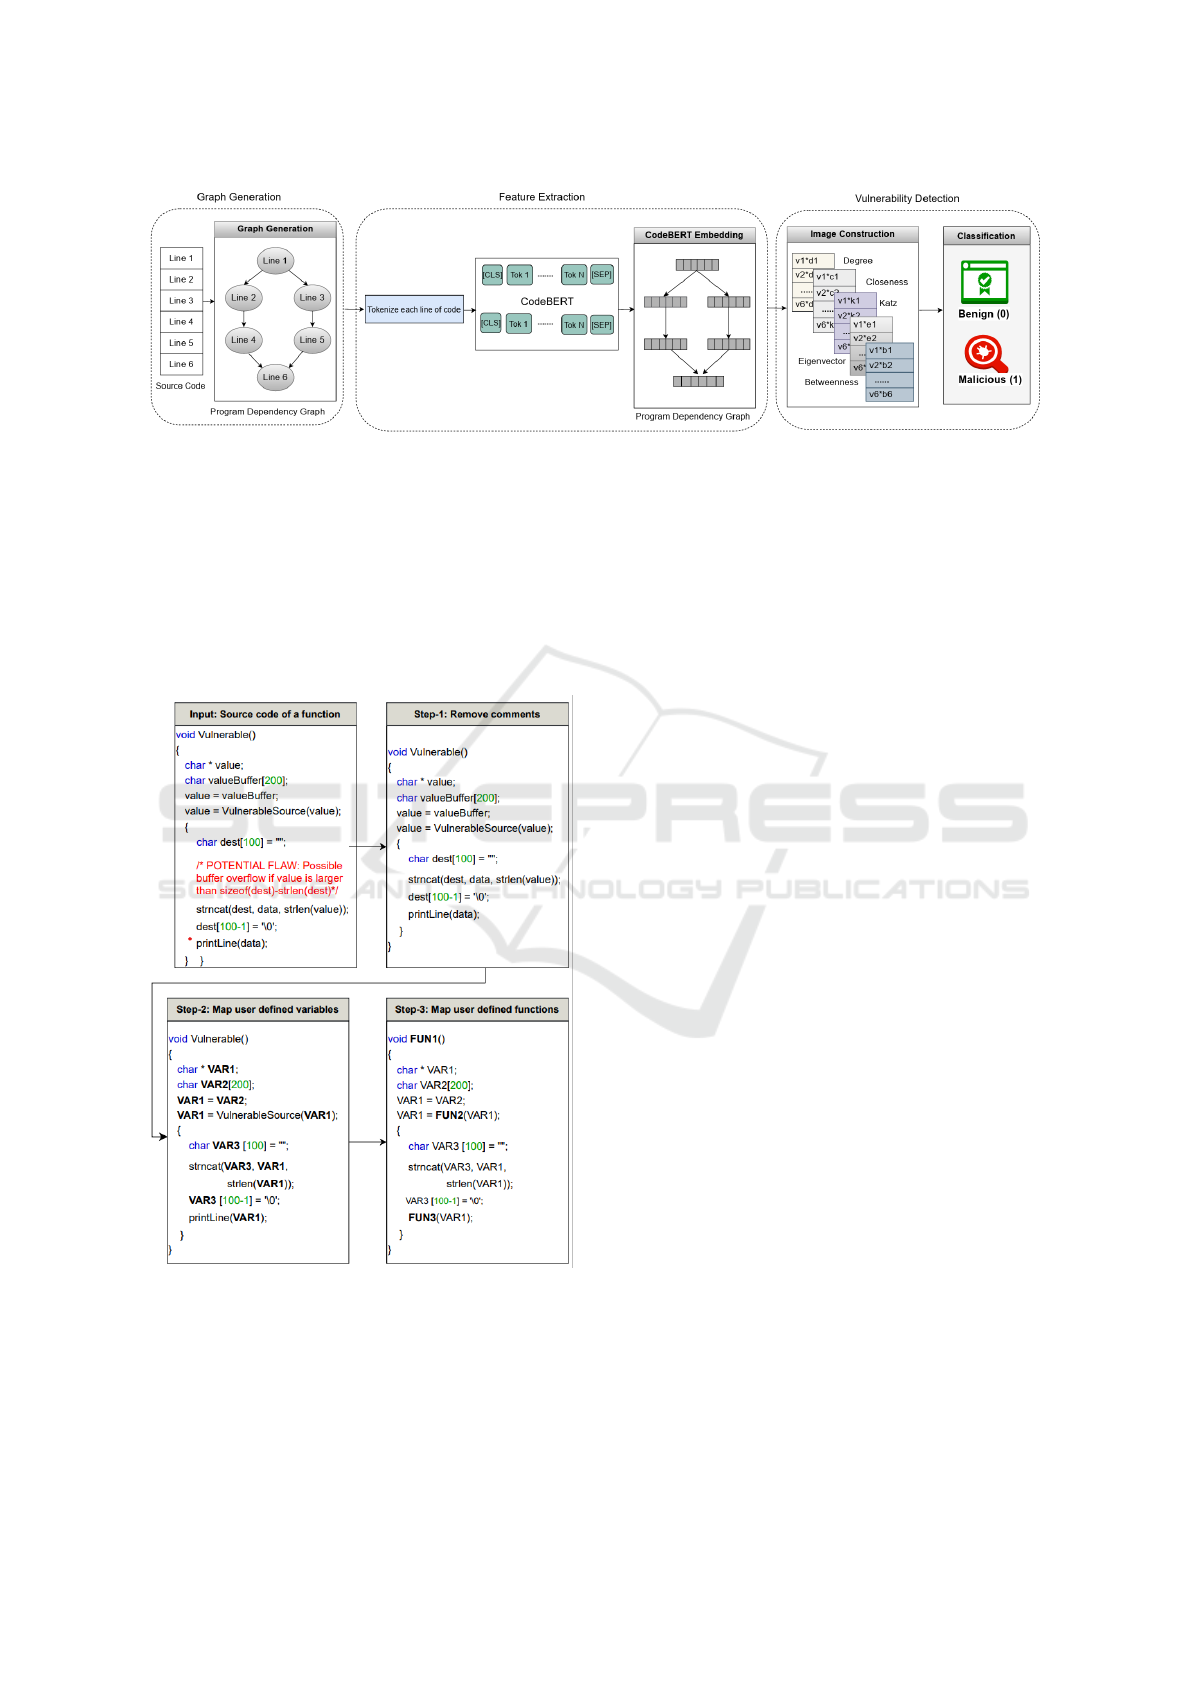
Figure 1: Overview of proposed vulnerability detection system using CodeBERT and Convolutional Neural Network.
• Step 2: One-to-one mapping of user-defined vari-
ables to symbolic names is performed. For ex-
ample, the variable named “value” is mapped to
symbolic name “VAR1”.
• Step 3: One-to-one mapping of user-defined
functions to symbolic names is performed. Such
as the function named “Vulnerable()” is converted
to symbolic name “FUN1()”.
Figure 2: Steps of Source Code Normalization.
After normalization the PDG of the function is then
extracted using an open source code analysis tool for
C/C++ named Joern (Yamaguchi et al., 2014). Each
line of code in the function represents a node in a
PDG.
3.2 Feature Extraction
In this feature extraction step of our research, we em-
ploy CodeBERT (Feng et al., 2020), a pre-trained
BERT model that integrates both Natural Language
(NL) and Programming Language (PL) encodings
creating a comprehensive model suitable for fine-
tuning on source code tasks. Trained on an extensive
dataset sourced from code repositories and program-
ming documents, CodeBERT demonstrates enhanced
effectiveness in software program training and source
code analysis. Firstly, each node of program depen-
dency graph which represents a statement of source
code in tokenized. Then each tokenized lines of code
is given input to pre-trained codeBERT model and
output contains contextual vector representation of
each token. This phase has two steps : Tokenization
and CodeBert Embedding.
Tokenization: During the pre-training phase, input
data is constructed by combining two segments using
special tokens, [CLS], w1, w2, ..wn, [SEP], where
[CLS] serves as a classification token. This input
structure involves one segment representing natural
language text and the other representing code from a
specific programming language. The [CLS] token is
a special token placed before the two segments. Fol-
lowing standard text processing in Transformer, natu-
ral language text is treated as a sequence of words and
divided into WordPieces (Wu et al., 2016), while a
code snippet is considered a sequence of tokens. The
output of CodeBERT includes contextualized vector
representations for each token, encompassing both
natural language and code, as well as the represen-
tation of [CLS], which serves as a summarized repre-
sentation.
CodeBert Embedding: In the context of our re-
search, a snippet of source code is extracted as a PDG
from graph generation phase. Processing the PDG
during this feature extraction phase includes obtain-
ing a comprehensive code representation which is vi-
tal for subsequent model construction. We leverage
Automated Software Vulnerability Detection Using CodeBERT and Convolutional Neural Network
159

CodeBert (Feng et al., 2020), designed to extract code
features using a transformer-based method, specifi-
cally effective for source code-related tasks with self-
supervised learning objectives. CodeBert takes a
PDG of a single function of source code as the raw
input and then processes and splits it into individ-
ual statements S
i
. Each statement is tokenized using
CodeBERT’s pretrained BPE tokenizer. After collect-
ing S = S
1
, S
2
, ..., S
n
the entire function is input into
CodeBERT, enabling the acquisition of function-level
and statement level code representations. This Code-
Bert embedding converts each sentence into a equiva-
lent vector representation having dimension size 768.
Finally an embedded function-level graph with state-
ment level features is extracted from this feature ex-
traction phase.
3.3 Image Construction
After completing CodeBert embedding, each node in
the new embedded PDG is substituted with its corre-
sponding embedded vector. In this phase, our goal is
to convert the new PDG into an image efficiently tak-
ing into account how various lines of code contribute
to program semantics.To generate an image of a func-
tion from the PDG, it’s essential to have information
about the connections between the nodes. The weight
of each connection is determined by evaluating the
node’s contributions to program semantics. Treating
the PDG as a social network graph, node connection
weights are determined using social network central-
ity analysis. This analysis is employed to evaluate
the significance of each node or in other words each
line of code. Centrality (Freeman et al., 2002) con-
cepts, originally introduced in social network analysis
aim to assess a node’s importance within the network.
Various fields including biological and transportation
networks have successfully applied centrality analysis
demonstrating its utility in network assessment. Our
paper considers five centrality metrics which are dis-
cussed below.
Degree Centrality: Degree centrality for a node is
determined by counting both the incoming edges (in-
degree) and outgoing edges (outdegree), essentially
representing the number of links associated with the
node. To obtain the standardized value, the highest
degree is divided by N-1, where N represents the total
number of nodes in the network.
Katz Centrality: It calculates the centrality value
of a node by taking into account the centrality of its
neighboring nodes. This is determined by summing
the number of directly connected nodes and the num-
ber of indirectly connected nodes through these im-
mediate neighbors. The Katz centrality of a node ‘n’
can be expressed as follows:
x
n
= α
∑
j
A
n j
x
j
+ β (1)
In the given expression, A represents the Adjacency
Matrix, and α, β and λ stand for the Attenuation Fac-
tor, Initial Centrality Controller and Eigenvalues of
the graph G respectively. These parameters are in-
strumental in assigning increased weight to nearby
neighbors (via β), while simultaneously applying a
penalty to distant links (utilizing α). Notably, α must
be smaller than the inverse of the largest eigenvalue
of the adjacency matrix to ensure the proper compu-
tation of Katz centrality allowing for an accurate mea-
surement by considering the influence of various fac-
tors.
α <
1
λ
max
(2)
Closeness Centrality: Closeness centrality mea-
sures how close a node is to every other node in
the graph. It is computed by averaging the shortest
path lengths between the nodes within the graph. A
node with a smaller average distance signifies greater
closeness to the center of the graph. The average dis-
tance is essentially the inverse of the node’s proximity
centrality among all x-1 accessible nodes.
C(x) =
x − 1
∑
x−1
n=1
d(n, x)
(3)
In this equation, where x represents the total number
of nodes in the graph and d(n, x) denotes the distance
between nodes n and x.
Eigenvector Centrality: Eigenvector centrality as-
sesses a node’s overall impact based on the centrality
of its neighboring nodes. In accordance with the given
definition, the i-th element in the n vector corresponds
to the eigenvector centrality of the i node.
An = λn (4)
Here, the eigenvalue λ is associated with the adja-
cency matrix A.
Betweenness Centrality: Betweenness centrality
calculates the shortest paths for nodes within a graph,
representing the overall percentage of total pairs of
shortest routes that traverse through a specific node α
a. Mathematically, it is expressed as:
C
B
(a) =
∑
s,t∈N
σ(s,t|a)
σ(s,t)
(5)
ENASE 2024 - 19th International Conference on Evaluation of Novel Approaches to Software Engineering
160
In this formula, N signifies the set of nodes, σ(s,t)
denotes the count of shortest paths between nodes s
and t, and σ(s, t|a) represents the count of paths pass-
ing through node a other than nodes s and t.
A
x
=
Degree(x)
N − 1
(6)
Due to the typical composition of a RGB image
with three channels: Red, Green, and Blue, prior stud-
ies utilize three different centrality measures: degree
centrality, Katz centrality, and closeness centrality.
These centrality measures provide insights into the
importance of various lines of code within a function
from distinct perspectives. By incorporating addi-
tional two centrality measures: Betweenness central-
ity and Eigenvector centrality we can achieve a more
comprehensive assessment of each line of code’s con-
tribution to the overall program semantics because
Eigenvector centrality assesses the importance of a
node based on its connections to other highly central
nodes, offering insight into critical elements within a
PDG. Betweenness centrality identifies nodes that act
as key intermediaries, revealing critical pathways for
information flow or dependencies between different
modules or functions in a program. Both measures
provide valuable insights into the structural and func-
tional importance of nodes within a network, aiding
in understanding program semantics and dependen-
cies in source code.
In summary, we compute the centrality values
for all nodes in the new embedded PDG. Subse-
quently, we arrange the resulting vectors in accor-
dance with the number of lines of code multiplied
by the corresponding centrality measure. These ar-
ranged vectors represent the “Degree channel” “Katz
channel”, “Closeness channel” , “Betweennes chan-
nel” and “Eigenvector channel” Additionally, by ap-
plying betweenness centrality and eigenvector cen-
trality analysis we obtain two more channels. Ulti-
mately, the combination of these five channels is uti-
lized to generate the final image representation from
a source code function.
3.4 Vulnerability Classification
Deep learning algorithms have outperformed previous
technologies in various domains, such as speech and
image recognition. By utilizing effective hierarchical
feature extraction methods and unsupervised or semi-
supervised feature learning, deep learning presents
the advantage of replacing manual feature acquisition.
In the domain of image processing, Convolutional
Neural Network (CNN) has gathered significant at-
tention. This is attributed to its ability not only to
eliminate the need for manual image preparation but
also to enable users to extract features at a level com-
parable to human capabilities. Following the image
generation phase, a function’s source code is trans-
formed into an image. To identify vulnerabilities, the
initial step involves training a CNN model on an im-
age. While CNN typically utilizes input images of
equal size, it encounters variations in the number of
lines of code required for each function. Hence, ad-
justments are necessary.
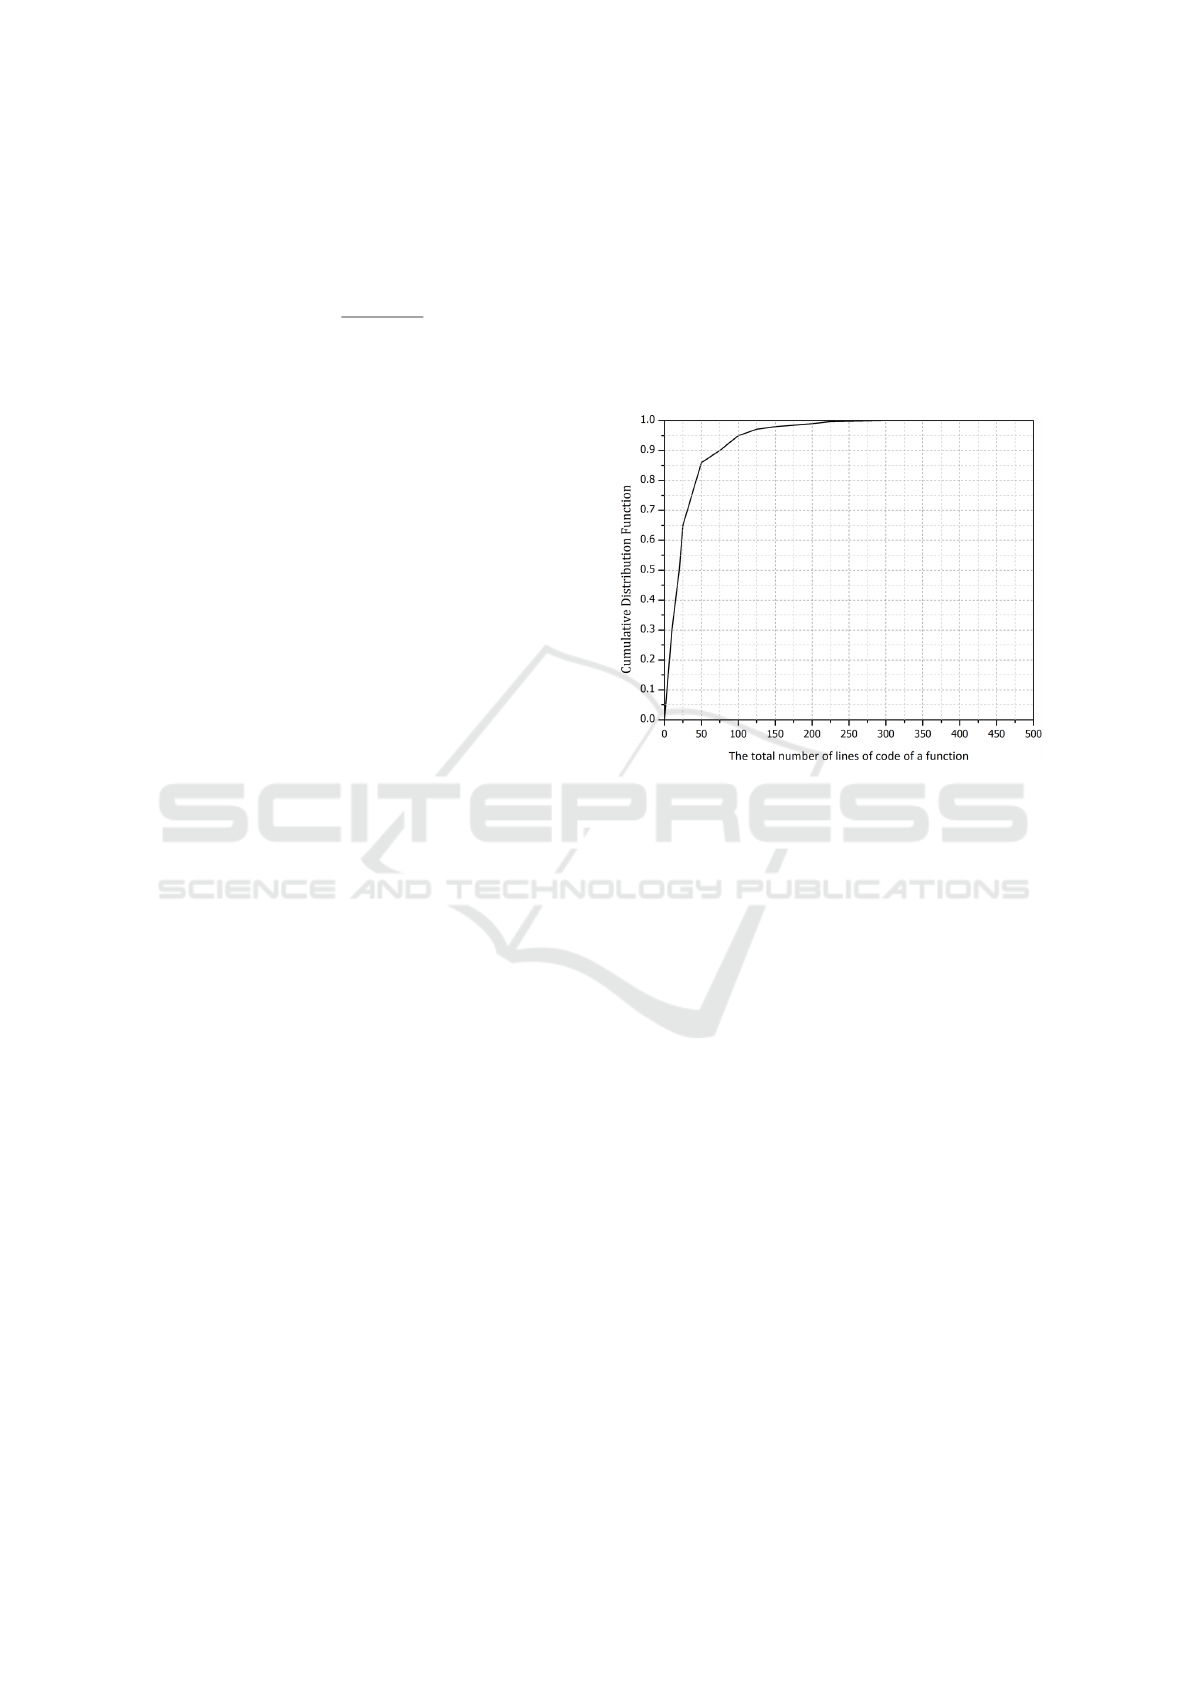
Figure 3: Cumulative Distribution Function of total number
of lines of code of a function.
To identify vulnerabilities, the initial step involves
training a CNN model with images. While CNN typ-
ically utilizes equal-sized input images, the varying
number of statements in each function within our in-
put dataset necessitates an adjustment. To determine
a threshold for fixed-size images, an analysis is con-
ducted to assess the number of lines of code in each
function. Figure 3 shows the Cumulative Distribu-
tion Function (CDF) of the total number of statements
(lines of code) in functions from the input dataset is
calculated. It is observed that over 99% of the func-
tions contain fewer than 200 statements. After exper-
imenting with various threshold values (ranging from
40 to 200 statements) for vulnerability detection, a de-
cision is made to set the cutoff at the first 100 state-
ments of a function. This decision is based on con-
siderations of detection accuracy and related runtime
overhead. For functions with fewer than 100 state-
ments, zeros are padded at the end of the vectors. In
functions with more than 100 statements, the vector’s
tail is discarded. The input images are typically of
sizes 3*100*768, 4*100*768, or 5*100*768, where
3, 4, 5 denote the number of channels, and 786 de-
notes the dimensions of the embedded vector.
In Figure 4, the input image shape is speci-
fied as 5 ∗ 100 ∗ 768, where 5 represents five dis-
Automated Software Vulnerability Detection Using CodeBERT and Convolutional Neural Network
161
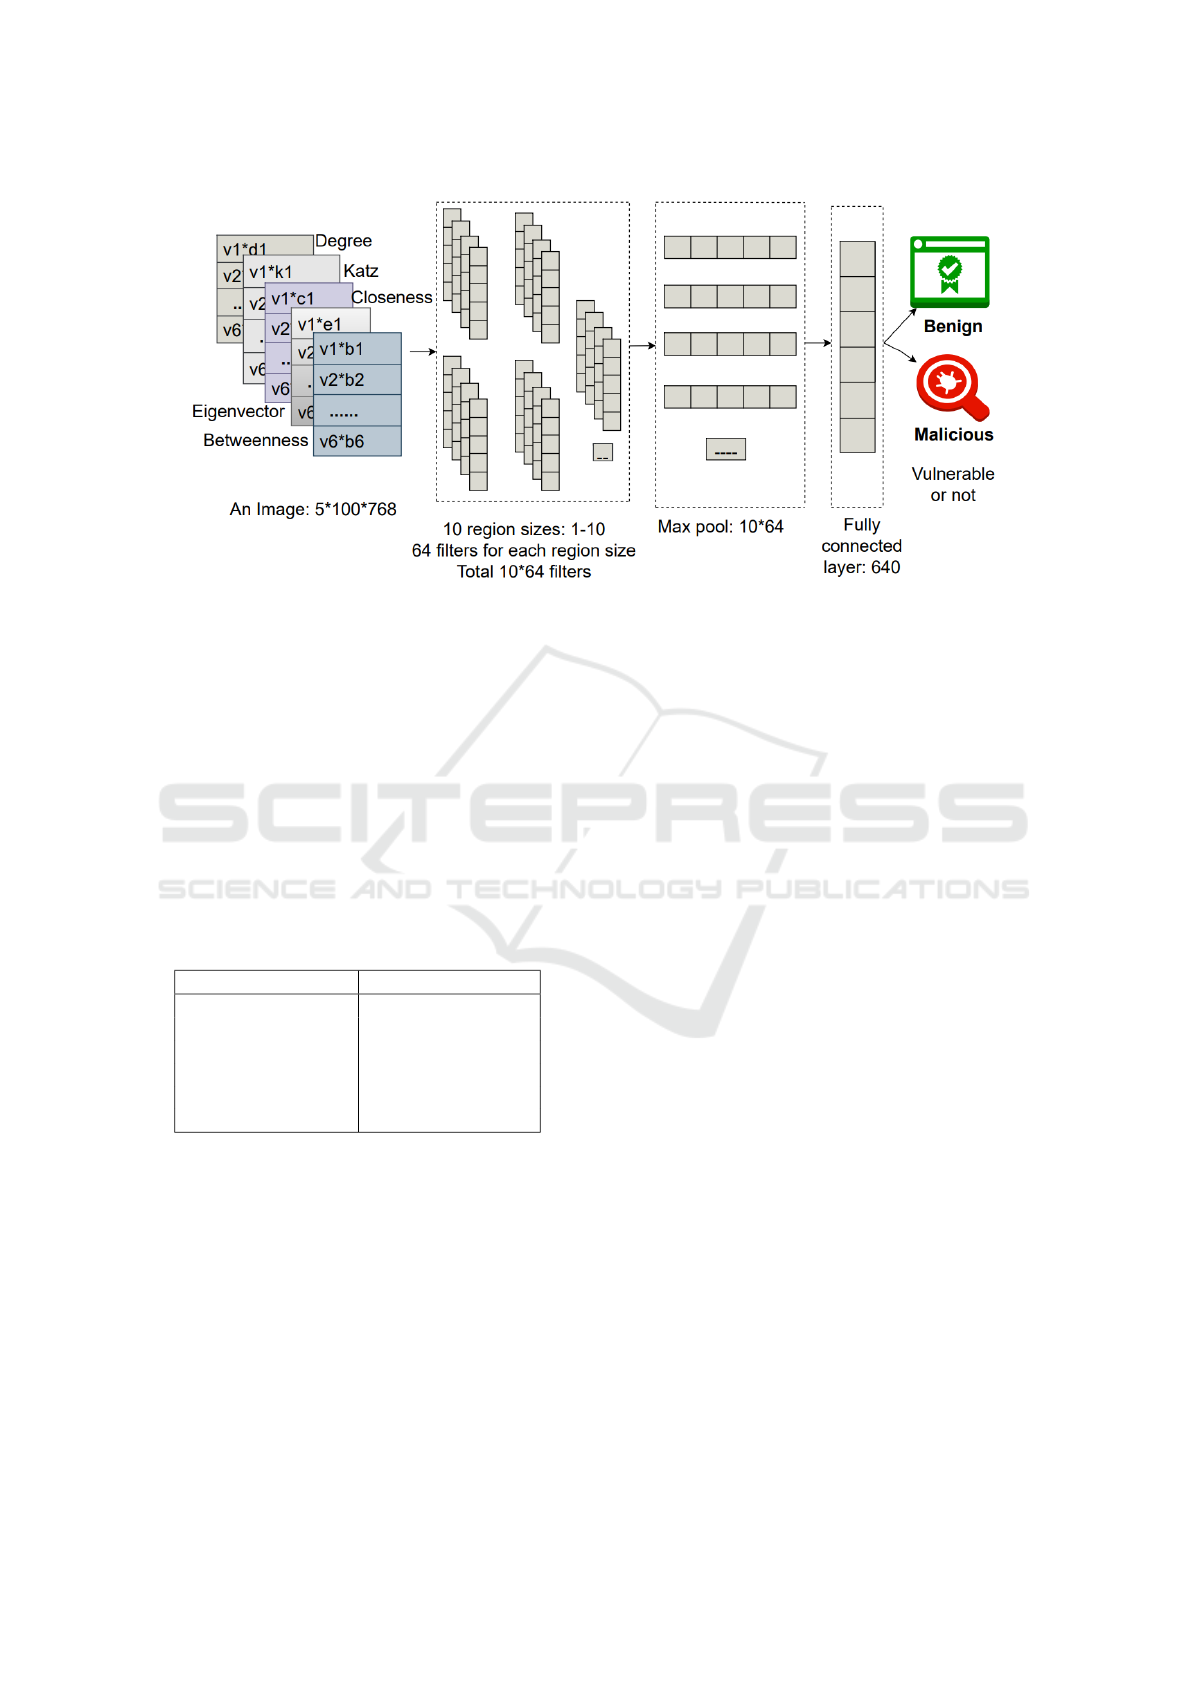
Figure 4: CNN Classification of VulBertCNN.
tinct channels: “degree” (D),“Katz” (K),“Closeness”
(C),“Eigenvector” (E), and “Betweenness” (B). These
channels are created to incorporate different aspects.
Following the generation of fixed-size images, they
are utilized for training a CNN model. The CNN
model employs various convolution filters, each with
a shape of m*768 as depicted in Figure 4. This design
allows each filter to independently cover the entire ca-
pacity of the CodeBert embedding. The variable m
denotes the size of the filter, indicating the number of
consecutive sentences to be considered.
Table 1: Hyper-Parameter Settings In VulBertCNN.
Hyper-Parameters Value
Learning Rate 0.0001
Number of Epochs 100
Batch-Size 64
loss function Cross Entropy Loss
Activation Function ReLU
Optimizer Adam
In our proposed method, we extract features from
different parts of the image by employing various fil-
ter sizes ranging from 1 to 10, each with 64 feature
maps. This process is followed by max pooling and
the application of the Rectified Linear Unit (ReLU)
(Dahl et al., 2013) activation function across the en-
tire model. The datasets are initially divided based on
their original split. However, in cases where the split
information is unavailable, we adopt a default split of
80:10:10 for training, validation and testing sets re-
spectively. The hyperparameters utilized in the CNN
architecture are detailed in Table 1.
4 EVALUATION AND RESULT
ANALYSIS
In this section, we perform experiments to compare
the detection accuracy of VulBertCNN with state-of-
the-art solutions TokenCNN (Russell et al., 2018),
VulCNN (Wu et al., 2022) and ASVD (Mim et al.,
2023b). Before delving into the effectiveness of Vul-
BertCNN, we provide details on the implementation
specifics.
4.1 Experiment Setup
The proposed method is implemented in Python (ver-
sion 3.11.5). We conducted experiments using an
ASUS TUF Gaming laptop featuring an Intel Core
i7-8th generation CPU on a Windows server. The pro-
cessor in the laptop has six cores, each with a maxi-
mum operating frequency of 2.5 GHz.
4.2 Datasets
To evaluate the effectiveness of VulBertCNN, we use
two benchmark vulnerability datasets: SARD and
Big-Vul (Fan et al., 2020) in alignment with state-
of-the-art methods. The datasets were collected from
two sources: National Institute of Standards and
Technology (NIST) and Common Vulnerability Ex-
posure (CVE) database. The details of the experimen-
tal datasets are presented below in Table 2.
SARD: The software assurance reference dataset
(SARD) dataset encompasses a significant volume of
production, synthetic, and academic security flaws
ENASE 2024 - 19th International Conference on Evaluation of Novel Approaches to Software Engineering
162

Table 2: Details of Datasets.
Dataset Total Vul Non-Vul Vul (%)
SARD 40,584 13,684 26,900 33.71
Big-Vul 188,770 10,670 178,100 5.65
(i.e., bad functions) and non-vulnerable function (i.e.,
good functions). Our paper concentrates on identi-
fying vulnerabilities specifically in C/C++, thus we
exclusively target functions written in C/C++ within
SARD. The dataset from SARD comprises 12,300 in-
stances of vulnerable functions and 21,000 instances
of non-vulnerable functions. Recognizing the po-
tential lack of realism in synthetic programs within
SARD, we supplement our data with another dataset
derived from real-world software. For real-world
vulnerabilities, we utilize the National Vulnerabil-
ity Database (NVD) as our primary data source, re-
sulting in 1,384 vulnerable functions from various
open-source C/C++ projects. To complement this,
we randomly select a subset of non-vulnerable func-
tions from the dataset which contains non-vulnerable
functions from diverse open-source projects, ensur-
ing a balanced representation. The ultimate dataset
comprises 13,684 functions with vulnerabilities and
26,900 functions without vulnerabilities.
Big-Vul: We utilized the benchmark dataset Big-
Vul, created by Fan et al. (Fan et al., 2020). This
dataset contains reliable and comprehensive code vul-
nerabilities directly associated with the publicly ac-
cessible CVE database. Notably, the construction of
this dataset involved a significant investment of man-
ual resources to ensure its high quality. Addition-
ally, it stands out for its substantial scale, being one
of the most extensive vulnerability datasets available.
The dataset is compiled from 348 open source Github
projects spanning from 2002 to 2019, covering 91 dis-
tinct Common Weakness Enumeration (CWE) cate-
gories. This comprehensive dataset includes approx-
imately 188,700 C/C++ functions, with 5.6% iden-
tified as vulnerable, equivalent to 10,600 vulnerable
functions. It offers detailed ground-truth informa-
tion at the function level, specifying which functions
within a codebase are susceptible to vulnerabilities.
4.3 Evaluation Metrics
To effectively evaluate model predictions, we estab-
lished and defined ground truth values as follows:
True Positive (TP) is the number of vulnerable sam-
ples correctly detected as vulnerable. True Negative
(TN) is the number of non-vulnerable samples cor-
rectly identified as not vulnerable. False Positive (FP)
is the number of non-vulnerable samples incorrectly
classified as vulnerable. False Negative (FN) is the
number of vulnerable samples erroneously identified
as not vulnerable. Hence, we employ four metrics
for our experiments, namely: Accuracy: This met-
ric indicates the number of samples that are correctly
classified into their respective classes (e.g., positive or
negative labels for vulnerable or non-vulnerable func-
tion).
Accuracy =
T P + TN
T P + TN + FP +FN
(7)
Precision: Precision is the ratio of correctly classified
adversarial examples to the total number of adversar-
ial examples.
Precision =
T P
T P + FP
(8)
Recall: Recall refers to the ratio of incorrectly classi-
fied adversarial examples.
Recall =
T P
T P + FN
(9)
F1 Score: F1 Score is a metric that combines pre-
cision and recall, providing a simple and convenient
way to compare our three classifiers.
F1 −Score = 2 ∗
Recall ∗ Precision
Recall + Precision
(10)
4.4 Detection Performance Evaluation
To assess the effectiveness of the proposed technique,
we conducted experiments with a total of 16 combina-
tions of centralities on the benchmark SARD and Big-
Vul dataset. As we observed in Figure 3 that more
than 99% of the functions have thresholds below 200
lines of code, we initiated our evaluations by select-
ing 10 thresholds (40, 60, 80, 100, 120, 140, 160, 180,
and 200 lines). The experimental results of our pro-
posed method with different combination of central-
ities using SARD dataset are presented in Figure 5.
As TokenCNN, VulCNN and ASVD all are evaluated
using this dataset that is why to better compare the
detection performance of our VulBertCNN approach
it is evaluated with the same dataset.
We conducted CodeBERT embedding and cen-
trality analysis on the graph derived from the source
code. Since the centralities align with the channels
of an image, we conducted our experiment consider-
ing three, four, or five channels representing various
combinations of the aforementioned five centralities.
The experiment consisted of 100 epochs and the fi-
nal outcomes of the maximum detection performance
in each of the combination using three, four, five or
without centralities are illustrated in Figure 6. We ex-
amined the following four specific cases to observe
the influence of centrality on vulnerability detection.
Automated Software Vulnerability Detection Using CodeBERT and Convolutional Neural Network
163
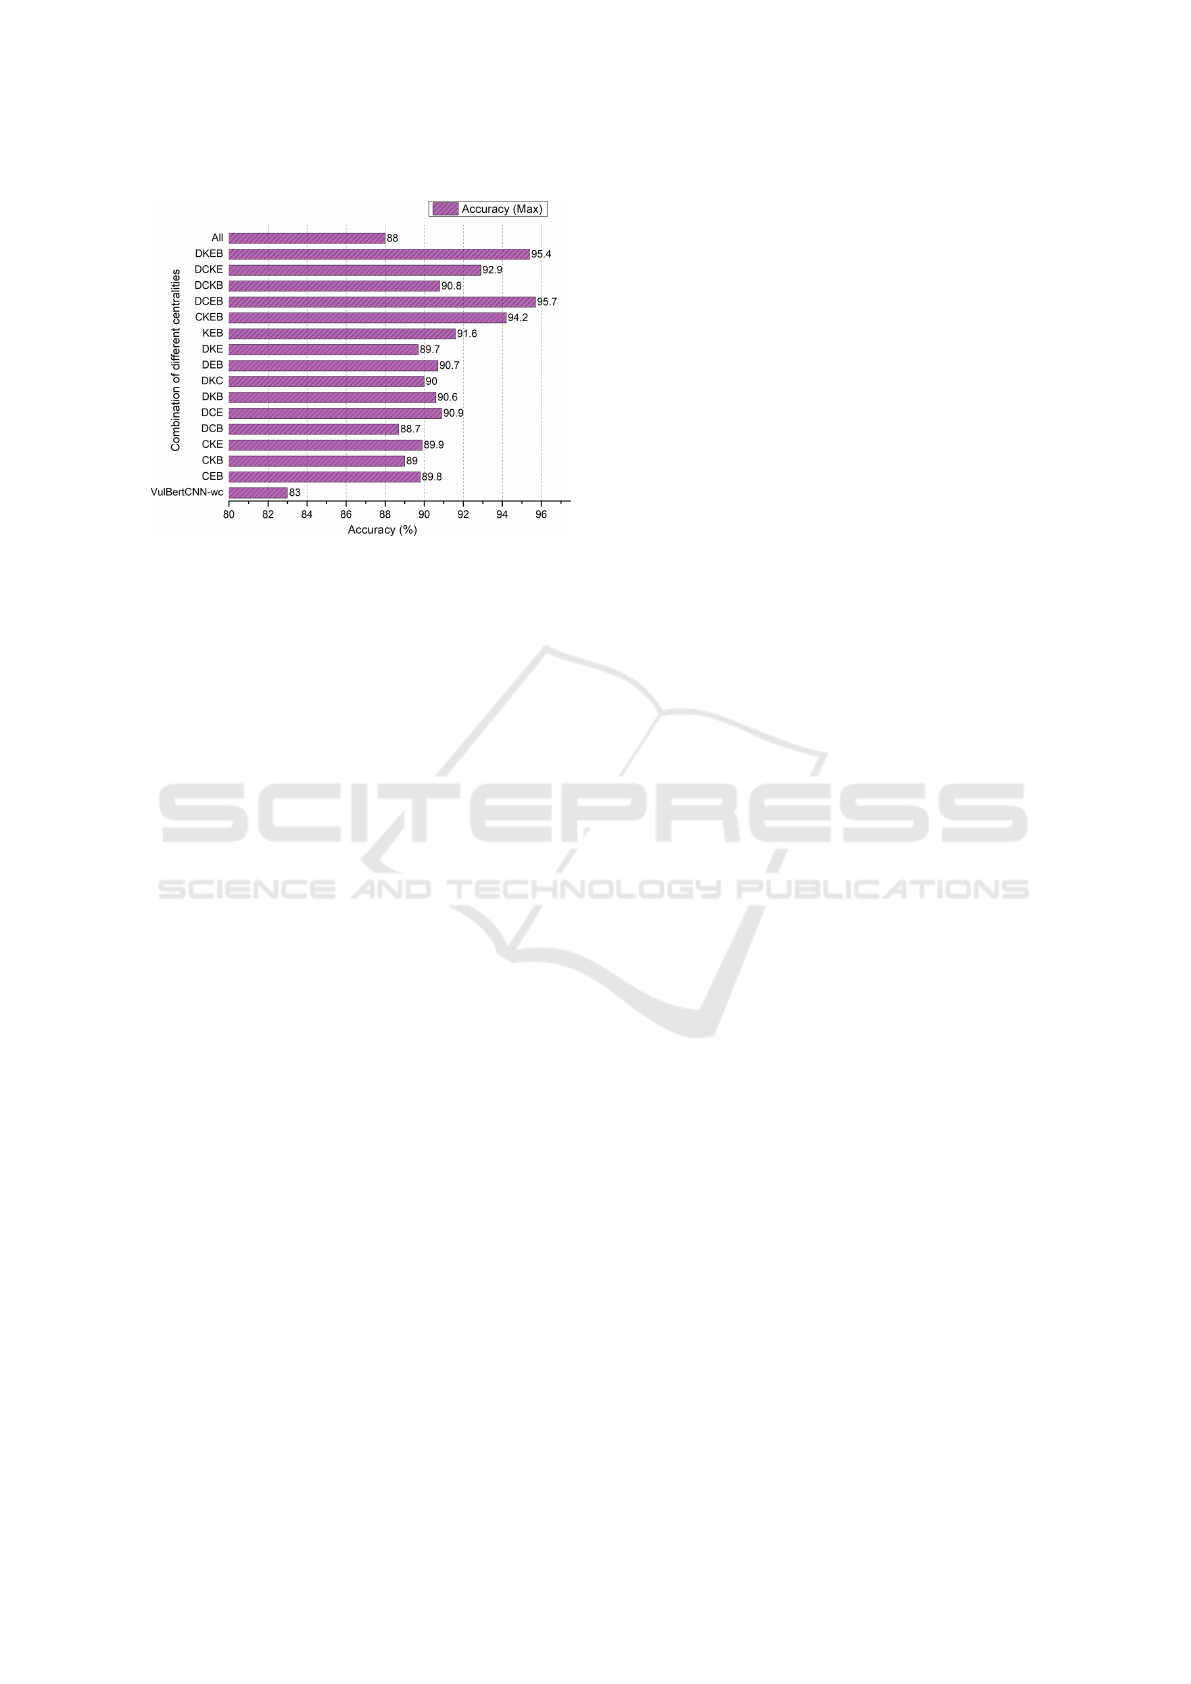
Figure 5: Comparison of the detection accuracy for dif-
ferent centralities using CodeBert embedding and CNN on
SARD dataset.
Vulnerability Detection with CodeBert Embed-
ding Using 3 Centralities: We experimented with
different combinations of centralities to enhance vul-
nerability detection. Initially, we explored combi-
nations of three centralities, selecting from a pool
of five. The optimal performance, with a maximum
accuracy of 90.9%, was achieved using the DCE
(Degree-Closeness-Eigenvector) centralities, as illus-
trated in Figure 6(a). In comparison, the state-of-the-
art VulCNN detector, employing the DKC (Degree-
Katz-Closeness) combination, achieved a maximum
accuracy of 83%.
Vulnerability Detection with CodeBert Embed-
ding Using 4 Centralities: An image constructed
with four centralities corresponds to a four-channel
image. The highest accuracy, reaching 95.7% was
observed with the DCEB combination (Figure 6(b)).
Additionally, DCEB and CKEB demonstrated sub-
stantial detection performance in comparison to other
combinations achieving accuracies of 95.7% and
95.4%, respectively.
Vulnerability Detection with CodeBert Embed-
ding Using 5 Centralities: For the case of five cen-
tralities, representing an image with five channels, the
maximum detection accuracy reached 88% (Figure
6(c)), which was not as significant as the performance
achieved with four centralities.
Vulnerability Detection with CodeBert Embed-
ding Without Using Centrality: To assess the im-
pact of centrality analysis on vulnerability detection,
we conducted another experiment which is Vulner-
ability Detection with CodeBert Embedding using
CNN without centrality (VulBertCNN-wc). This ex-
periment achieved only 83% accuracy. However,
upon incorporating centrality analysis, the accuracy
significantly improved to approximately 96%. This
underscores the importance of considering centrality
measures in code lines to enhance the accuracy of vul-
nerability identification in software.
In summary, the analysis highlights that the best
accuracy (95.7%) was achieved with combinations
of four centralities, specifically CKEB, DCEB, and
DKEB in SARD dataset. Furthermore, VulBertCNN
emphasizes the significant role of CodeBERT, eigen-
vector and betweenness centrality measures in effec-
tive vulnerability detection.
4.5 Baseline Methods Comparison
We evaluate VulBertCNN’s performance in vulner-
ability detection with three state-of-the-art detection
approaches based on image processing which are To-
kenCNN, VulCNN and ASVD.
4.5.1 TokenCNN
Russell et al. annotate the source code and transform
it into the corresponding matrix. They utilize con-
volutional neural networks, integrated learning, and
a random forest classifier for detecting vulnerabilities
in the code (Russell et al., 2018). In TokenCNN no se-
mantic relation is considered here only simple lexical
analysis is done on source code which is then given
input in CNN. Thats why it cannot accurately detect
vulnerability from source code.
4.5.2 VulCNN
Wu et al. (Wu et al., 2022) developed Vul-
CNN, a vulnerability detection method using CNN.
They used a dataset with both vulnerable and non-
vulnerable C/C++ functions, created program depen-
dency graphs (PDGs), and applied a sentence em-
bedding technique i.e., Sent2Vec (Pagliardini et al.,
2018) to each statement. Utilizing centrality tech-
niques, they transformed functions into images and
trained a CNN model. In a case study involving
projects such as Libav, Xen and Seamonkey, VulCNN
detected 73 previously unknown vulnerabilities. Vul-
CNN achieves 83% accuracy but it only considers
three centralities there are other centralities yet to be
explored.
4.5.3 ASVD
Mim et al. (Mim et al., 2023b) developed ASVD with
comparison to VulCNN method with sentence embed-
ding and five centralities. The detection accuracy ob-
tained in ASVD is 88% which outperforms the accu-
racy of VulCNN (83%) by 5% which we targeted to
ENASE 2024 - 19th International Conference on Evaluation of Novel Approaches to Software Engineering
164
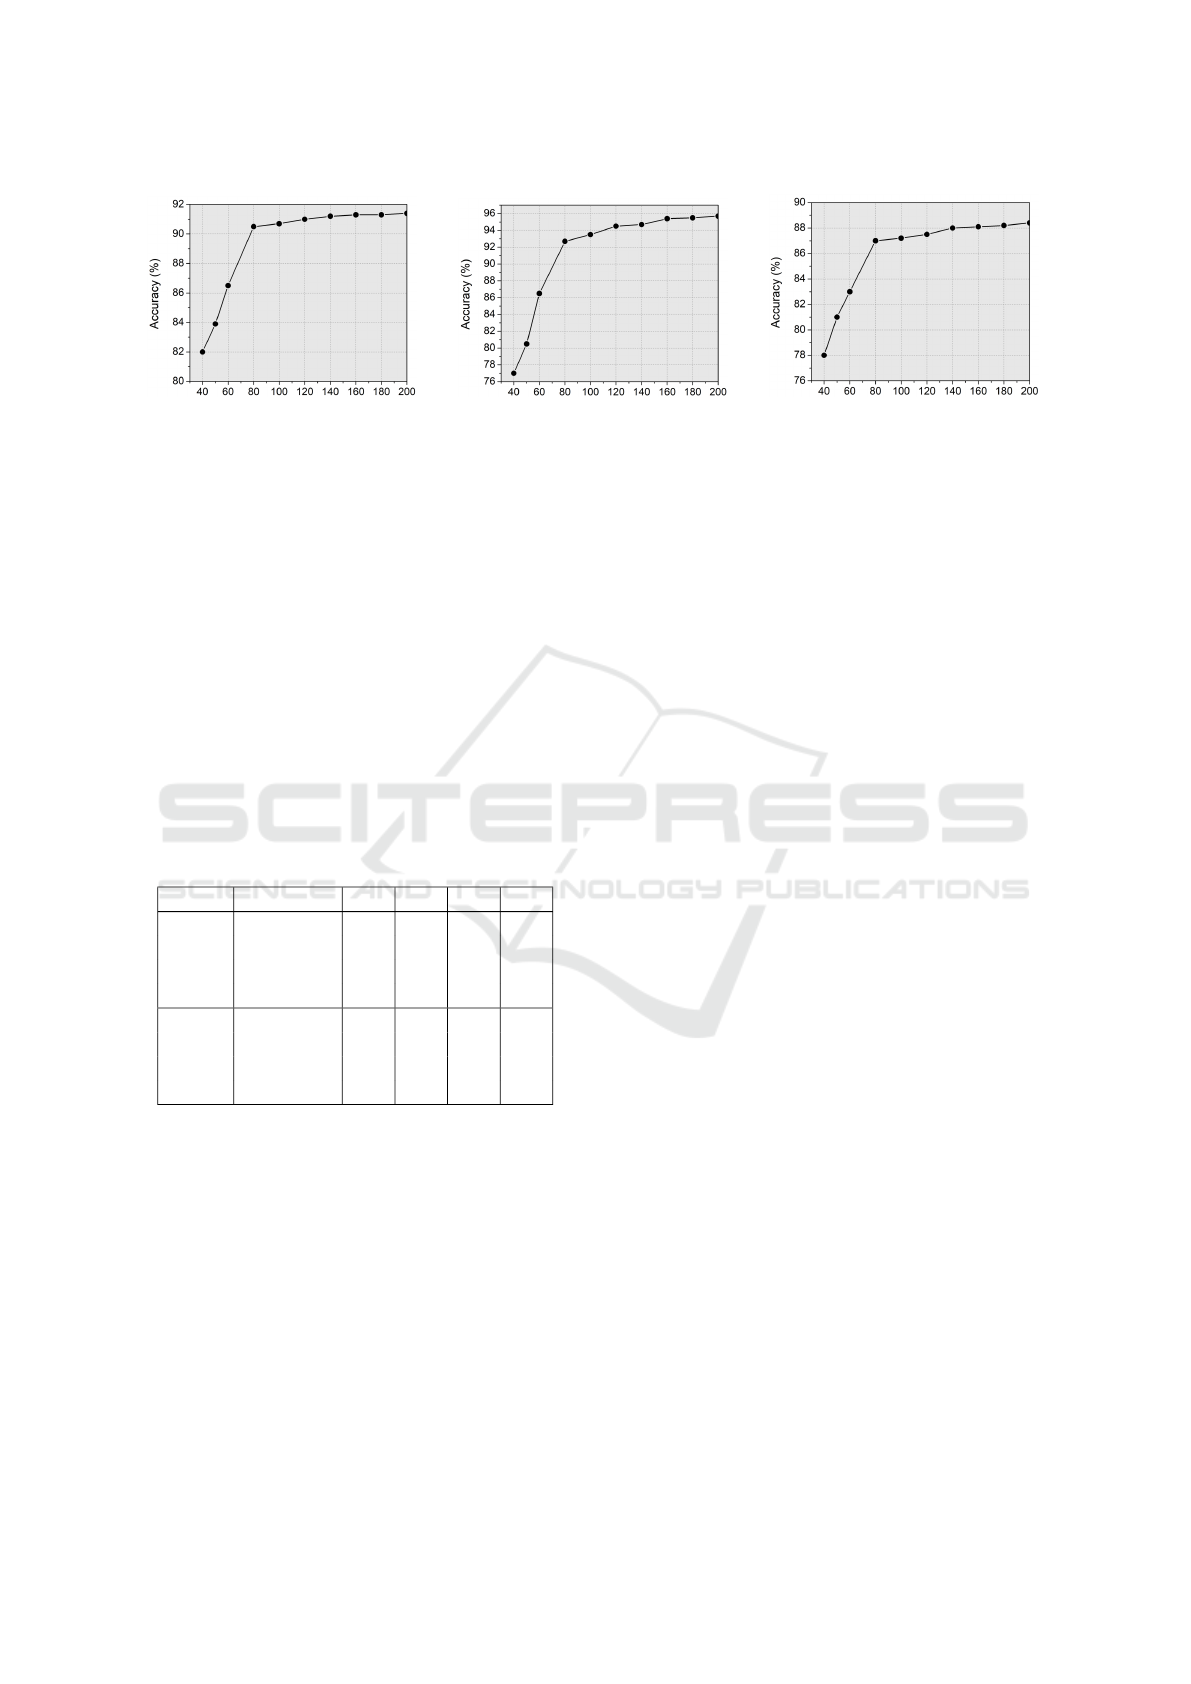
(a) Number of lines of code analyzed
with 3 centralities
(b) Number of lines of code analyzed
with 4 centralities
(c) Number of lines of code analyzed
with 5 centralities
Figure 6: Maximum vulnerability detection performance in VulBertCNN with CodeBert embedding and different centralities.
improve further by leveraging CodeBert embedding
instead of Sent2Vec embedding approach.
4.5.4 Analysis of Comparison
To evaluate the efficiency of our embedding approach
utilizing the CodeBERT model (as detailed in Sec-
tion 3) we performed experiments to assess the perfor-
mance of both the Sent2vec and CodeBERT embed-
ding models. The results were then compared with
those of three related studies, TokenCNN, VulCNN
and ASVD. Tables 3 provides a summary of the eval-
uation results in terms of Accuracy (A), Precision (P),
Recall (R) and F1 score.
Table 3: Evaluation of VulBertCNN using CodeBert Em-
bedding.
Dataset Methods A P R F1
SARD
TokenCNN 78.6 55.7 71.6 61.9
VulCNN 83.4 86.9 81.9 84.3
ASVD 88.2 89.5 85.3 87.3
VulBertCNN 95.7 90.4 87.3 89.0
Big-Vul
TokenCNN 61.4 50.6 79.7 62.6
VulCNN 80.3 83.3 78.2 82.3
ASVD 89.6 94.2 86.5 90.2
VulBertCNN 91.8 89.1 87.4 88.2
Table 3 indicates that our embedding approach
which is utilizing the CodeBERT model has demon-
strated significantly superior evaluation outcomes
when compared to existing state-of-the-art ap-
proaches. Our method achieved an accuracy of 95.7%
and F1 score of 89% on SARD dataset and 91.8% ac-
curacy on Big-Vul dataset showcasing a substantial
enhancement over other existing methods. Moreover,
both Precision (90.4%) and Recall (87.3%) metrics
exhibited improvements in SARD dataset. While the
F1 measure with CodeBERT (88.2%) on Big-Vul did
not outperform ASVD, it displayed improvement in
accuracy when contrasted with our experimental eval-
uation using Sent2Vec (90.2%). In these scenarios,
the accuracy metric proves more suitable for evaluat-
ing vulnerability detection performance.
In summary, the result analysis reveals that our
embedding method using CodeBERT outperforms the
Sent2Vec embedding method used by VulCNN and
ASVD. By combining CNN with CodeBERT embed-
dings and centrality analysis, we achieved a signifi-
cant improvement in the F1-score increasing it from
62.6% to 89% and detection accuracy from 78.6% to
95.7% which is about 21.7% and 26.3% improvement
compared to the state-of-the-art approaches.
5 THREATS TO VALIDITY
In this section, we discussed below the potential
threats which may affect the validity of this study.
External Validity: External validity presents chal-
lenges in generalizing study findings. Differences
in programming languages (e.g., C/C++ vs. Java or
Python) and caution in extending results to various
code vulnerabilities are key considerations. General-
izing findings to a broader range of open-source and
industrial systems requires careful handling due to the
complexity of obtaining and analyzing diverse indus-
trial systems. To overcome these challenges, future
plans include collecting data from industrial systems
across industries and countries to enhance dataset di-
versity.
Internal Validity: Internal validity concerns the ac-
curacy of causal inferences in our vulnerability de-
tection research. Variations in dataset characteristics
and algorithmic parameters pose potential confound-
ing issues. To enhance internal validity, we employ
a rigorous experimental design, exercise precise vari-
able control, and conduct sensitivity analyses. For in-
stance, strategic dataset partitioning over time ensures
a robust assessment of temporal dynamics, contribut-
ing to the internal validity of our vulnerability classi-
fication methodology.
Automated Software Vulnerability Detection Using CodeBERT and Convolutional Neural Network
165

Construct Validity: Construct validity focuses on the
tool used for extracting Program Dependency Graphs
(PDGs), namely Joern. While commonly used, Jo-
ern may have inherent flaws. Despite this, we chose
Joern for PDG extraction and performed manual re-
views to identify and address any issues. There’s a
potential threat from modifying baseline approaches,
but we mitigate this risk by retrieving the original
source code directly from GitHub repositories asso-
ciated with analyzed techniques.
Criterion Validity: In vulnerability detection, met-
rics like precision, recall, and F-measure quantify the
alignment of identified vulnerabilities with actual vul-
nerable functions. High value of criterion validity in-
dicates our algorithm effectively predicts vulnerabili-
ties in line with widely accepted standards.
6 CONCLUSION AND FUTURE
WORK
This paper introduces an automated Software
Vulnerability Detection with CodeBert and
Convolutional Neural Network named VulBertCNN,
aiming to overcome the limitations of state-of-the-
art individual text and graph-based approaches in
vulnerability detection.
In this paper, a vulnerability detection approach
is proposed which focuses on integrating Codebert
embedding model with multiple centralities in image
generation from PDGs to assess the overall impact
of each line of code within a function, thereby de-
termining its vulnerability status. The evaluation in-
volves the generation of 16 centrality combinations
derived from 5 centralities, revealing that the highest
accuracy is attained with a combination of 4 central-
ity measures. This achieves an accuracy surpassing
the previous state-of-the-art techniques from 78.6%
to 95.7% and F1-score increasing it from 62.6% to
89%. It is observed that leveraging codebert embed-
ding with CNN emerges effective role in vulnerability
detection.
Future plans involve optimizing program depen-
dency graph generation time with tools like Frama-
C, incorporating dynamic analysis for improved de-
tection. Additionally, efforts will be made to narrow
down the search space within a function by comparing
source code with vulnerability reports from National
Vulnerability Database aiming to identify statement-
level vulnerabilities.
ACKNOWLEDGEMENTS
This research is supported by the fellowship from
Information and Communication Technology (ICT)
Division, Ministry of Posts, Telecommunications
and Information Technology, Bangladesh. No-
56.00.0000.052.33.001.23-09; Date: 04.02.2024.
REFERENCES
Alves, H., Fonseca, B., and Antunes, N. (2016). Software
metrics and security vulnerabilities: dataset and ex-
ploratory study. In 2016 12th European Dependable
Computing Conference (EDCC), pages 37–44. IEEE.
Cheng, X., Wang, H., Hua, J., Xu, G., and Sui, Y. (2021).
Deepwukong: Statically detecting software vulnera-
bilities using deep graph neural network. ACM Trans-
actions on Software Engineering and Methodology
(TOSEM), 30(3):1–33.
Dahl, G. E., Sainath, T. N., and Hinton, G. E. (2013). Im-
proving deep neural networks for lvcsr using rectified
linear units and dropout. In 2013 IEEE international
conference on acoustics, speech and signal process-
ing, pages 8609–8613. IEEE.
Duan, X., Wu, J., Ji, S., Rui, Z., Luo, T., Yang, M., and Wu,
Y. (2019). Vulsniper: Focus your attention to shoot
fine-grained vulnerabilities. In IJCAI, pages 4665–
4671.
Fan, J., Li, Y., Wang, S., and Nguyen, T. N. (2020). A c/c++
code vulnerability dataset with code changes and cve
summaries. In Proceedings of the 17th International
Conference on Mining Software Repositories, pages
508–512.
Feng, Z., Guo, D., Tang, D., Duan, N., Feng, X., Gong,
M., Shou, L., Qin, B., Liu, T., Jiang, D., et al. (2020).
Codebert: A pre-trained model for programming and
natural languages. arXiv preprint arXiv:2002.08155.
Freeman, L. C. et al. (2002). Centrality in social networks:
Conceptual clarification. Social network: critical con-
cepts in sociology. Londres: Routledge, 1:238–263.
Krizhevsky, A., Sutskever, I., and Hinton, G. E. (2017). Im-
agenet classification with deep convolutional neural
networks. Communications of the ACM, 60(6):84–90.
Li, Z., Zou, D., Xu, S., Jin, H., Zhu, Y., and Chen, Z. (2021).
Sysevr: A framework for using deep learning to detect
software vulnerabilities. IEEE Transactions on De-
pendable and Secure Computing, 19(4):2244–2258.
Li, Z., Zou, D., Xu, S., Ou, X., Jin, H., Wang, S.,
Deng, Z., and Zhong, Y. (2018). Vuldeepecker: A
deep learning-based system for vulnerability detec-
tion. arXiv preprint arXiv:1801.01681.
Lin, G., Zhang, J., Luo, W., Pan, L., and Xiang, Y. (2017).
Poster: Vulnerability discovery with function repre-
sentation learning from unlabeled projects. In Pro-
ceedings of the 2017 ACM SIGSAC conference on
computer and communications security, pages 2539–
2541.
ENASE 2024 - 19th International Conference on Evaluation of Novel Approaches to Software Engineering
166

Mim, R. S., Ahammed, T., and Sakib, K. (2023a). Iden-
tifying vulnerable functions from source code using
vulnerability reports.
Mim, R. S., Khatun, A., Ahammed, T., and Sakib, K.
(2023b). Impact of centrality on automated vulner-
ability detection using convolutional neural network.
In 2023 International Conference on Information and
Communication Technology for Sustainable Develop-
ment (ICICT4SD), pages 331–335. IEEE.
Moghadasi, M. N. and Zhuang, Y. (2020). Sent2vec: A new
sentence embedding representation with sentimental
semantic. In 2020 IEEE International Conference on
Big Data (Big Data), pages 4672–4680. IEEE.
Neuhaus, S., Zimmermann, T., Holler, C., and Zeller, A.
(2007). Predicting vulnerable software components.
In Proceedings of the 14th ACM conference on Com-
puter and communications security, pages 529–540.
Pagliardini, M., Gupta, P., and Jaggi, M. (2018). Unsuper-
vised learning of sentence embeddings using compo-
sitional n-gram features. In Proceedings of the 2018
Conference of the North American Chapter of the As-
sociation for Computational Linguistics: Human Lan-
guage Technologies, Volume 1 (Long Papers), pages
528–540.
Rahman, S., Rahman, M. M., and Sakib, K. (2016). An
improved method level bug localization approach us-
ing minimized code space. In Evaluation of Novel
Approaches to Software Engineering: 11th Interna-
tional Conference, ENASE 2016, Rome, Italy, April
27–28, 2016, Revised Selected Papers 11, pages 179–
200. Springer.
Russell, R., Kim, L., Hamilton, L., Lazovich, T., Harer,
J., Ozdemir, O., Ellingwood, P., and McConley, M.
(2018). Automated vulnerability detection in source
code using deep representation learning. In 2018 17th
IEEE international conference on machine learning
and applications (ICMLA), pages 757–762. IEEE.
Shankar, U., Talwar, K., Foster, J. S., and Wagner, D.
(2001). Detecting format string vulnerabilities with
type qualifiers. In 10th USENIX Security Symposium
(USENIX Security 01).
Shar, L. K., Briand, L. C., and Tan, H. B. K. (2014).
Web application vulnerability prediction using hy-
brid program analysis and machine learning. IEEE
Transactions on dependable and secure computing,
12(6):688–707.
Wu, Y., Schuster, M., Chen, Z., Le, Q. V., Norouzi,
M., Macherey, W., Krikun, M., Cao, Y., Gao, Q.,
Macherey, K., et al. (2016). Google’s neural ma-
chine translation system: Bridging the gap between
human and machine translation. arXiv preprint
arXiv:1609.08144.
Wu, Y., Zou, D., Dou, S., Yang, W., Xu, D., and Jin, H.
(2022). Vulcnn: An image-inspired scalable vulner-
ability detection system. In Proceedings of the 44th
International Conference on Software Engineering,
pages 2365–2376.
Yamaguchi, F., Golde, N., Arp, D., and Rieck, K. (2014).
Modeling and discovering vulnerabilities with code
property graphs. In 2014 IEEE symposium on secu-
rity and privacy, pages 590–604. IEEE.
Yamaguchi, F., Lottmann, M., and Rieck, K. (2012). Gen-
eralized vulnerability extrapolation using abstract syn-
tax trees. In Proceedings of the 28th annual computer
security applications conference, pages 359–368.
Yamaguchi, F., Maier, A., Gascon, H., and Rieck, K.
(2015). Automatic inference of search patterns for
taint-style vulnerabilities. In 2015 IEEE Symposium
on Security and Privacy, pages 797–812. IEEE.
Zhou, Y., Liu, S., Siow, J., Du, X., and Liu, Y. (2019). De-
vign: Effective vulnerability identification by learn-
ing comprehensive program semantics via graph neu-
ral networks. Advances in neural information process-
ing systems, 32.
Zou, D., Wang, S., Xu, S., Li, Z., and Jin, H. (2019).
µvuldeepecker: A deep learning-based system for
multiclass vulnerability detection. IEEE Transactions
on Dependable and Secure Computing, 18(5):2224–
2236.
Automated Software Vulnerability Detection Using CodeBERT and Convolutional Neural Network
167
