
Coordinated Route Recommendation for Improving Social Distancing in
a Congested Subway Network
Maria Elsa
1
, Hung-Jui Chang
2
, Da-Wei Wang
3
, Chih-Wen Hsueh
1
and Tsan-sheng Hsu
3
1
Department of Computer Science and Engineering, National Taiwan University, Taiwan
2
Deparement of Computer Science and Engineering, National Dong Hwa University, Taiwan
3
Institute of Information Science, Academia Sinica, Taiwan
Keywords:
Public Transit, Agent-Based Simulation, Multi-Agent Reinforcement Learning, Shortest Path, Multi-Agent
Path Finding.
Abstract:
We investigate the problem of providing coordinated route recommendations to subway passengers to reduce
peak-hour congestion and improve social distancing during a pandemic such as COVID-19. We develop
TransMARL, a model-free method that combines multi-agent reinforcement learning and curriculum learning
to learn optimal routing policies by interacting with the environment. Furthermore, TransMARL is simple in
design and adapts the framework of centralized training with decentralized execution. Applying TransMARL
to the busy Taipei Metro network with more than 2 million daily ridership, our simulation result shows that
overcrowded passengers can be reduced by more than 50% with less than 10 minutes increasing traveling time
when 20% or more passengers follow the provided route guidance. The result outperforms previous well-
known transit assignment methods, e.g., the all-or-nothing and stochastic user equilibrium.
1 INTRODUCTION
As the population grows, the number of people on
the road during peak hours increases, and crowd-
ing in public transport is inescapable. Studies have
found that overcrowding induces travel delays and
negatively affects passengers’ well-being, including
increased anxiety, stress, and exhaustion (Tirachini
et al., 2013). During the outbreak of pandemic, such
as the COVID-19 pandemic, riding a densely packed
vehicle could also increase infection risk. Even
though there was a significant drop in ridership during
the outbreak, the risk of contagion could be escalated
once ridership rebounded to normal. Consequently,
finding a strategy to reduce overcrowding is neces-
sary (Teixeira and Lopes, 2020). Furthermore, even if
the ridership stays low, the crowding problem during
peak hours is inevitable.
While it is impossible to eliminate congestion en-
tirely, its effect can be reduced by various policy mea-
sures. Several approaches to relieve congestion in
public transport have been studied. Early bird ticket
strategy, where passengers were offered free tickets
for trips completed before 7 A.M. was implemented
in Melbourne rail system (Currie, 2010). In some
large metro stations in China (Beijing, Shanghai, and
Guangzhou), a station inflow control scheme is em-
ployed to limit the number of passengers waiting at
the platform, purchasing area, and ticket gates (Zou
et al., 2018). Real-time crowding information was
provided in the Stockholm metro to encourage pas-
sengers to board less crowded vehicles, thus leading
to a more uniform passenger load distribution (Zhang
et al., 2017).
Finding a feasible policy to reduce the time spent
on highly packed vehicles is a significant challenge
as transit overcrowding is more than planning and
overpopulation; it also includes behavior prediction
and adaptation. To help estimate the distribution of
passengers and validate the effectiveness of diverse
policies, transport planners and researchers employ
transit assignment models. These models take an
origin-destination (OD) matrix of passenger demand
and a transit network as input, estimate the travelers’
choices of route, and then generate aggregate rider-
ship statistics as output. The output can then be used
to assess the effectiveness of a particular policy and
the overall performance of the transit network.
Most transit assignment models are built based
on user equilibrium conditions (Wardrop, 1952), in
which no traveler can improve his/her perceived util-
ity cost by switching routes. However, its static char-
Elsa, M., Chang, H., Wang, D., Hsueh, C. and Hsu, T.
Coordinated Route Recommendation for Improving Social Distancing in a Congested Subway Network.
DOI: 10.5220/0012709800003758
Paper published under CC license (CC BY-NC-ND 4.0)
In Proceedings of the 14th International Conference on Simulation and Modeling Methodologies, Technologies and Applications (SIMULTECH 2024), pages 27-36
ISBN: 978-989-758-708-5; ISSN: 2184-2841
Proceedings Copyright © 2024 by SCITEPRESS – Science and Technology Publications, Lda.
27

acteristic is criticized as inapplicable to the networks
with time-varying OD demands. Moreover, the con-
ventional equilibrium model is structurally incompat-
ible with observed user behavior, namely user route
choices habits, random variations in demand and net-
work conditions, as well as transient effects (Cascetta
and Cantarella, 1991). A better approach is to em-
ulate the process leading to equilibrium instead of
solely finding a fixed point. Therefore, to model each
agent’s decision-making process at each stop and to
better understand passengers’ behavior, we propose
to use an agent-based model. Furthermore, to find ef-
fective policies and strategies, we also incorporate a
learning-based model.
We implement a learning approach based on a pol-
icy gradient variant of reinforcement learning (RL)
called PPO (Schulman et al., 2017). We first formu-
late the transit assignment problem as Markov games
(Littman, 1994), where each agent’s observation is a
2D representation of the agent’s surrounding area, and
the action is to board or alight the train.
The organization of this paper is as follows. Sec-
tion 2 provides a detailed formulation of the underly-
ing problem, including network representation, simu-
lation framework and path allocation model. Section
3 describes the methodology used, which consist of
multi-agent actor-critic, model architecture and cur-
riculum learning. In Section 4, we present Taipei sub-
way network dataset, experimental settings and train-
ing parameters. Section 5 shows the result of our
experiments and discussion and further analysis. Fi-
nally, in Section 6 we give a summary of this work as
well as our conclusion.
2 PROBLEM FORMULATION
2.1 Network Representation
We consider a transit network consisting of a set of
distinct lines and stations. A line is a group of sta-
tions that passengers can transit with the same train,
and stations are the place where passengers board and
alight vehicles. The transit network is represented as
a graph G = (N,
¯
E) where the node set N represents
stations and directed edges set
¯
E represents network
links. There are two kinds of edges:
1. In-vehicle travel edge, corresponding to a route
between two adjacent stations.
2. Walk edge, corresponding to a link between two
adjacent transfer stations.
Each directed edge e
i j
from n
i
to n
j
is associated with
a travel cost c
i j
which corresponds to the time travel-
ings from n
i
to n
j
.
E
s
is defined as the set of transit paths on route
section s and s is a route section between passenger’s
origin node n
O
to destination node n
D
. The expected
travel time from origin to destination is defined as:
T (n
O
, n
D
) = W
¯
E
s
+V
¯
E
s
+ K
¯
E
s
, (1)
where W
¯
E
s
is the expected waiting time, V
¯
E
s
is ex-
pected in-vehicle time, and K
¯
E
s
is expected walking
time.
Only common/attractive lines are considered in
this study.
¯
E
s
represents a set of attractive lines that
consists of paths with expected time delay less than or
equal to a given constraint. More formally,
Definition 2.1 (Attractive path). A path P(n
O
, n
D
) ∈
E
s
is an attractive path if T (n
O
, n
D
) ≤ δT
∗
(n
O
, n
D
).
where T
∗
(n
O
, n
D
) is the minimum travel time and
δ = 2.
BL11
BL12
BL13
BL14
R11
R10
R09
R08
R07
R06
R05
O08
O07
O06
G12
G13
G14
G15
Figure 1: Illustration of a sample network.
Figure 1 provides a schematic chart illustrating the
attractive lines notion used in this study. A passenger
whose origin is at node BL11 and destination at node
R05 would only consider two different routes, specif-
ically (BL11 - BL12 - R10 - R09 - R08 - R07 - R06
- R05) and (BL11 - BL12 - BL13 - O07 - O06 - R07
- R06 - R05). Three other routes (BL11 - G12 - G13
- G14 - R11 - R10 - R09 - R08 - R07 - R06 - R05,
BL11 - G12 - G13 - G14 - R11 - R10 - BL12 - BL13
- O07 - O06 - R07 - R06 - R05 and BL11 - G12 - G13
- G14 - G15 - O08 - O07 - O06 - R07 - R06 - R05)
that traverse through the green line are not considered
attractive.
2.2 Simulation Framework
The agent-based approach to transit assignment sim-
ulates the dynamics of vehicles and travellers in the
transit system and yields the temporal and spatial
distribution of the later over the former. A mod-
elling framework for emulating transit dynamics is
presented in Figure 2. The dynamic representation of
a public transportation system involves two primary
agent categories: vehicles and travellers.
SIMULTECH 2024 - 14th International Conference on Simulation and Modeling Methodologies, Technologies and Applications
28
Network Topolo gy
Train Schedule
Passengers
Environment Module
Agent Module
Agent Decisions
Decision Making
Module
Transit Performance
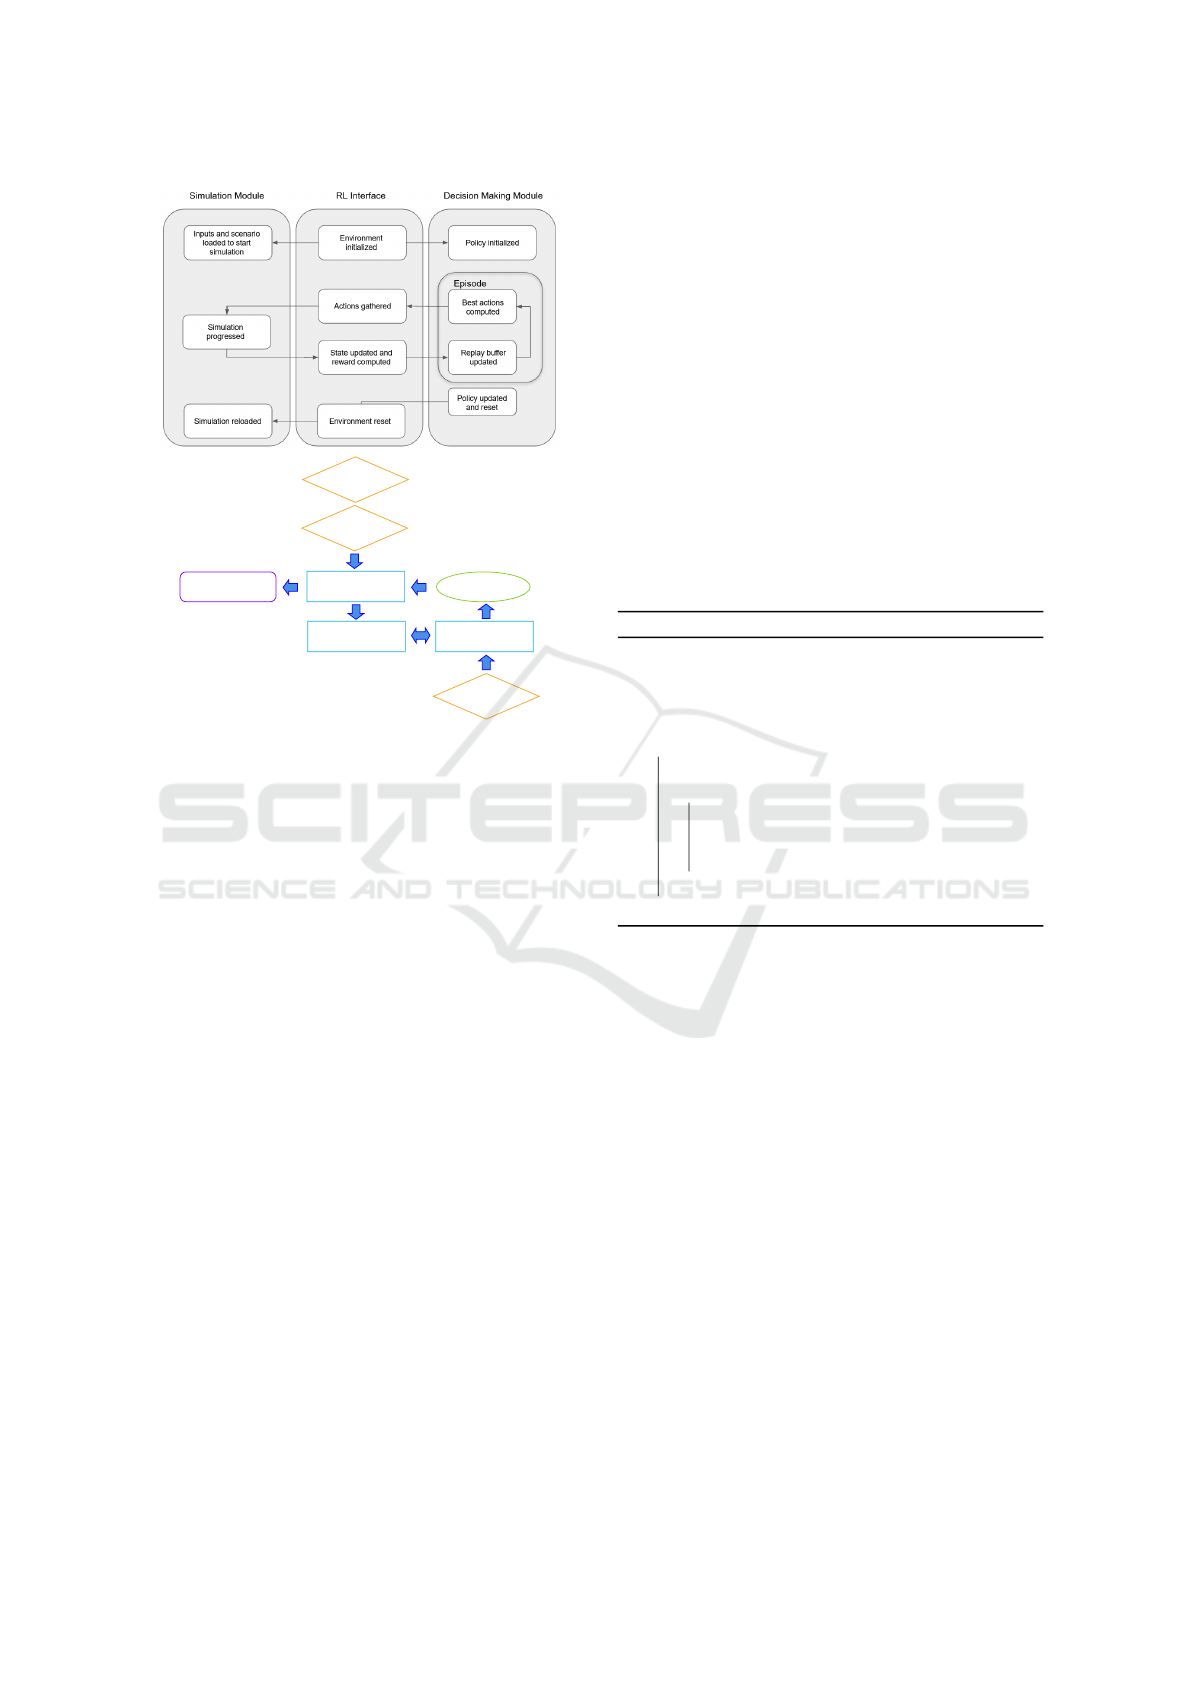
Figure 2: Framework for multi-agent transit operations and
assignment model. The above part shows the three main
modules and the below part shows the interactions among
these three modules.
In Figure 2, There are three main modules: sim-
ulation module, RL interface and decision making
module. The simulation module holds the underly-
ing subway network and controls the operation of the
trains. This module takes network topology, train
schedule and its attributes, along with travel itinerary
of each individual passenger as inputs. It initializes
the simulation environment and then passes initial
state to interface module. Upon receiving all passen-
gers’ action from interface module, it applies all of the
actions on environment, progresses to the next state,
and passes the new state to interface module. When
the reset command is given, all trains and agents are
returned back to their origin position. A simplified
algorithm is provided in Algorithm 1.
The RL interface module handles the interaction
and message passing between simulation and decision
making modules. This module also acts as an entry
point to interact with the whole framework. At first,
the environment is initialized, which in turn starts the
simulation and initializes policy network. After the
initialization is finished, initial state is passed to de-
cision making module. At each time step, actions
for guided agents are collected from decision making
module and greedy actions for unguided agents are re-
trieved from a pre-computed table. These actions are
then passed to simulation module. Subsequently, the
updated state and reward are sent to decision making
module to be processed. When an episode is over, a
signal is sent to reset both simulation and policy mod-
ules. In addition, statistics are accumulated to mea-
sure the performance of current policy.
The decision making module first initializes the
policy with random parameter or parameter learned
from previous learning stage. At each time step, it
computes an optimal action for each agent based on
its observation and current best policy, then stores a
tuple of states, actions, rewards and next states in the
replay buffer. When terminal state is reached, policy
is updated according to cumulative reward and the
environment is reset. Basically, this module learns a
strategic policy to minimize overall congestion from
both trains and agents spatial distribution.
Algorithm 1: MRT Simulator.
1 SetAlCapHSkip0cm
input : network topology, train schedules,
passengers’ itinerary
2 Initialize train and agent states
3 for t ∈ T do
4 Get all trains R that arrive at time t
5 for r ∈ R do
6 Get actions for all passengers
7 Apply the chosen actions
8 Update state of train r
9 end
10 end
2.3 Path Allocation Model
2.3.1 User Classes
In a situation where route recommendation is pro-
vided to passengers, at least two user classes are de-
fined: those who follow the guidance and those who
do not follow the guidance (Van Vuren and Watling,
1991). Each of these user classes would have a differ-
ent perception and behavior that lead to different route
choices. The guided agents completely follow the
route recommendations given by our trained model,
while unguided agents follow a greedy policy. Con-
sequently, unguided agents always board the first in-
coming vehicle with the shortest total travel time, re-
gardless of the congestion level.
2.3.2 Observation Space
We consider a partially-observable discrete grid-
world, where agents can only observe the state of the
Coordinated Route Recommendation for Improving Social Distancing in a Congested Subway Network
29

Figure 3: Observation space for each agent. The grid cells
around the cyan grid denote the region that can be observed
by those agents within the cyan grid.
world in a limited view centered around themselves
in a 10x10 grid. We assume a fixed observation space
can allow the policy to generalize to arbitrary world
sizes and also helps to reduce the input dimension to
the neural network. In this limited observation, we
separate the available information into different chan-
nels to simplify the agents’ learning task. Specifically,
each observation consists of matrices representing the
position of trains, position of other agents, and the
agent’s own goal location within the 10x10 window
(see Figure 3). Additionally, we also give information
about agent’s travel itinerary, such as the coordinate
of origin, the coordinate of destination, the shortest
time to arrive at destination, number of passengers at
current station, the number of passengers on the cur-
rent train, station ID, train ID, as well as the estimated
traveling time. To encode agent’s identity, agent ID is
appended to its itinerary features.
2.3.3 Action Space
In the original transit assignment problem a passen-
ger chooses a specific path from the set of attractive
routes. To allow more flexible path choices, instead of
selecting a fixed path prior to departure, we are mod-
eling passenger’s decision making process on the way
when s/he travels. When passengers start from their
origin the exact path they use is neither known nor
decided upfront. The agent takes each action decision
based on the hidden mental model that evaluates all
of the attractive routes.
At each stop, passengers have two choices,
whether to board the train or wait for the next train.
When passengers are on the train and the particular
train is at a stop, they can choose to stay or alight
the train. At each time step, only 2 actions are valid,
so we masked out invalid actions. We experimentally
observed that this approach enables more stable train-
ing, compared to giving negative rewards to agents
for selecting invalid moves. Additionally, to combat
the problem of getting oscillating policies on the way
to convergence, agents are prevented during training
from returning to the station they visited before. This
is necessary to encourage exploration and to learn ef-
fective policies.
We implement a queuing mechanism to imitate the
actual boarding process where each agent’s boarding
priority is based on his arrival time at the current stop.
Accordingly, when a vehicle is at full capacity and
no boarding action is possible, agents with later ar-
rival time are denied boarding. This leads to increased
waiting time and influence agent’s path choice.
2.3.4 Reward Structure
Our reward function follows the same intuition that
most reward functions for gridworlds use, where
agents are punished for each time step they are not
arriving at the destination, leading to the strategy of
reaching their goals as quickly as possible.
To reflect the passenger comfort and crowding lev-
els within the transit vehicle, agents are given a re-
routing penalty according to the average area per per-
son in the car (m
2
/person). Four crowding levels (b)
are used for this measure, ranging from comfortable
(≥ 0.83m
2
/person), normal ((0.83, 0.47]m
2
/person),
slightly packed ((0.47, 0.28]m
2
/person), and packed
(< 0.28m
2
/person) (Weng, 2020). The re-routing
penalty is calculated as a step-wise function. A con-
stant amount of penalty c is given for the comfort-
able and normal crowding levels, while crowding
penalty proportional to the multiplication of the level
of crowdedness (
1
b
) and duration of traveling (t) is
given for slightly packed and packed crowding levels.
It is calculated as follows where b is agent’s current
area in m
2
:
P
1
=
(
−
1
b
×
t
max
i∈N
t
i
, if b < 0.47
−c, otherwise
(2)
We penalize agents slightly more for staying still
than for moving, which is necessary to encourage ex-
ploration. Agents are penalized for not boarding in-
coming train and wait at the stop station. The amount
of penalty given is a linear function of the waiting
time in seconds. It is calculated as follows where w
i
the waiting time at current stop and a
i
is agent’s action
at time step i:
P
2
=
(
−w
i
, if a
i
= wait
0, otherwise
(3)
Agents are also penalized for doing cross-platform
interchange. The amount of penalty given is a lin-
ear function of the walking time in seconds (k). It is
calculated as follows where k
i
is the walking time at
current stop and s
i
marks the current station:
SIMULTECH 2024 - 14th International Conference on Simulation and Modeling Methodologies, Technologies and Applications
30
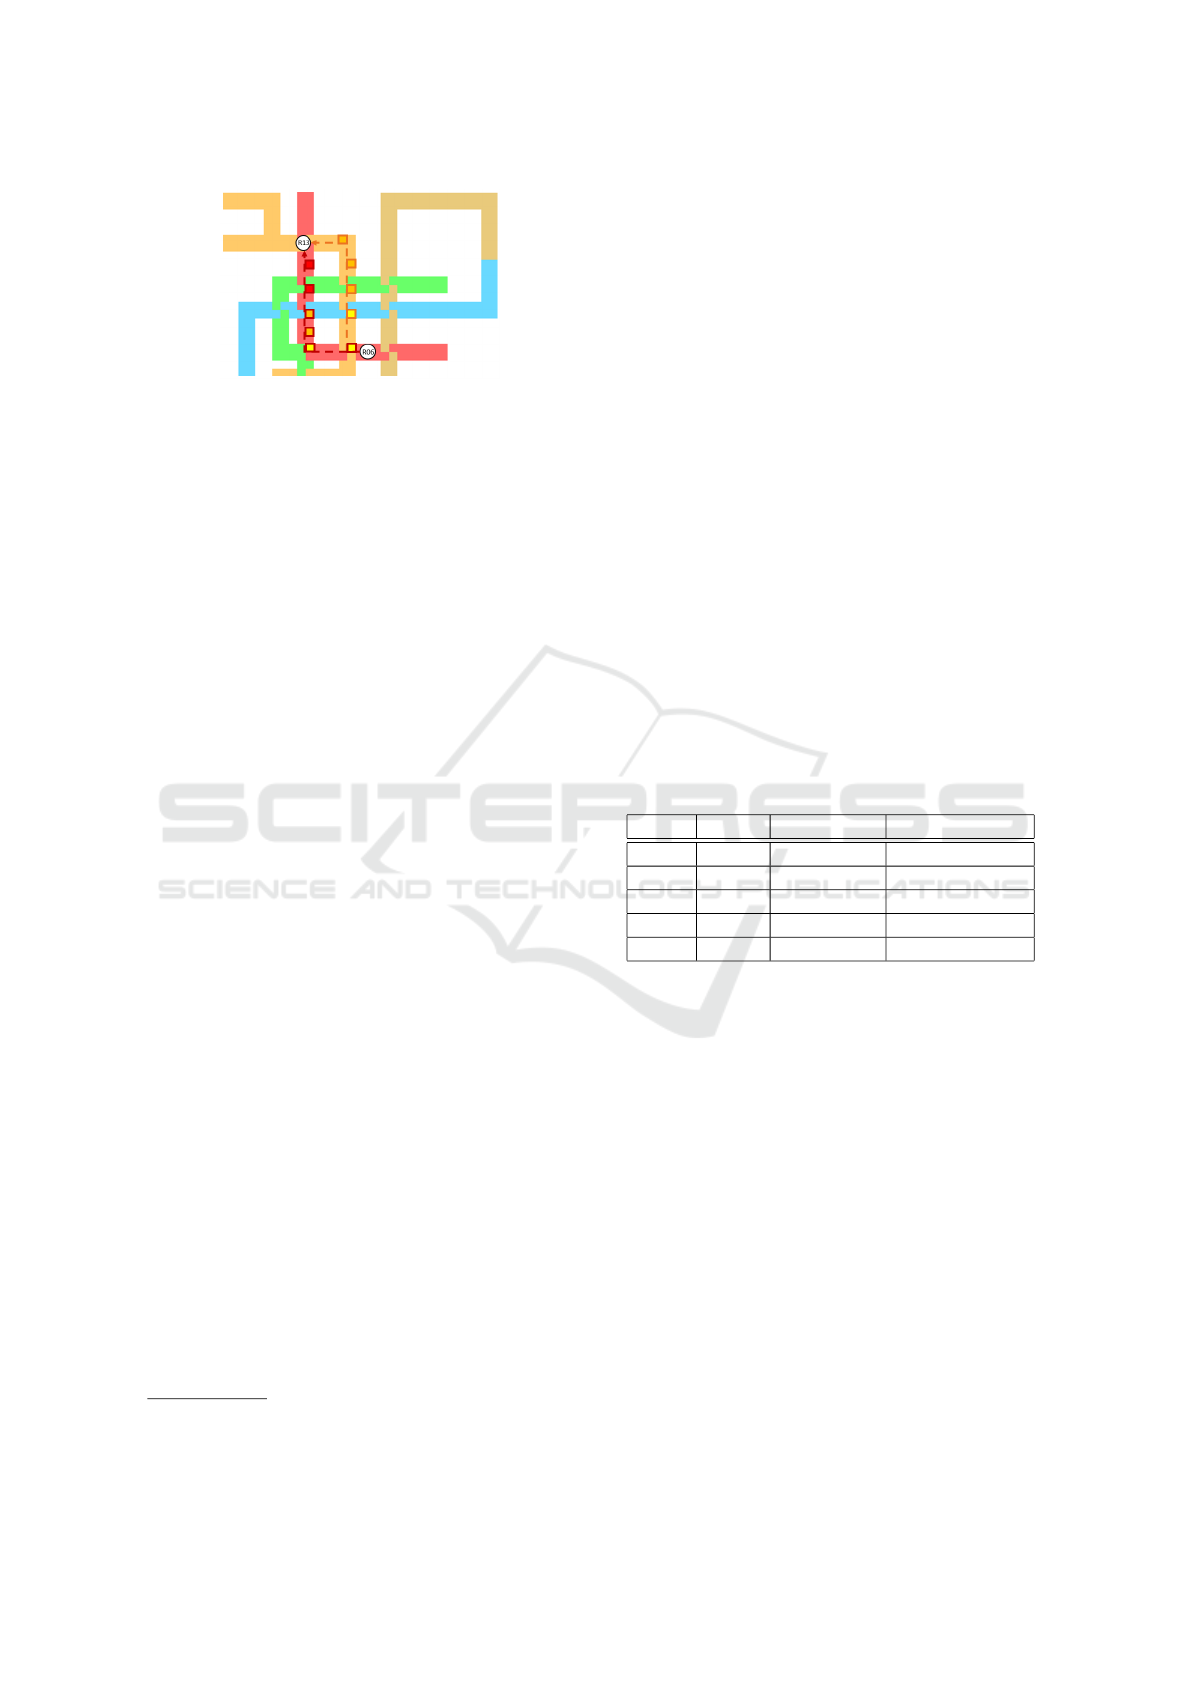
Figure 4: Illustration of alternative route.
P
3
=
(
−k
i
, if s
i−1
= s
i
0, otherwise
(4)
The total reward is calculated as linear combina-
tion of waiting penalty and re-routing penalty. Its for-
mula is given by
r = αP
1
+ βP
2
+ ηP
3
, (5)
where α is weight of re-routing reward, β is weight of
waiting reward, and η is weight of walking reward:
2.4 Use Case
We consider a route planning and navigation system
such as Google Maps
1
and Waze
2
, where users are
given a routing plan for their trip. However, in this
work the locations are limited to subway stations.
Each user requests for a trip using an application on a
mobile client. The application asks the user to input a
starting station, a destination station, the date and the
starting time of trip. The input data is processed, then
an efficient route from the origin to destination station
and an estimated time of arrival (ETA) are provided.
2.4.1 Alternative Route
The application will recommend an alternative route
that might be longer than the shortest path, but has
lower crowding level in general. Consider the sce-
nario illustrated in Figure 4, which shows a user who
wants to travel from R06 to R13. There are two attrac-
tive paths to reach R13 from R06 marked by dashed
line. The dark red line indicates the shortest path,
whereas the dark orange line indicates an alternative
path. Along the path, the current crowding condi-
tion at each station is shown. The train color repre-
sents crowding condition, red for packed, orange for
slightly packed, yellow for normal and green for com-
fortable.
It can be seen that there are two normal, two
slightly packed and two packed trains along the short-
est path. As for the alternative path, there are two
1
https://www.google.com/maps
2
https://www.waze.com/
normal and three slightly packed trains. It is obvious
that the crowding level of orange line is better than
red line. However, if the user were to follow the alter-
native path, s/he would have to transfer at station R07
to orange line, which results in longer travel time. By
comparing the crowding level and the travel delay in-
curred, our system recommends the dark orange path
to the user. It should be noted that our recommenda-
tion system will not suggest the user to board or alight
at stations different than the inputted data.
2.4.2 Coordination
In real-world scenario, the demand to travel from the
same OD pairs would be high. Following the previous
scenario, let’s assume that the demand to travel from
station R06 to R13 is 300. Considering the crowding
condition in Figure 4, assigning dark orange path to
all passengers would only create a new congestion on
the alternative path. To avoid this, our system will try
to distribute the passengers so that the overall crowd-
ing time is minimized by giving different routing rec-
ommendations. For instance, 200 passengers are as-
signed to alternative path and 100 passengers are as-
signed to shortest path.
Table 1: Illustration of train schedule at station R06.
Time Train Destination Crowding level
08:09 10103 Tamsui Packed
08:12 10121 Tamsui Packed
08:15 10137 Tamsui Packed
08:18 10142 Tamsui Slightly packed
08:21 10154 Tamsui Slightly packed
In addition to alternative path, our solution will
also optimize each user’s departure time. By provid-
ing a suggested departure time, users can spend their
time at home or office as opposed to waiting or queu-
ing on the platform. As an example, we can see from
Table 1 that the first three trains are packed. Accord-
ing to our coordination policy, 10 passengers are as-
signed to each of the packed trains and 35 passengers
are assigned to each of the slightly packed trains.
3 METHODOLOGY
In this section, we develop TransMARL method to
solve passengers routing and transit assignment prob-
lem.
Coordinated Route Recommendation for Improving Social Distancing in a Congested Subway Network
31
3.1 Multi-Agent Actor-Critic
Our work relies on Proximal Policy Optimization
(Schulman et al., 2017) and adopts the framework
of a centralized training with a decentralized evalu-
ation (Lowe et al., 2017). We use deep neural net-
work to approximate the agent’s policy, which maps
the current observation of its surroundings to the next
action to take. Following the framework of Markov
games with N agents, each agent learn its own policy
π = {π
1
, ..., π
N
} parameterized by θ = {θ
1
, ..., θ
N
}.
The gradient of agent i’s expected return with respect
to policy parameters J(θ
i
) is given by:
∇
θ
i
J(θ
i
) = E
s∼p
π
,a
i
∼π
i
[∇
θ
i
logπ
i
(a
i
|o
i
)Q
π
i
(x, a
1
, ..., a
N
)]
(6)
where Q
π
i
(x, a
1
, ..., a
N
) is a centralized Q-value func-
tion for agent i. This centralized Q-value function
receives the state information x and actions of all
agents, a
1
, ..., a
N
as input. The state x consists of ob-
servations of all agents’ itinerary information and a
global 10x10 array.
The centralized action-value function Q
π
i
is
learned by minimizing the loss:
L(θ
i
) = E
x,a,r,x
′
[(Q
π
i
(x, a
1
, ..., a
N
) − y)
2
], where
y = r
i
+ γQ
π
′
i
(x
′
, a
′
1
, ..., a
′
N
)|
a
′
j
=π
′
j
(o
j
)
(7)
In addition, the replay buffer D stores experiences
of all agents (x, x
′
, a
1
, ..., a
N
, r
1
, ..., r
N
).
3.2 Parameter Sharing
First, learning agents are partitioned into 10 different
groups. The groups are determined based on passen-
ger’s origin station. Basically, each line is divided in
half. For instance, red line is divided into two seg-
ments where stations R01-R14 belong to the first seg-
ment and stations R15-R28 belong to the second seg-
ment. There are 5 lines considered in this study, so
there are 10 groups in total.
To reduce time complexity and speed up the learn-
ing process, we assume that passengers in the same
group share similar routing strategies and agents in
the same group share the same parameters. Accord-
ingly, agents in the same group use and make update
to a collective shared policy. Hence, only 10 parame-
ters θ = {θ
1
, ..., θ
10
} are learned.
3.3 Model Architecture
The neural network used to approximate agent’s pol-
icy has multiple outputs, namely the actual policy and
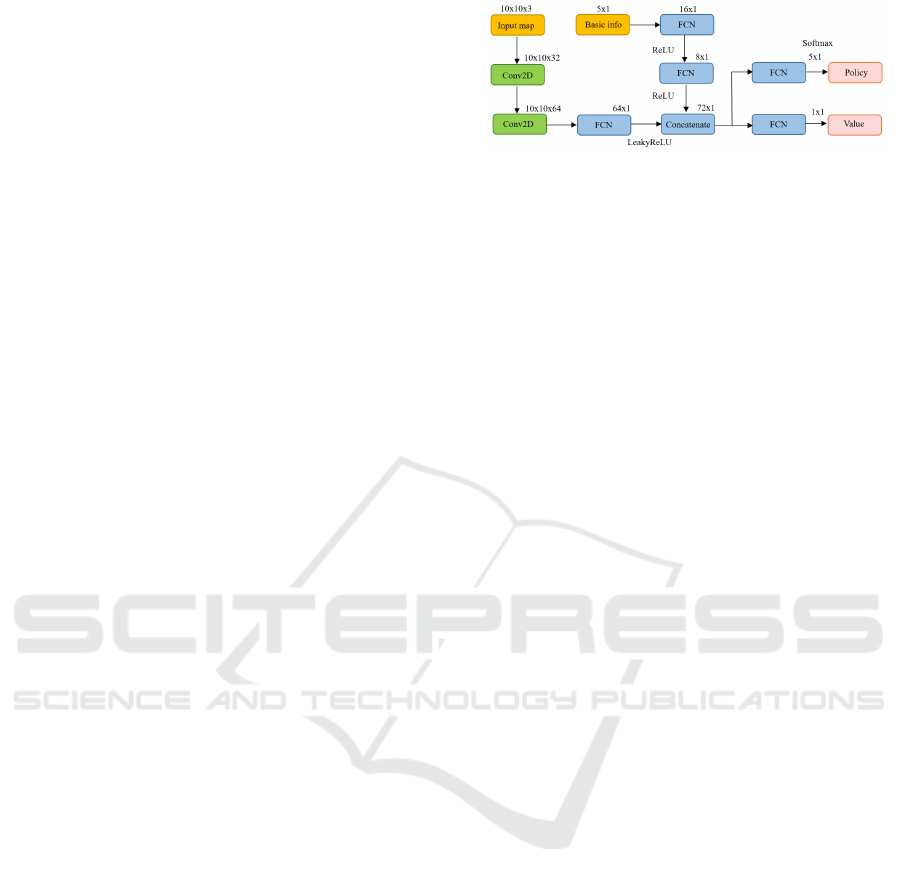
Figure 5: The neural network consists of 2 convolutional
layers, followed by a fully connected layer.
value policy to assess the quality of different policies.
We use a simple 2-layer convolutional network fol-
lowed by a fully connected (fc) layer to extract map
features and 2-layer fc to extract basic info features as
illustrated in Figure 5. Specifically, the two inputs to
the neural network - map observation and basic infor-
mation - are preprocessed independently, before being
concatenated half-way through the neural network.
The three-channel matrices i.e., 10 × 10 × 3 tensors
representing the local observation are passed through
two convolutions, followed by a last fc layer. In par-
allel, the basic info are passed through two fc layer.
The concatenation of both of these pre-processed in-
puts is then passed through the two output layers. The
output layers consist of the policy neurons with a soft-
max activation function, and the value output.
3.4 Curriculum Learning
Due to the nature of our environment that has large
population, it is hard to trace back the change in the
reward signal to each agent. As a result, training takes
a long time to converge. A direct training with PPO
with 130K guided agents does not yield sensible per-
formance. To address this, we use curriculum learn-
ing (Bengio et al., 2009) that trains an agent with a se-
quence of progressively more difficult environments.
By varying the number of guided agents, we could
control the difficulty level.
We progressively increase the population of
guided agents throughout the training process. Par-
ticularly, we divide the learning procedure into mul-
tiple stages with increasing number of guided agents
in the environment. An agent first learn to travel from
the origin to its destination in a simpler scenario with
less agents and then we leverage these experiences
to gradually adapt to later stages with more agents
and ultimately our desired population. In addition
to enable faster training and guide training towards
better region in the parameter space, the purpose of
curriculum learning is in line with our multiple user
class transit assignment problem. We seek to find the
smallest number of guided agents needed to reduce
the overall congestion level by training different num-
ber of guided agents gradually.
SIMULTECH 2024 - 14th International Conference on Simulation and Modeling Methodologies, Technologies and Applications
32
4 EXPERIMENTS
4.1 Datasets
The Taipei subway network considered in this study
consists of 5 bidirectional lines with 12 intersections.
Passenger-related information were extracted from
Taipei MRT AFC transaction data between the year
2017 and 2019 (Department of Transportation, 2019).
These transaction records contain information regard-
ing passenger ID, origin station, destination station,
entrance time, and exit time. The ridership on a typi-
cal weekday is around two million.
The assignment includes 133,097 passengers that
recurrently travel during morning peak hours. These
travelers are associated with 14,161 different origin-
destination pairs and are distributed over more than
600,000 possible paths. The travelers are assumed to
depart everyday within the same 15 minutes time win-
dow. All trips are generated within 2.5 hours, specif-
ically 1 hour warm-up stage to populate the network
with unguided agents, half an hour to distribute all
guided agents, and the last 1 hour to let all agents fin-
ish their trips.
4.2 Experimental Settings
In our experiment, we applied parameter sharing be-
tween agents that share the same origin segment.
Each line is divided in half into two line segments,
to form 10 different line segments in total. Parameter
sharing increases sampling efficiency and thus help
the training converges faster. We experiment with dif-
ferent number of guided agents, ranging from 5% to
60% of total population, increased by 5% at a time.
4.3 Training Parameters
Our training procedure is implemented with Tensor-
Flow 2.1.0 (Abadi et al., 2016). We use Adam
(Kingma and Ba, 2014) with ε = 10
−3
for training.
Batch size is 64, discount factor γ = 0.9997, learning
rate α = 5 × 10
−5
and the policy entropy 0.01. The
model is trained from scratch. The training procedure
runs on a machine with Intel Xeon CPU E5-2699v4 at
2.20GHz, and 2 GTX1080 GPUs. The operating sys-
tem is Ubuntu 18.04. Our final model is trained for
around 3 million mini-batches on multiple different
scenarios.
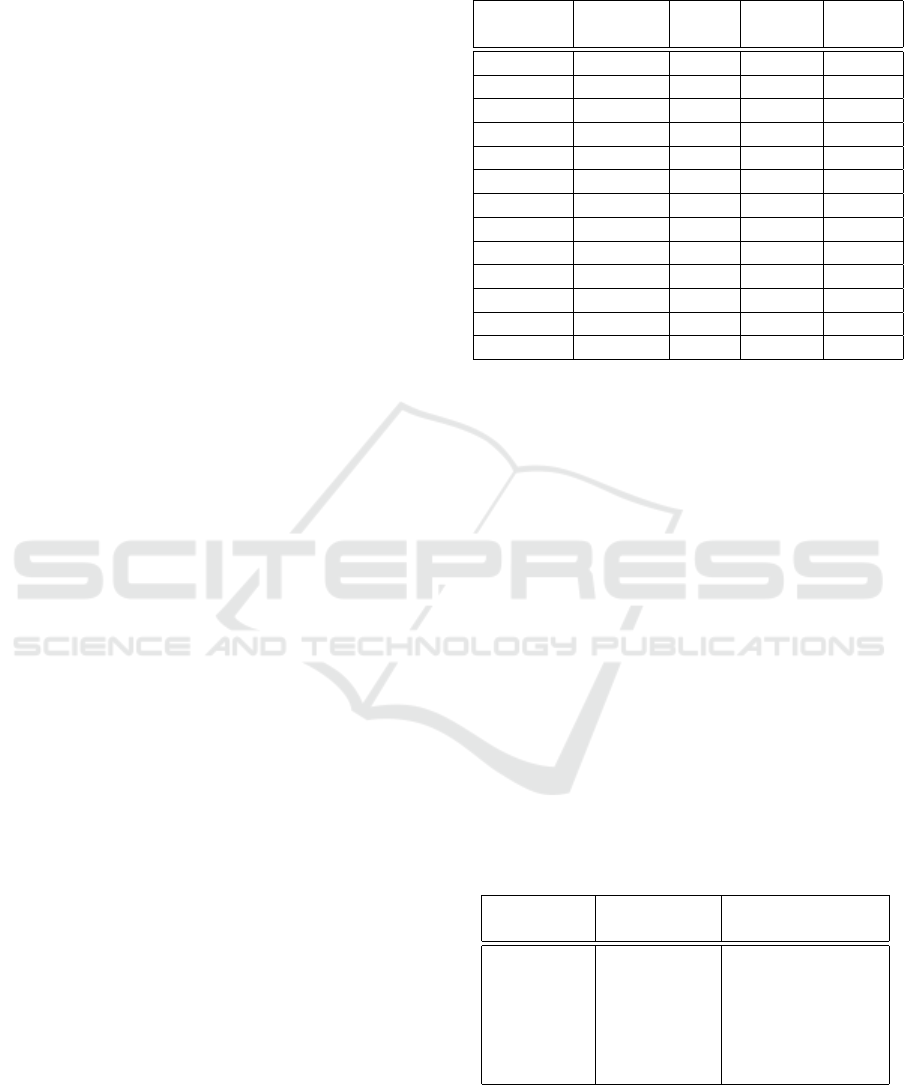
Table 2: Penalty across different percentage of guided
agents.
Guided
agents(%)
Re-route
penalty
Wait
penalty
Transfer
penalty
Total
penalty
0 1186.57 5.74 7.27 1199.58
5 1147.91 6.83 7.97 1162.71
10 1119.48 7.25 8.50 1135.23
15 1085.45 10.93 9.38 1105.76
20 1049.61 14.54 10.11 1074.26
25 1036.54 17.67 10.69 1064.9
30 1020.42 20.89 11.27 1052.58
35 1012.09 23.88 11.86 1047.83
40 1001.80 27.08 12.57 1041.45
45 1001.84 28.51 12.52 1042.87
50 1001.25 31.5 13.14 1045.89
55 1007.03 34.22 13.71 1054.96
60 1021.1 37.04 14.13 1072.27
4.4 Results
4.4.1 Penalty Comparison
It can be seen from Table 2 that re-route penalty de-
creases as the number of guided agents increases.
However, when more than 50% of agents follow the
guidance, the performance starts to deteriorate and re-
route penalty increases. Similarly, total penalty also
decreases as the number of guided agents increases.
However, when more than 40% of agents follow the
guidance, total penalty starts to increase. Further-
more, both wait penalty and transfer penalty increases
as the number of guided agents increases. In other
words, while adding more GAs can further improve
the level of comfort, the cost or time delay perceived
by passengers outweighs the performance gain.
4.4.2 Minimum Number of Guided Agents
Table 3: Travel delay increase and re-route penalty decrease
across different percentage of guided agents.
Guided
agents (%)
Travel delay
(%)
Re-route penalty
decrease (%)
10 3.58 5.84
20 7.90 11.54
30 11.44 14.00
40 14.72 15.56
50 16.13 15.56
60 19.64 13.88
Table 3 shows that while following route recommen-
dation reduces average re-routing penalty, it also in-
creases average travel time. The increase in average
travel time grows linearly with percentage of guided
Coordinated Route Recommendation for Improving Social Distancing in a Congested Subway Network
33
agents. The average re-routing penalty decreases as
the number of guided passengers increases, however,
the reduction started to saturate after more than 50%
of passengers follow the guidance. It can be seen that
the travel delay experienced by 60% of guided pas-
sengers outweigh the congestion reduction advantage.
The largest re-routing penalty reduction occurs when
the number of guided agents is increased to 20%.
The policy’s inability to reduce the total travel
time could be an indication of Taipei Metro network’s
lack of redundancy and limited spare capacity, es-
pecially near overcrowded network segments. Some
passengers going through such segments are likely to
be re-routed to paths with much longer travel times,
hence the increase to average travel time.
4.4.3 Solution Comparison
To evaluate the effectiveness and efficiency of our ap-
proach, we compare the result with well-known tran-
sit assignment models AON and SUE. Additionally,
the result of prominent cooperative multi-agent path-
finding solver (Windowed Hierarchical Cooperative
A*) WHCA* (Silver, 2005) is shown to compare the
optimality of our solution.
Table 4: Penalty comparison between different algorithms.
Model Re-route
penalty
Wait
penalty
Transfer
penalty
Total
penalty
AON 1186.57 5.74 7.27 1199.58
SUE 1175.34 10.13 7.55 1193.02
WHCA* 1069.76 23.04 12.52 1105.32
MARL 1049.61 14.54 10.11 1074.26
Table 5: Comparison of solution quality between different
assignment models.
Model Slightly
packed
Normal Time
delay
GA time
delay
SUE 11.05% 22.53% 0.53 m 1.78 m
WHCA* 32.88% 60.01% 2.68 m 13.4 m
MARL 57.79% 46.37% 1.61 m 8.13 m
Table 4 shows the advantages of our approach
over AON, SUE and WHCA*. First, our approach
converges to lowest re-route penalty in comparison
with the others. Second, congestion is relieved with
minimum cost overhead. This is reflected through
lower wait and transfer penalty compared to WHCA*.
To further demonstrate the ability of our coopera-
tive route recommendation system to reduce conges-
tion, additional evaluation metrics is shown (Table 5).
It can be seen that our solution reduced number of
passengers experiencing highest level of congestion
by 57.79%. Even though WHCA* converted more
slightly packed passengers to normal level of conges-
tion (60.01%), it failed to re-route large number of
passengers who travel through packed routes. Fur-
thermore, time delay incurred by guided agents (GA)
following our guidance is 8.13 minutes on average,
which is lower than WHCA* (13.4 minutes).
4.5 Discussion
From the analysis in the previous sections, the pro-
posed approach in this paper can efficiently distribute
metro passengers from congested routes to under uti-
lized but slower routes by using multi-agent reinforce-
ment learning technique and processed AFC data.
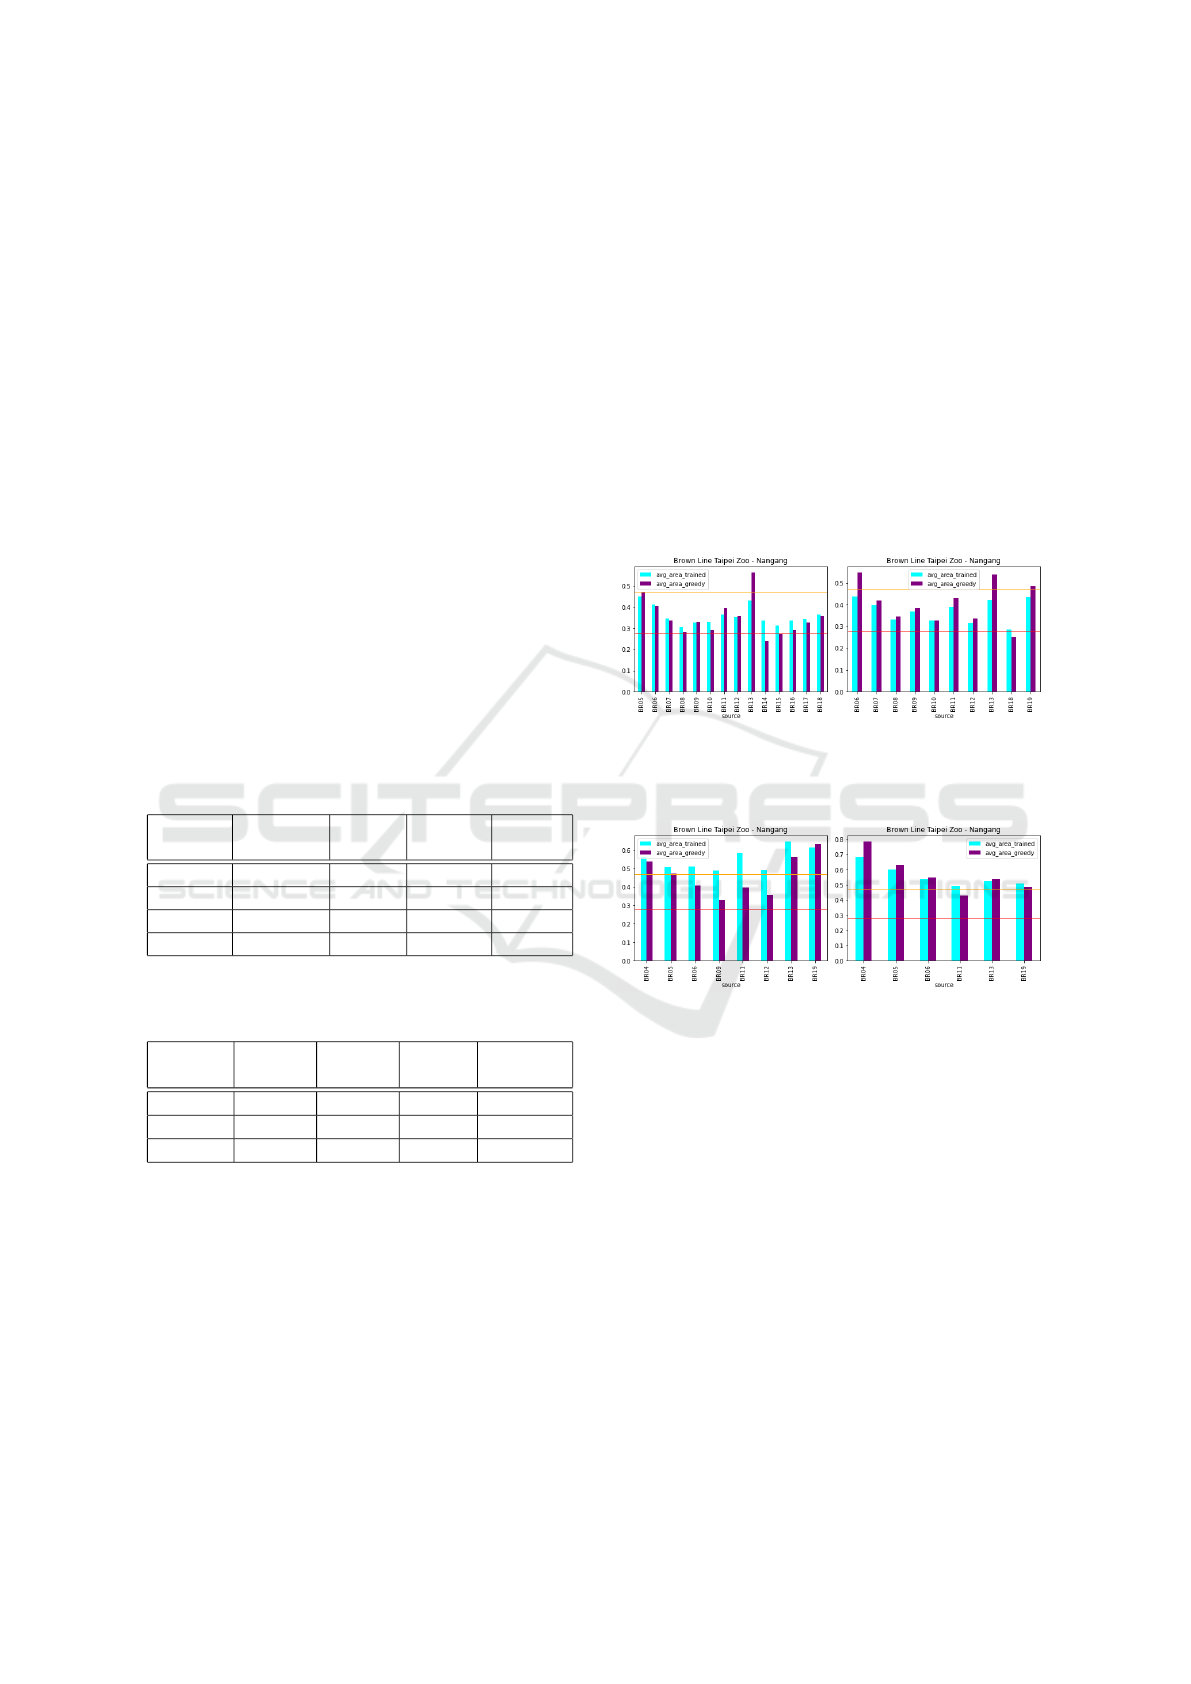
(a) 08:00-08:30 (b) 08:30-09:00
Figure 6: Average passenger area of slightly packed trains
along Brown line - Taipei Zoo - Nangang.
(a) 08:00-08:30 (b) 08:30-09:00
Figure 7: Average passenger area of normal trains along
Brown line - Taipei Zoo - Nangang.
Figure 6a shows that the learned policy tries to in-
crease the level of comfort of trains at overly crowded
stations BR08, BR10, BR14 and BR15. In order to
do that, it makes the distribution of passengers at each
station more evenly distributed by delaying some pas-
sengers’ departure time. The effect of enforcing this
policy can be seen in Figure 6b where the average
area in almost all of slightly packed trains becomes
smaller, in other words increasing the level of crowd-
edness in almost all slightly packed trains. More-
over, we can see from Figure 7a and 7b that there
are no trains at stations BR07, BR08, and BR10 that
belong to normal level of crowdedness. All trains
passing through these stations are either crowded or
slightly crowded. These stations are the main bot-
SIMULTECH 2024 - 14th International Conference on Simulation and Modeling Methodologies, Technologies and Applications
34

tleneck along Brown line and hence more advanced
strategy should be enforced at these stations to im-
prove social distancing.
5 CONCLUSIONS
In this paper, we addressed the problem of multi-
class transit assignment in a congested network us-
ing multi-agent cooperative route guidance system
trained with reinforcement learning method. We
decompose the problem of assigning passengers to
routes as a decision making problem at each stop
and formulate it as Markov games. We then pro-
pose TransMARL, a multi-agent reinforcement learn-
ing method based on Proximal Policy Optimization
(PPO) algorithm with several adaptations, including
parameter sharing and a curriculum learning compo-
nent that speeds up the training process. Empirical
results show that in terms of solution quality, Trans-
MARL can successfully reduce overcrowding in crit-
ical routes by 57.79% with only 8 minutes time delay.
There are some improvements that could be in-
corporated to multi-agent actor critic model in or-
der to increase the overall performance. This work
has been mainly focused on the use of centralized
learning decentralized execution and parameter shar-
ing techniques, leaving the study of other approaches
to induce cooperative behavior outside the scope of
this paper. The following ideas could be tested:
1. The importance of inter-agent communication to
solve tasks that require synchronization has been
long studied. To achieve strong coordination, a
shared communication memory is used. Agents
then learn information sharing and extraction pro-
tocol through the shared memory (Pesce and
Montana, 2020).
2. In a partially observable environment, each
agent has no knowledge of other agents’
goal/destination. Consequently, the agents must
infer other agents’ hidden goal and policy in or-
der to solve the task. There are several ways to
do this: learn a separate representation of other
agents’ policy, use agent’s own policy to predict
other agents’ action, and learn other agents’ poli-
cies directly from other agents’ raw observation.
3. Even though the above-mentioned ideas could po-
tentially increase the overall performance signifi-
cantly, it remains a challenge to make those ap-
proaches scalable to large number of agents. One
possible solution is to estimate the degree of in-
fluence of other agents’ policy on current agent’s
reward and only agents with high degree of influ-
ence are taken into consideration (Jaques et al.,
2019).
The path allocation model developed in this work
mainly focuses on two user classes: guided and un-
guided agents. This is based on the assumption of ho-
mogeneous users. However, each passenger usually
has different route preferences and thus has different
utility cost function. For instance, different passen-
gers with same source and destination may choose
different routes based on their preferences (time-
efficient or congestion-free). An important direction
of future work is to develop a personalized route rec-
ommendation that takes individual route preferences
into account.
ACKNOWLEDGEMENTS
We thank department of transportation, Taipei City
Government for providing data of AFC. This study
was supported in part by NSTC, Taiwan Grants 112-
2221-E-259-016-MY3, MOST 111-2221-E-001-017-
MY3 and MOST 109-2327-B-010-005.
REFERENCES
Abadi, M., Barham, P., Chen, J., Chen, Z., Davis, A., Dean,
J., Devin, M., Ghemawat, S., Irving, G., Isard, M.,
et al. (2016). Tensorflow: A system for large-scale
machine learning. In 12th USENIX symposium on op-
erating systems design and implementation (OSDI16),
pages 265–283.
Bengio, Y., Louradour, J., Collobert, R., and Weston, J.
(2009). Curriculum learning. In Proceedings of
the 26th annual international conference on machine
learning, pages 41–48.
Cascetta, E. and Cantarella, G. E. (1991). A day-to-day
and within-day dynamic stochastic assignment model.
Transportation Research Part A: General, 25(5):277–
291.
Currie, G. (2010). Quick and effective solution to rail over-
crowding: free early bird ticket experience in Mel-
bourne, Australia. Transportation research record,
2146(1):35–42.
Department of Transportation, T. C. G. (2019). Taipei MRT
Automatic Fare Collection Data. https://rnd.ntut.e
du.tw/p/406-1042-97509,r1647.php?Lang=zh-tw.
[Online; accessed 28-January-2024].
Jaques, N., Lazaridou, A., Hughes, E., Gulcehre, C., Or-
tega, P., Strouse, D., Leibo, J. Z., and De Freitas, N.
(2019). Social influence as intrinsic motivation for
multi-agent deep reinforcement learning. In Interna-
tional Conference on Machine Learning, pages 3040–
3049. PMLR.
Coordinated Route Recommendation for Improving Social Distancing in a Congested Subway Network
35

Kingma, D. P. and Ba, J. (2014). Adam: A
method for stochastic optimization. arXiv preprint
arXiv:1412.6980.
Littman, M. L. (1994). Markov games as a framework
for multi-agent reinforcement learning. In Machine
learning proceedings 1994, pages 157–163. Elsevier.
Lowe, R., Wu, Y., Tamar, A., Harb, J., Abbeel, P., and Mor-
datch, I. (2017). Multi-agent actor-critic for mixed
cooperative-competitive environments. arXiv preprint
arXiv:1706.02275.
Pesce, E. and Montana, G. (2020). Improving coordination
in small-scale multi-agent deep reinforcement learn-
ing through memory-driven communication. Machine
Learning, pages 1–21.
Schulman, J., Wolski, F., Dhariwal, P., Radford, A., and
Klimov, O. (2017). Proximal policy optimization al-
gorithms. arXiv preprint arXiv:1707.06347.
Silver, D. (2005). Cooperative pathfinding. Aiide, 1:117–
122.
Teixeira, J. F. and Lopes, M. (2020). The link between
bike sharing and subway use during the COVID-
19 pandemic: the case-study of New York’s citi
bike. Transportation research interdisciplinary per-
spectives, 6:100166.
Tirachini, A., Hensher, D. A., and Rose, J. M. (2013).
Crowding in public transport systems: effects on
users, operation and implications for the estimation of
demand. Transportation research part A: policy and
practice, 53:36–52.
Van Vuren, T. and Watling, D. (1991). Multiple user class
assignment model for route guidance. Transportation
research record, pages 22–22.
Wardrop, J. G. (1952). Some theoretical aspects of road
traffic research. Proceedings of the institution of civil
engineers, 1(3):325–362.
Weng, H. (2020). Taipei MRT launches new measures
for epidemic prevention, vehicle congestion is divided
into 4 levels and can be checked immediately. https:
//health.udn.com/health/story/120952/4546042. [On-
line; accessed 28-January-2024].
Zhang, Y., Jenelius, E., and Kottenhoff, K. (2017). Im-
pact of real-time crowding information: a Stockholm
metro pilot study. Public Transport, 9(3):483–499.
Zou, Q., Yao, X., Zhao, P., Dou, F., and Yang, T. (2018).
Managing recurrent congestion of subway network in
peak hours with station inflow control. Journal of Ad-
vanced Transportation, 2018.
SIMULTECH 2024 - 14th International Conference on Simulation and Modeling Methodologies, Technologies and Applications
36
